| Param | Original file | Final file |
|---|---|---|
| Filename | modeM0/AS1A14_025T01_9000006530_55080cztM0_level2.fits | modeM0/AS1A14_025T01_9000006530_55080cztM0_level2_quad_clean.evt |
| Size (bytes) | 399,985,920 | 96,140,160 |
| Size | 381.5 MB | 91.7 MB |
| Events in quadrant A | 4,133,187 | 597,226 |
| Events in quadrant B | 3,105,761 | 684,188 |
| Events in quadrant C | 3,174,365 | 608,053 |
| Events in quadrant D | 3,879,148 | 561,094 |
| Mode M0 | |||
|---|---|---|---|
| Quadrant | BADHDUFLAG | Total packets | Discarded packets |
| A | 0 | 17105 | 51 |
| B | 0 | 14043 | 58 |
| C | 0 | 14361 | 51 |
| D | 0 | 16458 | 90 |
| Mode SS | |||
|---|---|---|---|
| Quadrant | BADHDUFLAG | Total packets | Discarded packets |
| A | 0 | 136 | 0 |
| B | 0 | 136 | 0 |
| C | 0 | 136 | 0 |
| D | 0 | 136 | 0 |
| Mode M9 | |||
|---|---|---|---|
| Quadrant | BADHDUFLAG | Total packets | Discarded packets |
| A | 0 | 10 | 0 |
| B | 0 | 10 | 0 |
| C | 0 | 10 | 0 |
| D | 0 | 10 | 0 |
| Quadrant | Total seconds | Saturated seconds | Saturation percentage |
|---|---|---|---|
| A | 6599 | 443 | 6.713138% |
| B | 6597 | 68 | 1.030772% |
| C | 6601 | 33 | 0.499924% |
| D | 6595 | 135 | 2.047005% |
Noise dominated data is calculated using 1-second bins in cleaned event files. If a bin has >2000 counts, and if more than 50% of those come from <1% of pixels, then it is considered to be noise-dominated and hence unusable.
| Quadrant | # 1 sec bins | Bins with >0 counts | Bins with >2000 counts | High rate bins dominated by noise | Noise dominated (total time) | Noise dominated (detector-on time) | Marked lightcurve |
|---|---|---|---|---|---|---|---|
| A | 7669 | 6621 | 393 | 393 | 5.12% | 5.94% | 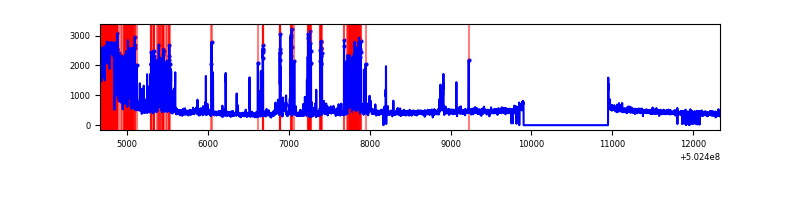 |
| B | 7668 | 6622 | 15 | 15 | 0.20% | 0.23% | 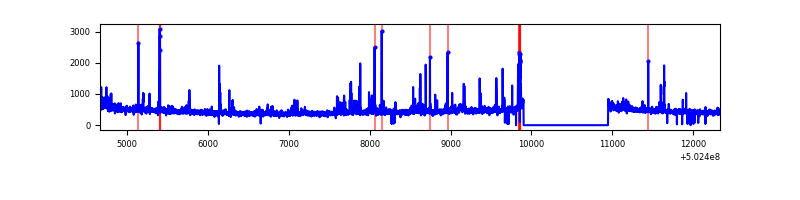 |
| C | 7669 | 6624 | 22 | 22 | 0.29% | 0.33% | 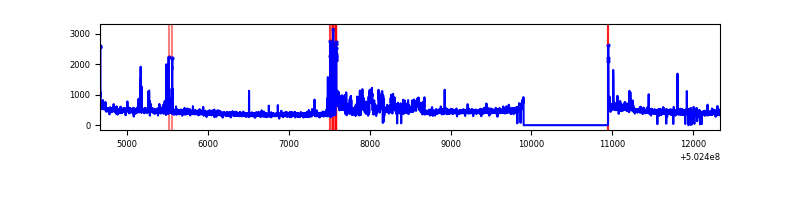 |
| D | 7669 | 6623 | 109 | 109 | 1.42% | 1.65% | 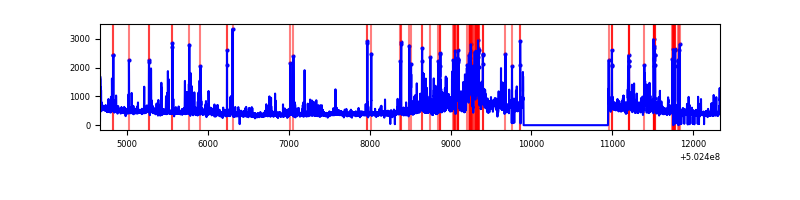 |
Top three noisy pixels from each quadrant. If the there are fewer than three noisy pixels in the level2.evt file, extra rows are filled as -1
| Pixel properties | Quadrant properties | ||||||
|---|---|---|---|---|---|---|---|
| Quadrant | DetID | PixID | Counts | Sigma | Mean | Median | Sigma |
| A | 15 | 32 | 1385171 | 8087.51 | 691 | 674 | 171.2 |
| A | 13 | 254 | 17880 | 100.51 | 691 | 674 | 171.2 |
| A | 15 | 16 | 17301 | 97.13 | 691 | 674 | 171.2 |
| B | 5 | 185 | 112526 | 730.81 | 710 | 681 | 153.0 |
| B | 0 | 182 | 50729 | 327.02 | 710 | 681 | 153.0 |
| B | 2 | 249 | 46731 | 300.89 | 710 | 681 | 153.0 |
| C | 9 | 38 | 286155 | 1473.97 | 700 | 691 | 193.7 |
| C | 13 | 3 | 85881 | 439.87 | 700 | 691 | 193.7 |
| C | 12 | 252 | 23796 | 119.3 | 700 | 691 | 193.7 |
| D | 11 | 129 | 488300 | 2497.76 | 685 | 653 | 195.2 |
| D | 2 | 252 | 108008 | 549.88 | 685 | 653 | 195.2 |
| D | 9 | 1 | 105259 | 535.8 | 685 | 653 | 195.2 |
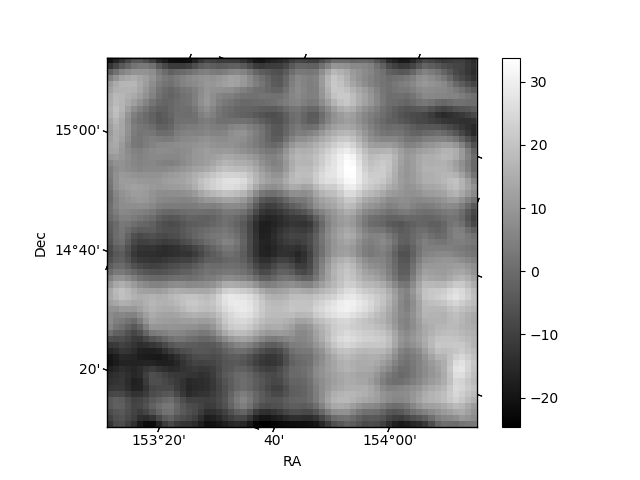
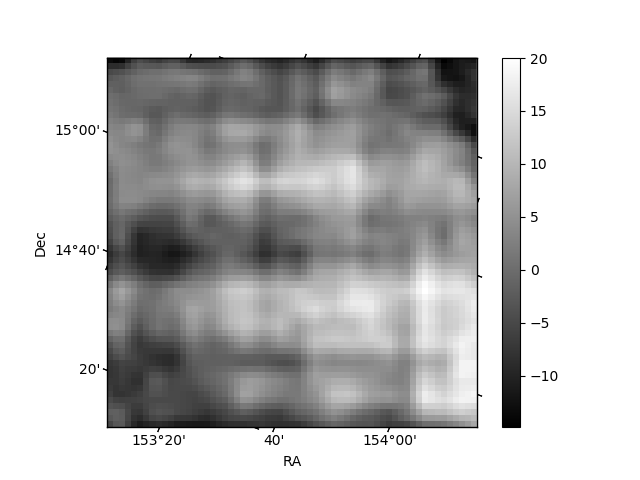
Histogram calculated using DETX and DETY for each event in the final _common_clean file
| Quadrant A | 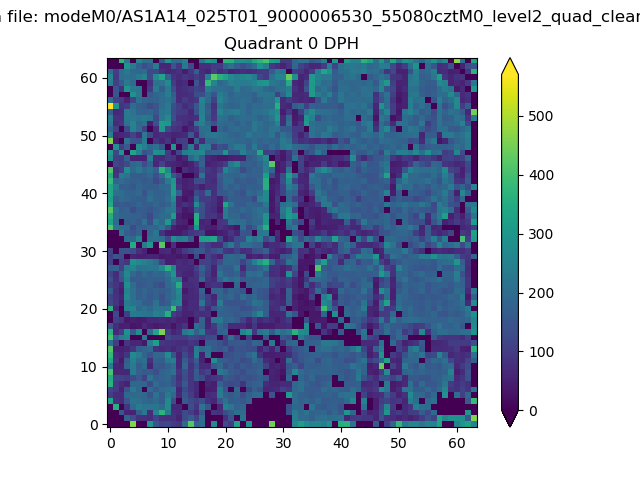 |
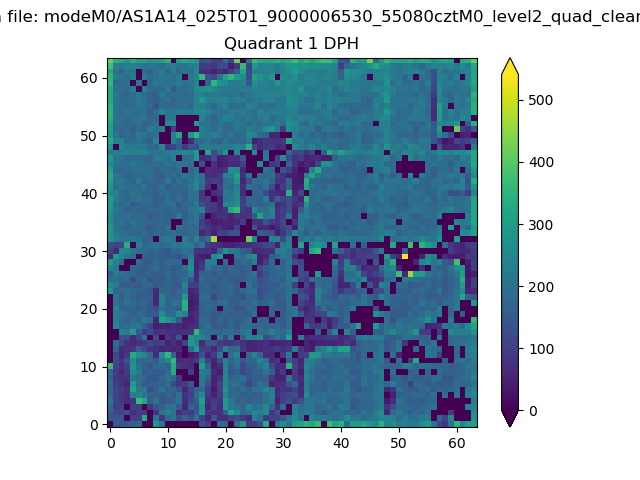 |
Quadrant B |
|---|---|---|---|
| Quadrant D | 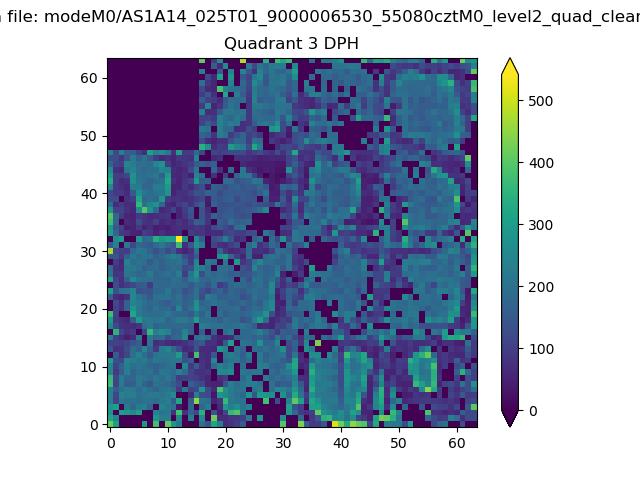 |
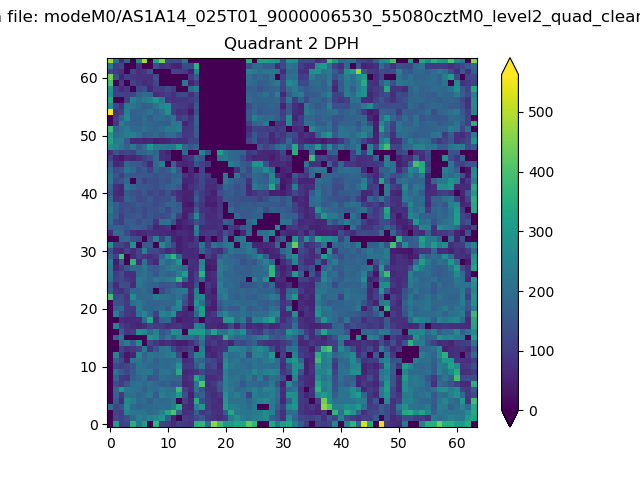 |
Quadrant C |
| Plot type | Count rate plots | Images |
|---|---|---|
| Comparison with Poisson distribution Blue bars denote a histogram of data divided into 1 sec bins. Red curve is a Poisson curve with rate = median count rate of data. |
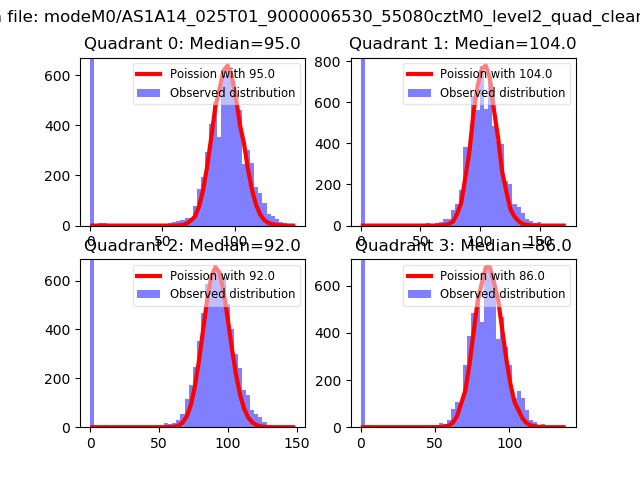 |
 |
| Quadrant-wise count rates Data is divided into 100 sec bins |
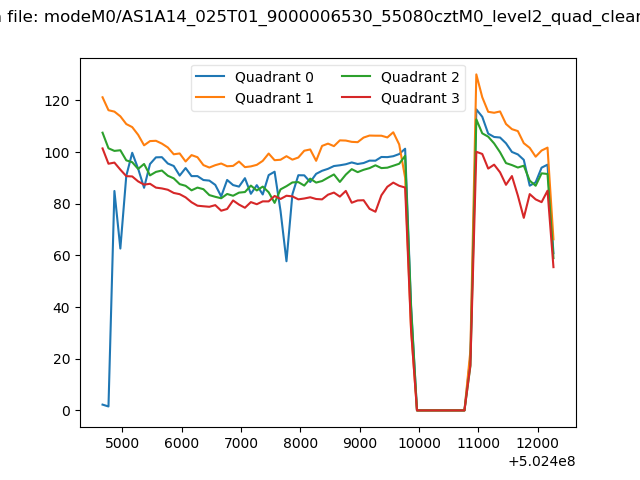 |
|
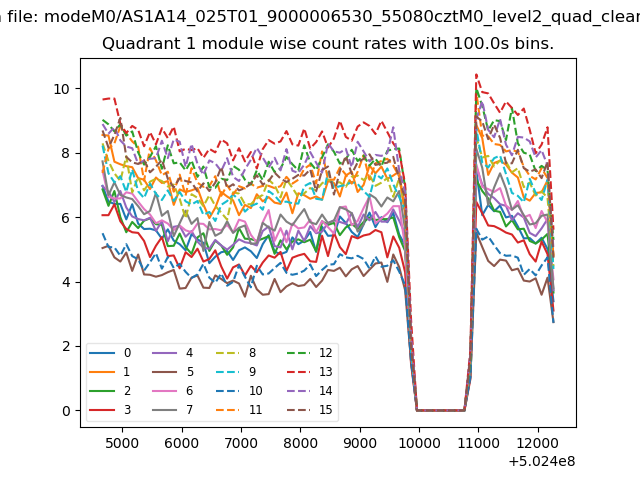
| Module-wise count rates for Quadrant A Data is divided into 100 sec bins |
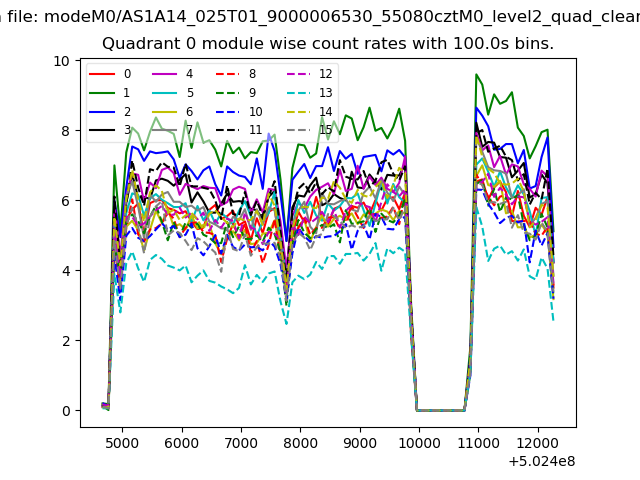 |
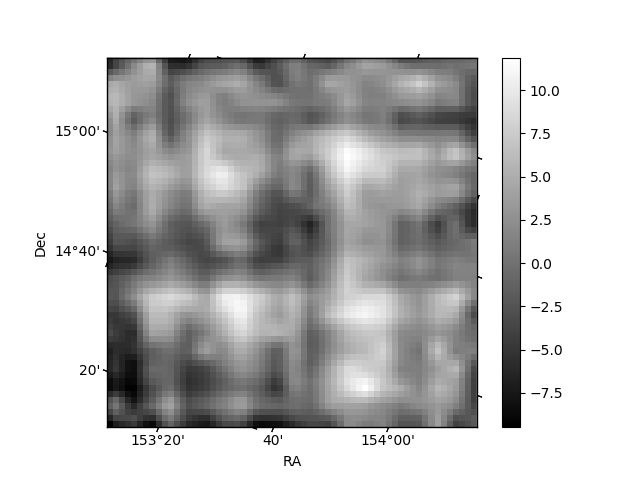 |
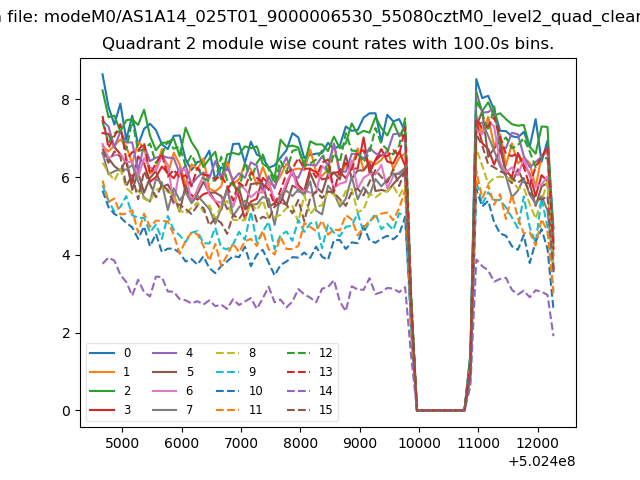
| Module-wise count rates for Quadrant B Data is divided into 100 sec bins |
 |
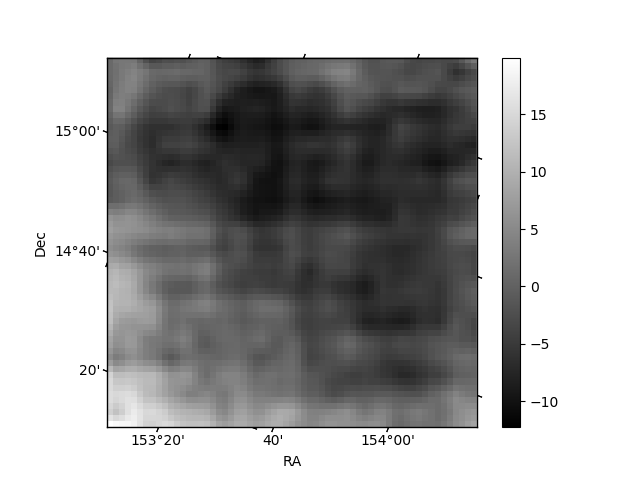 |
| Module-wise count rates for Quadrant C Data is divided into 100 sec bins |
 |
 |
| Module-wise count rates for Quadrant D Data is divided into 100 sec bins |
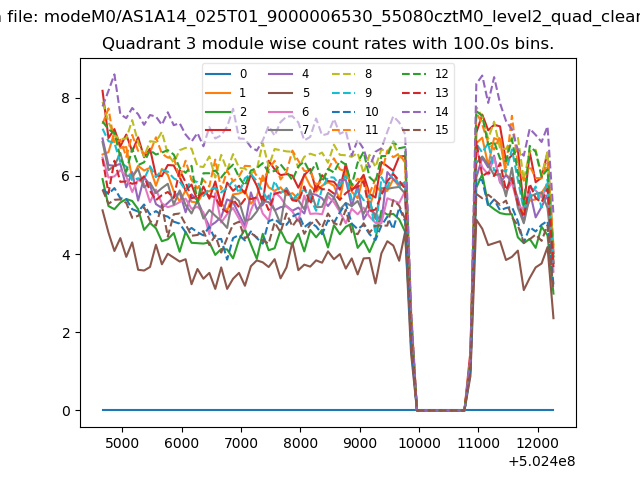 |
 |
| Parameter | Plot |
|---|---|
| CZT HV Monitor | 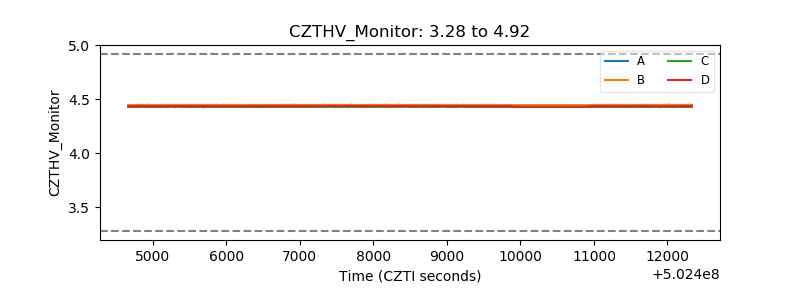 |
| D_VDD | 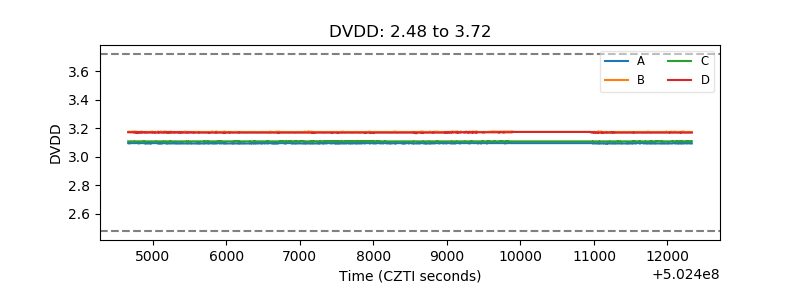 |
| Temperature 1 | 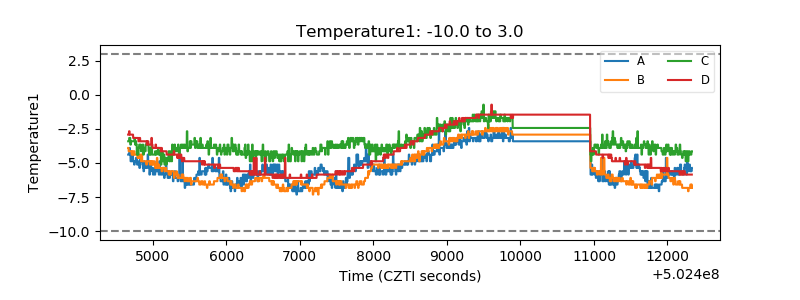 |
| Veto HV Monitor | 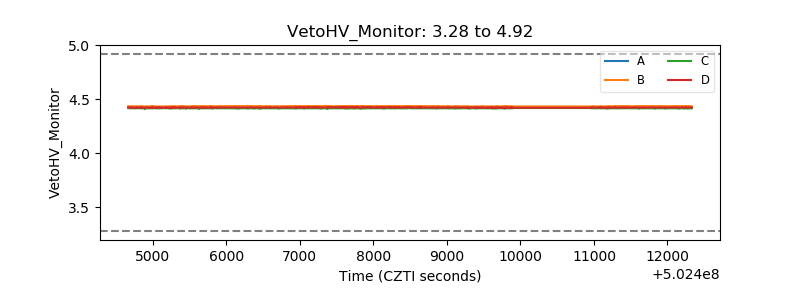 |
| Veto LLD | 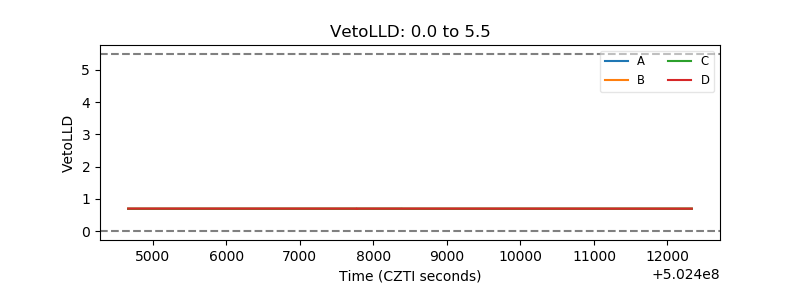 |
| Alpha Counter | 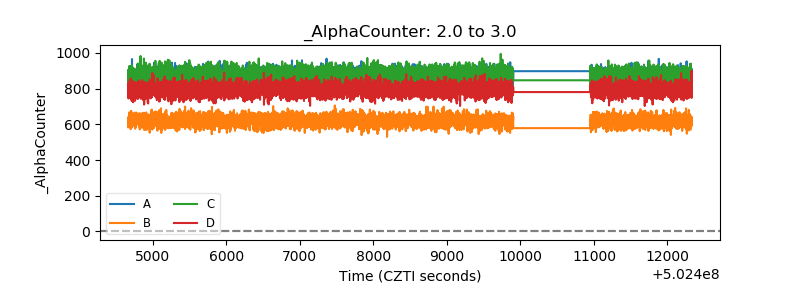 |
| _CPM_Rate | 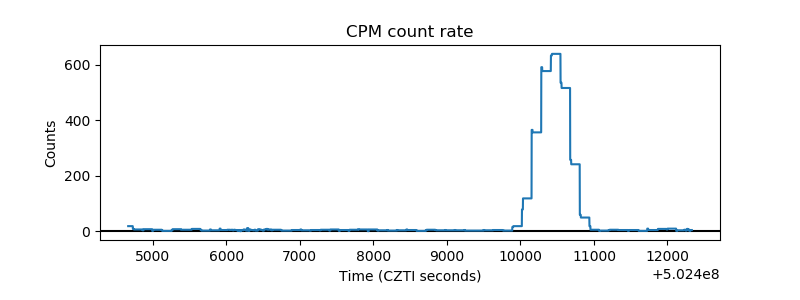 |
| CZT Counter | 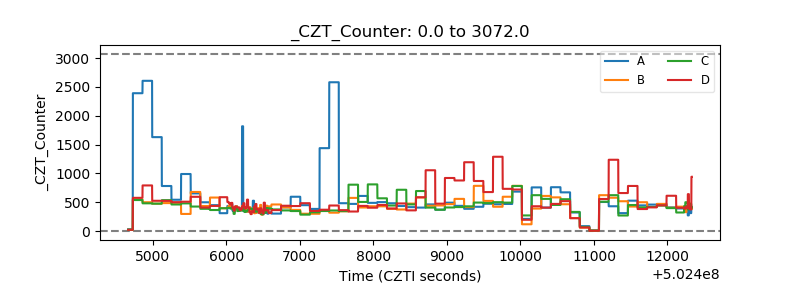 |
| +2.5 Volts monitor |  |
| +5 Volts monitor |  |
| _ROLL_ROT | 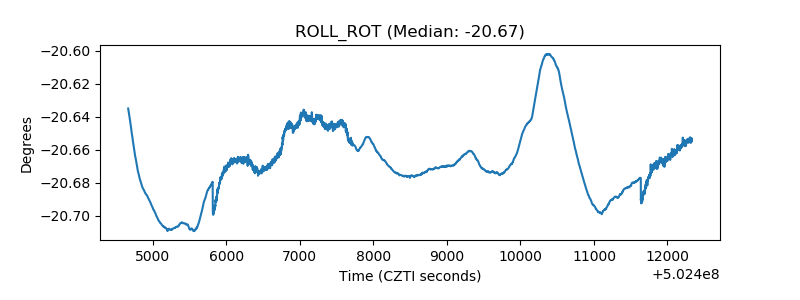 |
| _Roll_DEC | 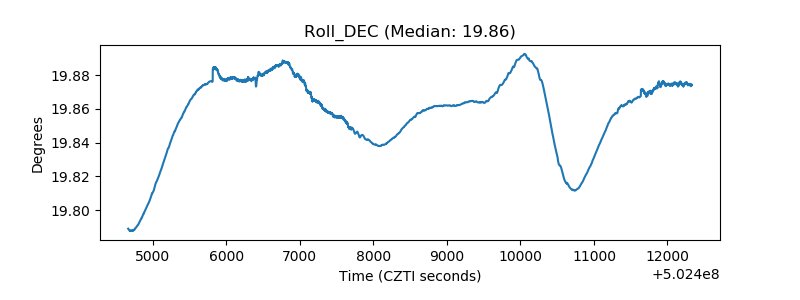 |
| _Roll_RA | 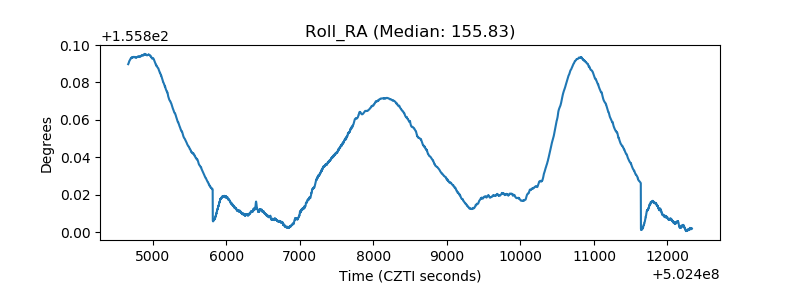 |
| Veto Counter | 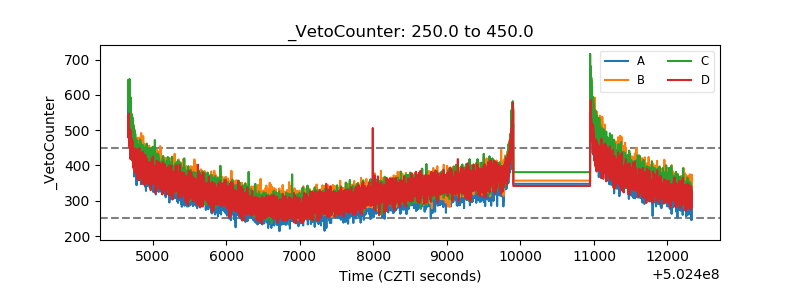 |