| Param | Original file | Final file |
|---|---|---|
| Filename | modeM0/AS1A14_025T01_9000006530_55081cztM0_level2.fits | modeM0/AS1A14_025T01_9000006530_55081cztM0_level2_quad_clean.evt |
| Size (bytes) | 418,826,880 | 107,092,800 |
| Size | 399.4 MB | 102.1 MB |
| Events in quadrant A | 3,159,381 | 708,336 |
| Events in quadrant B | 3,323,656 | 765,043 |
| Events in quadrant C | 3,206,001 | 677,858 |
| Events in quadrant D | 5,253,020 | 589,427 |
| Mode M0 | |||
|---|---|---|---|
| Quadrant | BADHDUFLAG | Total packets | Discarded packets |
| A | 0 | 14860 | 2 |
| B | 0 | 15175 | 2 |
| C | 0 | 15046 | 2 |
| D | 0 | 20827 | 2 |
| Mode SS | |||
|---|---|---|---|
| Quadrant | BADHDUFLAG | Total packets | Discarded packets |
| A | 0 | 148 | 0 |
| B | 0 | 148 | 0 |
| C | 0 | 148 | 0 |
| D | 0 | 148 | 0 |
| Mode M9 | |||
|---|---|---|---|
| Quadrant | BADHDUFLAG | Total packets | Discarded packets |
| A | 0 | 22 | 0 |
| B | 0 | 22 | 0 |
| C | 0 | 22 | 0 |
| D | 0 | 22 | 0 |
| Quadrant | Total seconds | Saturated seconds | Saturation percentage |
|---|---|---|---|
| A | 7213 | 36 | 0.499099% |
| B | 7213 | 92 | 1.275475% |
| C | 7213 | 36 | 0.499099% |
| D | 7214 | 506 | 7.014139% |
Noise dominated data is calculated using 1-second bins in cleaned event files. If a bin has >2000 counts, and if more than 50% of those come from <1% of pixels, then it is considered to be noise-dominated and hence unusable.
| Quadrant | # 1 sec bins | Bins with >0 counts | Bins with >2000 counts | High rate bins dominated by noise | Noise dominated (total time) | Noise dominated (detector-on time) | Marked lightcurve |
|---|---|---|---|---|---|---|---|
| A | 9398 | 7214 | 13 | 13 | 0.14% | 0.18% | 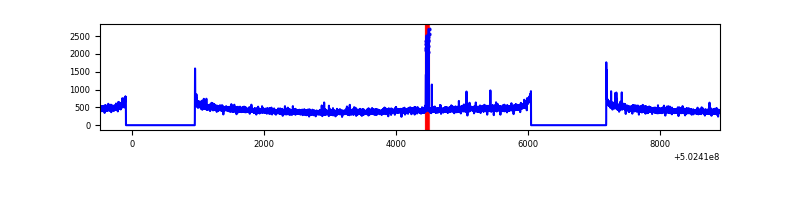 |
| B | 9398 | 7214 | 14 | 14 | 0.15% | 0.19% | 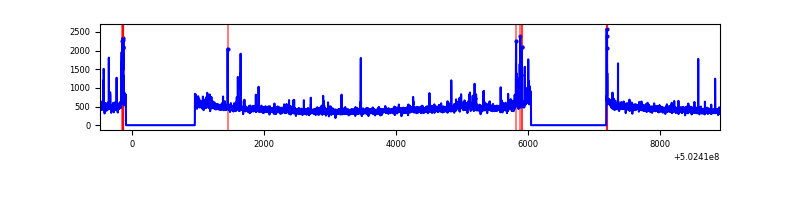 |
| C | 9398 | 7214 | 18 | 18 | 0.19% | 0.25% | 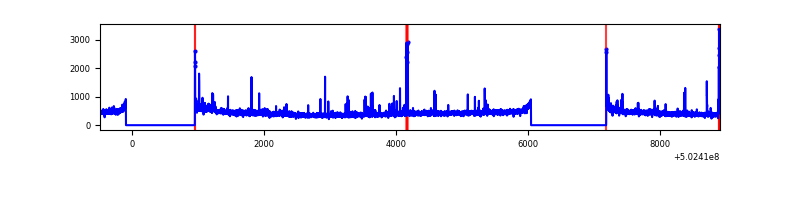 |
| D | 9399 | 7215 | 504 | 504 | 5.36% | 6.99% | 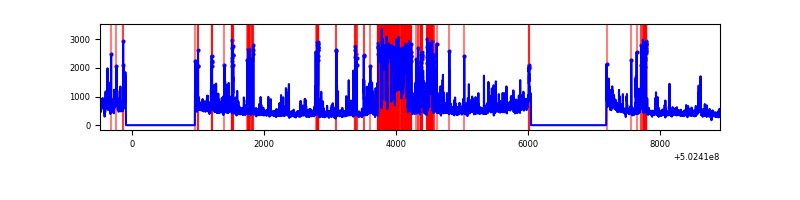 |
Top three noisy pixels from each quadrant. If the there are fewer than three noisy pixels in the level2.evt file, extra rows are filled as -1
| Pixel properties | Quadrant properties | ||||||
|---|---|---|---|---|---|---|---|
| Quadrant | DetID | PixID | Counts | Sigma | Mean | Median | Sigma |
| A | 0 | 8 | 49349 | 247.46 | 792 | 774 | 196.3 |
| A | 13 | 254 | 20184 | 98.88 | 792 | 774 | 196.3 |
| A | 4 | 3 | 15855 | 76.83 | 792 | 774 | 196.3 |
| B | 0 | 182 | 73210 | 426.75 | 785 | 757 | 169.8 |
| B | 10 | 247 | 42990 | 248.75 | 785 | 757 | 169.8 |
| B | 5 | 185 | 41789 | 241.68 | 785 | 757 | 169.8 |
| C | 13 | 3 | 73981 | 348.33 | 770 | 763 | 210.2 |
| C | 9 | 38 | 53143 | 249.2 | 770 | 763 | 210.2 |
| C | 12 | 252 | 29462 | 136.54 | 770 | 763 | 210.2 |
| D | 15 | 94 | 1415519 | 6810.89 | 733 | 701 | 207.7 |
| D | 2 | 249 | 160598 | 769.74 | 733 | 701 | 207.7 |
| D | 3 | 176 | 115528 | 552.77 | 733 | 701 | 207.7 |
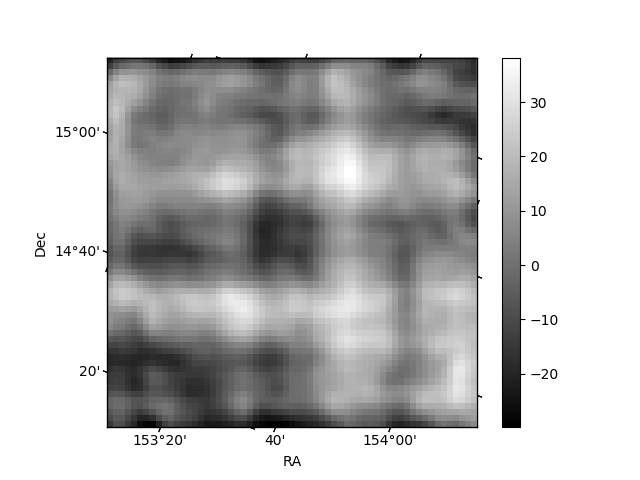
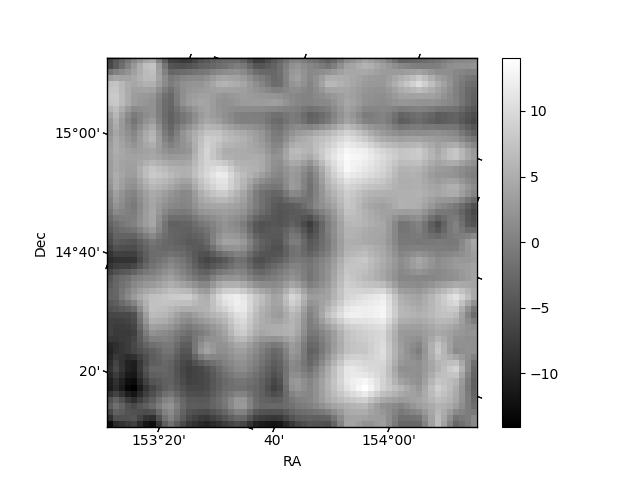
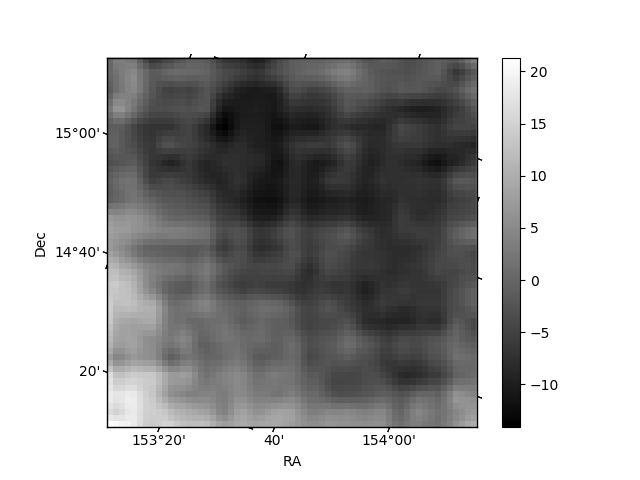
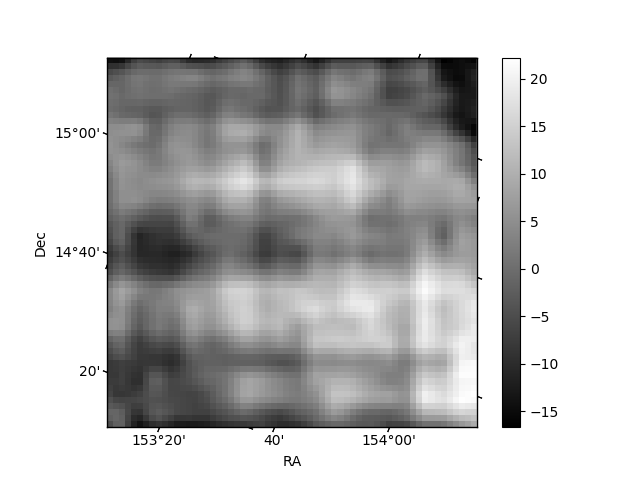
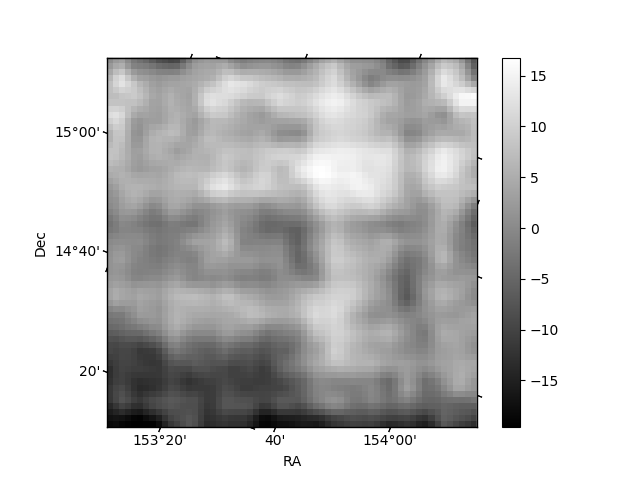
Histogram calculated using DETX and DETY for each event in the final _common_clean file
| Quadrant A | 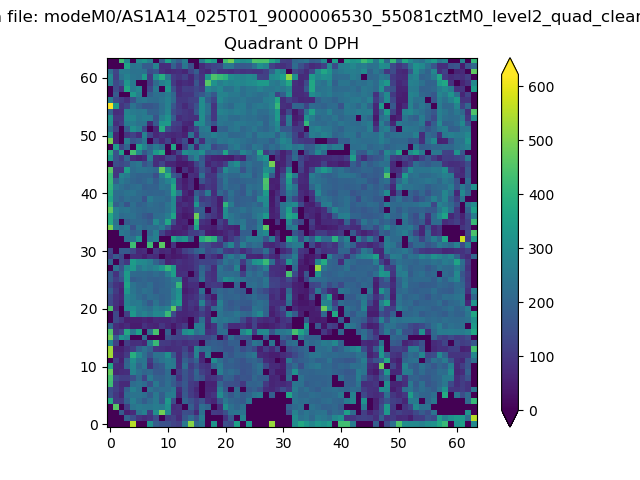 |
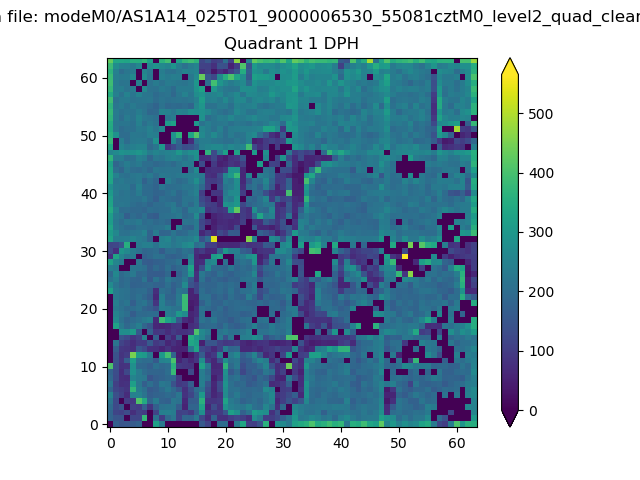 |
Quadrant B |
|---|---|---|---|
| Quadrant D | 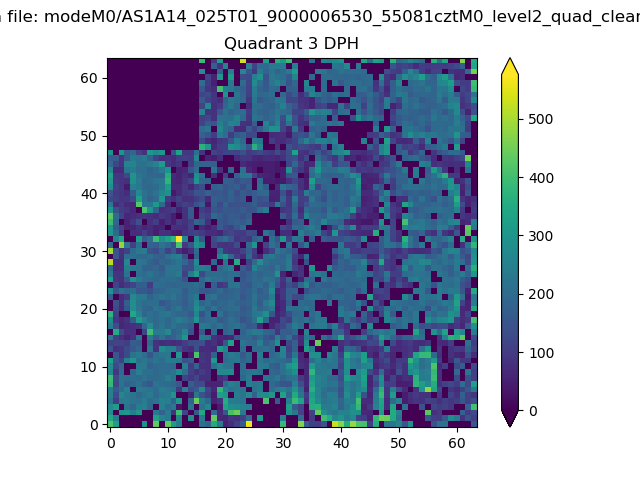 |
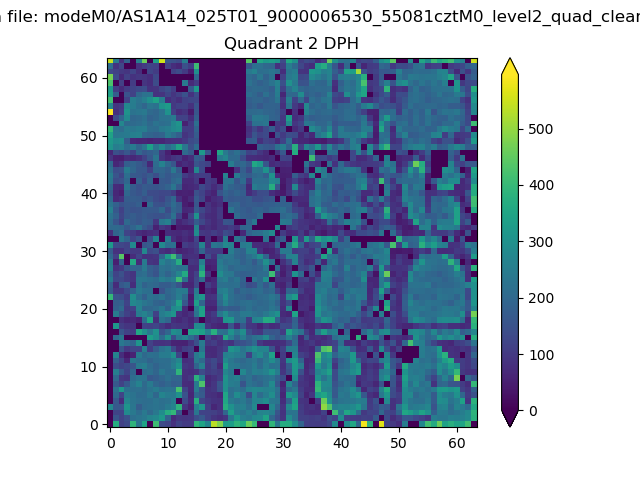 |
Quadrant C |
| Plot type | Count rate plots | Images |
|---|---|---|
| Comparison with Poisson distribution Blue bars denote a histogram of data divided into 1 sec bins. Red curve is a Poisson curve with rate = median count rate of data. |
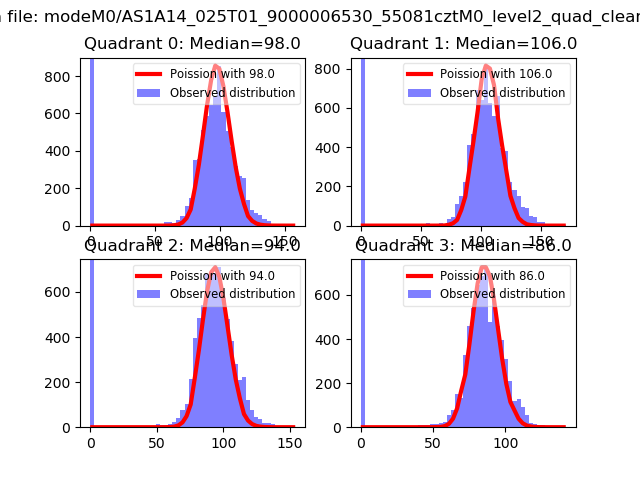 |
 |
| Quadrant-wise count rates Data is divided into 100 sec bins |
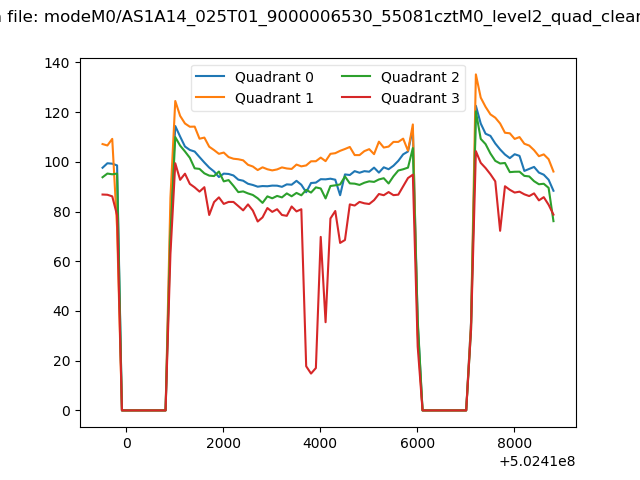 |
|
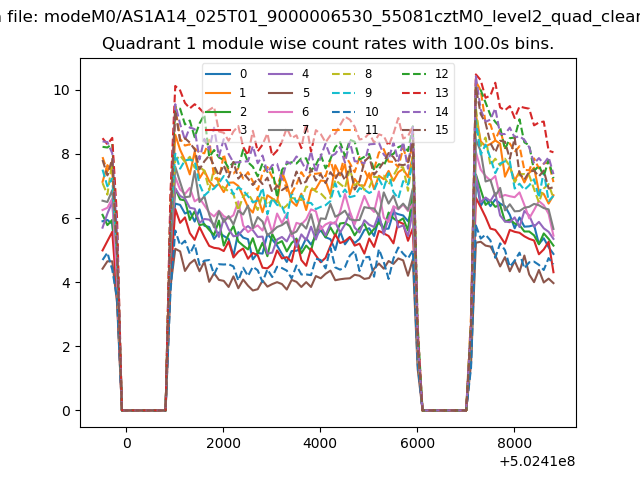
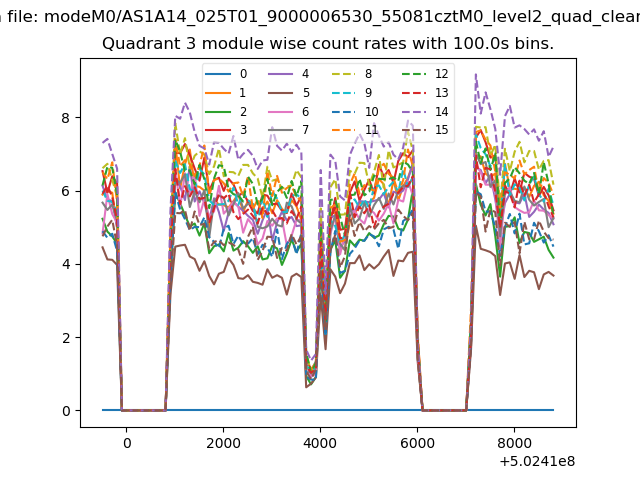
| Module-wise count rates for Quadrant A Data is divided into 100 sec bins |
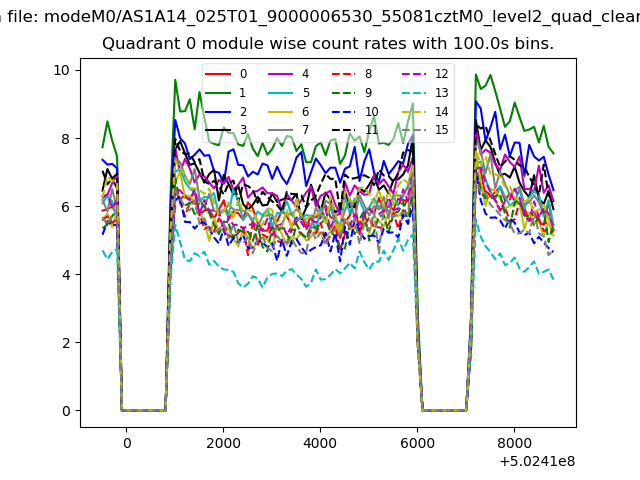 |
 |
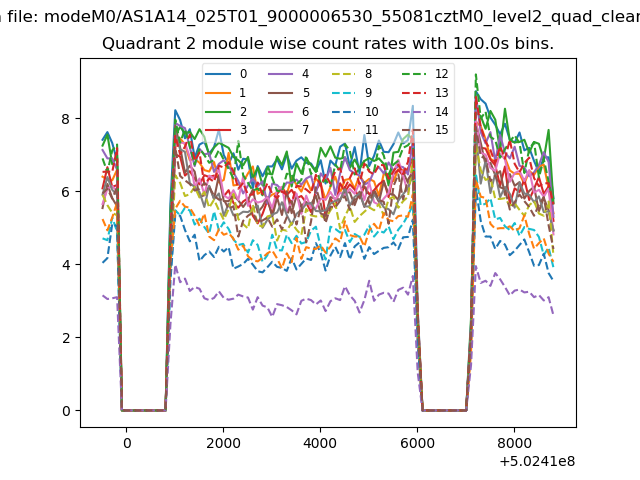
| Module-wise count rates for Quadrant B Data is divided into 100 sec bins |
 |
 |
| Module-wise count rates for Quadrant C Data is divided into 100 sec bins |
 |
 |
| Module-wise count rates for Quadrant D Data is divided into 100 sec bins |
 |
 |
| Parameter | Plot |
|---|---|
| CZT HV Monitor | 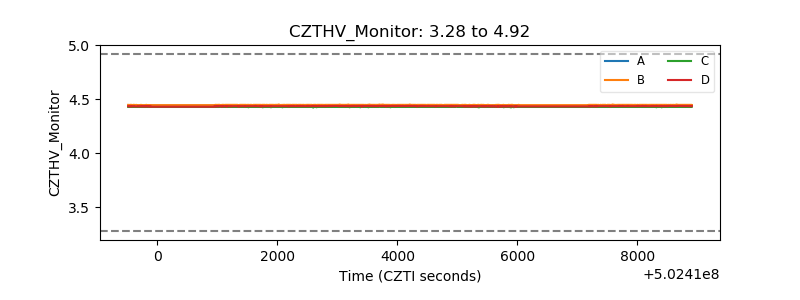 |
| D_VDD | 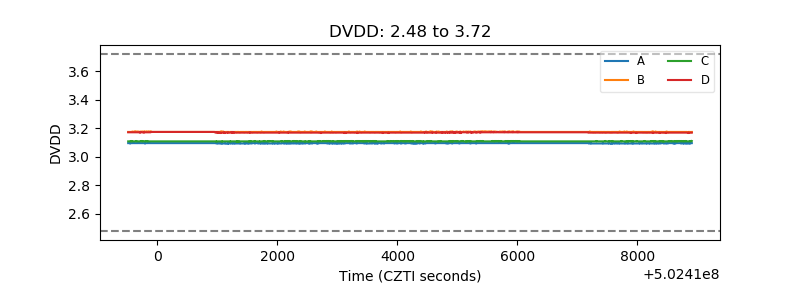 |
| Temperature 1 | 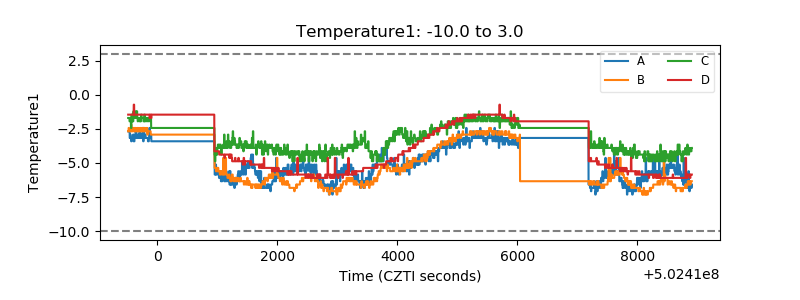 |
| Veto HV Monitor | 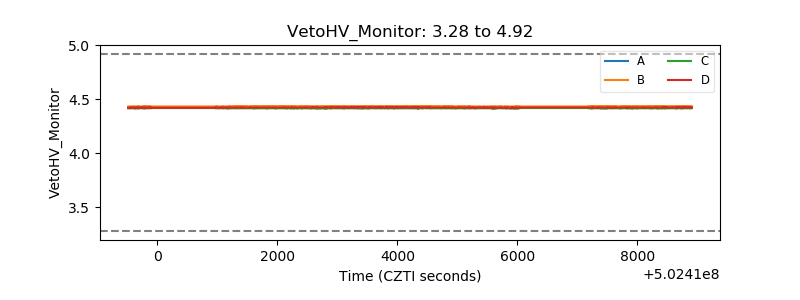 |
| Veto LLD | 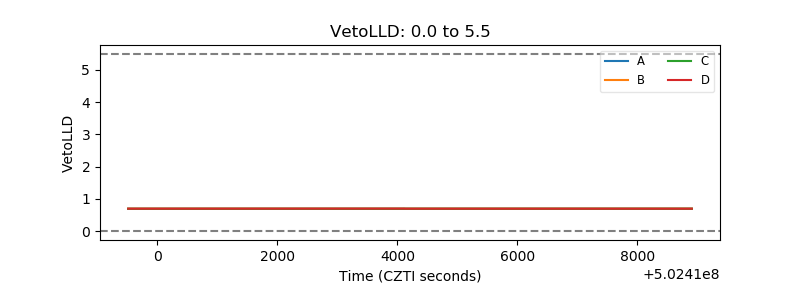 |
| Alpha Counter | 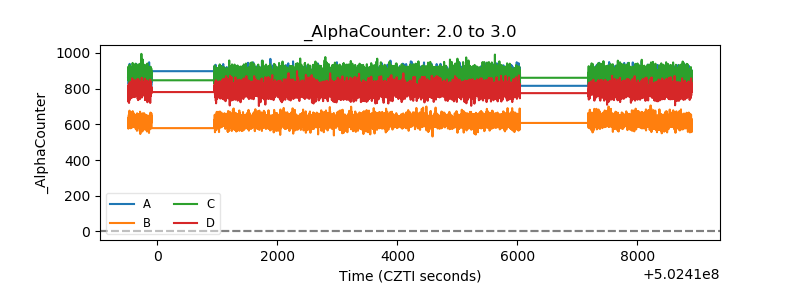 |
| _CPM_Rate | 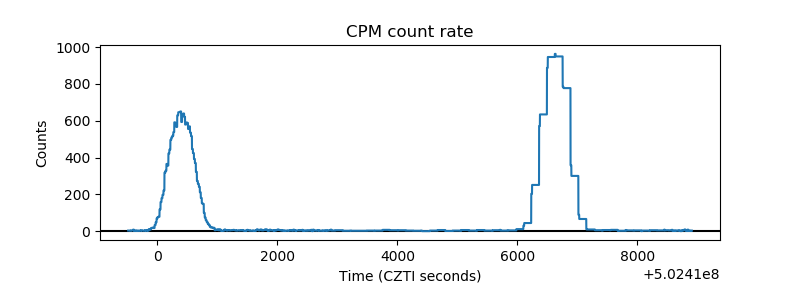 |
| CZT Counter | 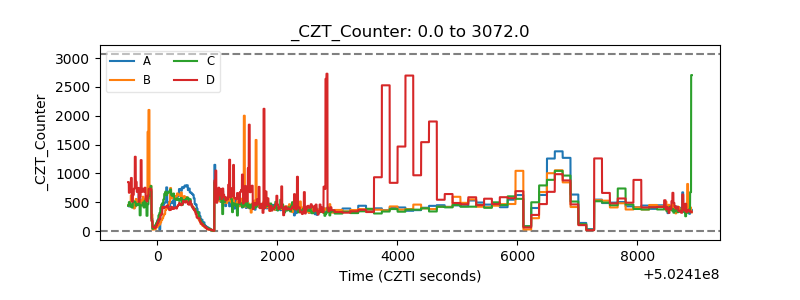 |
| +2.5 Volts monitor |  |
| +5 Volts monitor |  |
| _ROLL_ROT | 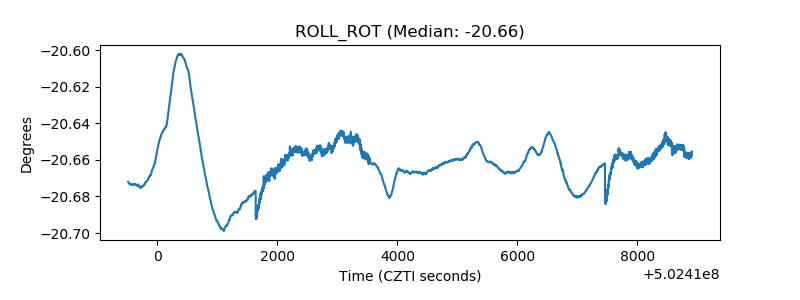 |
| _Roll_DEC | 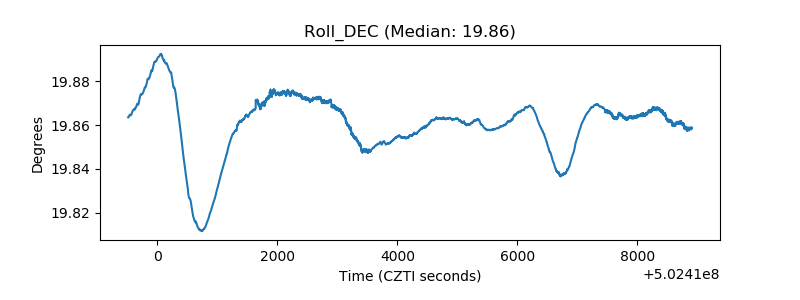 |
| _Roll_RA | 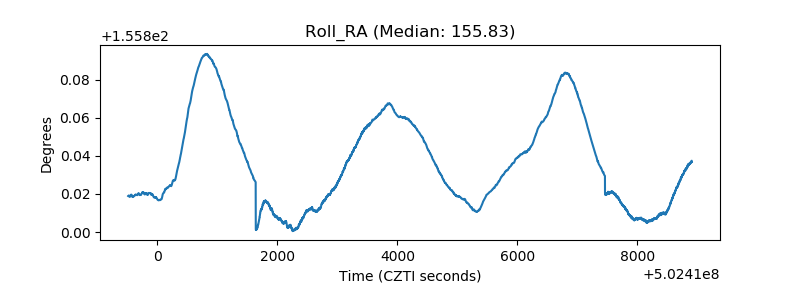 |
| Veto Counter | 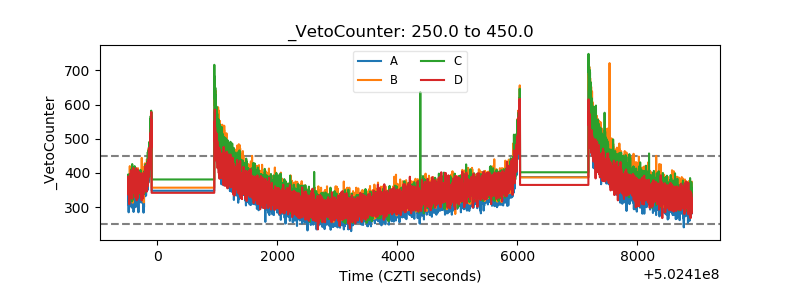 |