| Param | Original file | Final file |
|---|---|---|
| Filename | modeM0/AS1A14_025T01_9000006530_55082cztM0_level2.fits | modeM0/AS1A14_025T01_9000006530_55082cztM0_level2_quad_clean.evt |
| Size (bytes) | 410,878,080 | 102,366,720 |
| Size | 391.8 MB | 97.6 MB |
| Events in quadrant A | 2,989,414 | 680,909 |
| Events in quadrant B | 3,099,539 | 744,797 |
| Events in quadrant C | 3,174,481 | 648,410 |
| Events in quadrant D | 5,417,179 | 552,699 |
| Mode M0 | |||
|---|---|---|---|
| Quadrant | BADHDUFLAG | Total packets | Discarded packets |
| A | 0 | 17170 | 3216 |
| B | 0 | 15767 | 1644 |
| C | 0 | 16261 | 1653 |
| D | 0 | 23328 | 2364 |
| Mode SS | |||
|---|---|---|---|
| Quadrant | BADHDUFLAG | Total packets | Discarded packets |
| A | 0 | 154 | 18 |
| B | 0 | 154 | 18 |
| C | 0 | 153 | 15 |
| D | 0 | 154 | 18 |
| Mode M9 | |||
|---|---|---|---|
| Quadrant | BADHDUFLAG | Total packets | Discarded packets |
| A | 0 | 21 | 0 |
| B | 0 | 21 | 0 |
| C | 0 | 21 | 0 |
| D | 0 | 22 | 0 |
| Quadrant | Total seconds | Saturated seconds | Saturation percentage |
|---|---|---|---|
| A | 6771 | 34 | 0.502141% |
| B | 6796 | 68 | 1.000589% |
| C | 6799 | 78 | 1.147228% |
| D | 6795 | 642 | 9.448124% |
Noise dominated data is calculated using 1-second bins in cleaned event files. If a bin has >2000 counts, and if more than 50% of those come from <1% of pixels, then it is considered to be noise-dominated and hence unusable.
| Quadrant | # 1 sec bins | Bins with >0 counts | Bins with >2000 counts | High rate bins dominated by noise | Noise dominated (total time) | Noise dominated (detector-on time) | Marked lightcurve |
|---|---|---|---|---|---|---|---|
| A | 41994 | 6793 | 4 | 4 | 0.01% | 0.06% | 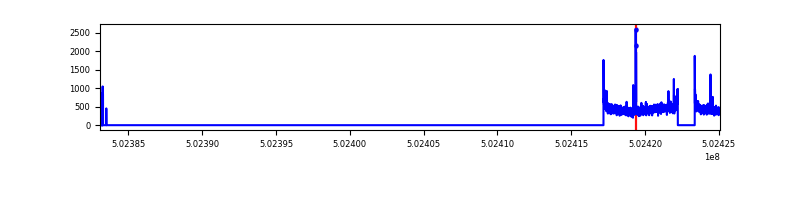 |
| B | 41912 | 6832 | 9 | 9 | 0.02% | 0.13% | 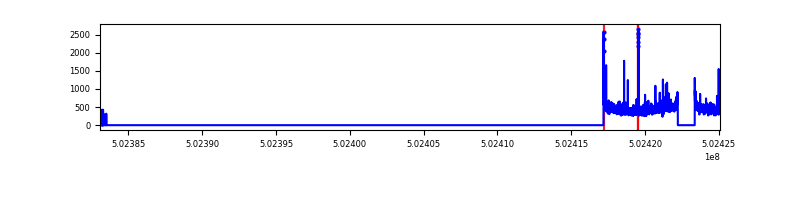 |
| C | 41975 | 6837 | 57 | 57 | 0.14% | 0.83% | 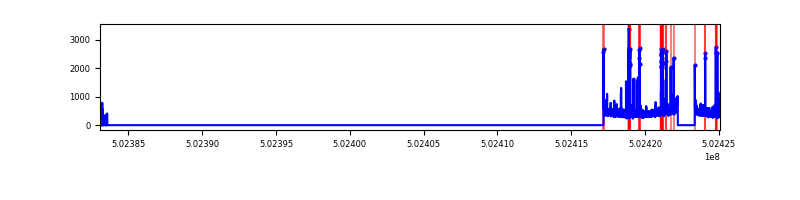 |
| D | 41948 | 6827 | 620 | 620 | 1.48% | 9.08% | 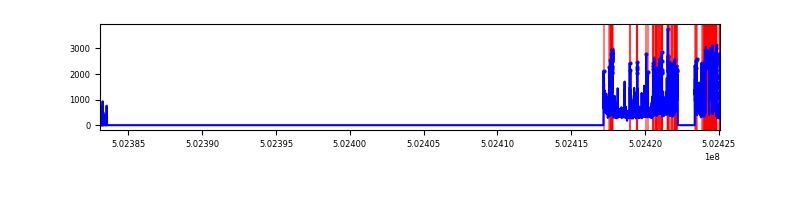 |
Top three noisy pixels from each quadrant. If the there are fewer than three noisy pixels in the level2.evt file, extra rows are filled as -1
| Pixel properties | Quadrant properties | ||||||
|---|---|---|---|---|---|---|---|
| Quadrant | DetID | PixID | Counts | Sigma | Mean | Median | Sigma |
| A | 8 | 10 | 34550 | 181.84 | 747 | 727 | 186.0 |
| A | 13 | 254 | 20274 | 105.09 | 747 | 727 | 186.0 |
| A | 4 | 3 | 18758 | 96.94 | 747 | 727 | 186.0 |
| B | 10 | 247 | 52650 | 322.1 | 748 | 721 | 161.2 |
| B | 5 | 185 | 30016 | 181.71 | 748 | 721 | 161.2 |
| B | 0 | 216 | 26115 | 157.51 | 748 | 721 | 161.2 |
| C | 14 | 254 | 104897 | 519.28 | 729 | 723 | 200.6 |
| C | 13 | 3 | 87644 | 433.28 | 729 | 723 | 200.6 |
| C | 6 | 223 | 65658 | 323.69 | 729 | 723 | 200.6 |
| D | 15 | 94 | 1621389 | 8328.49 | 686 | 656 | 194.6 |
| D | 11 | 129 | 290840 | 1491.17 | 686 | 656 | 194.6 |
| D | 2 | 249 | 225191 | 1153.82 | 686 | 656 | 194.6 |
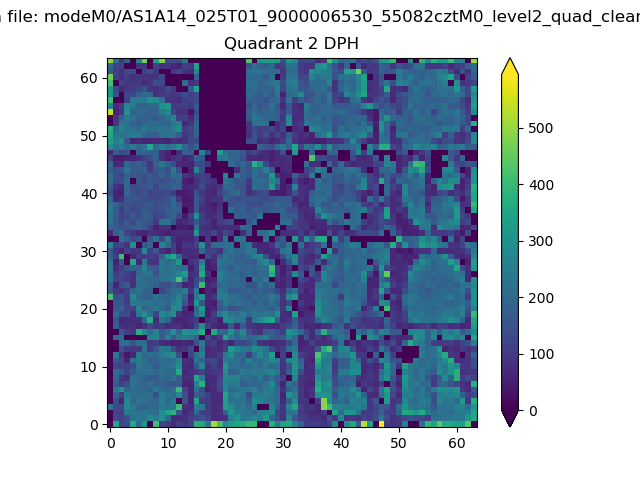
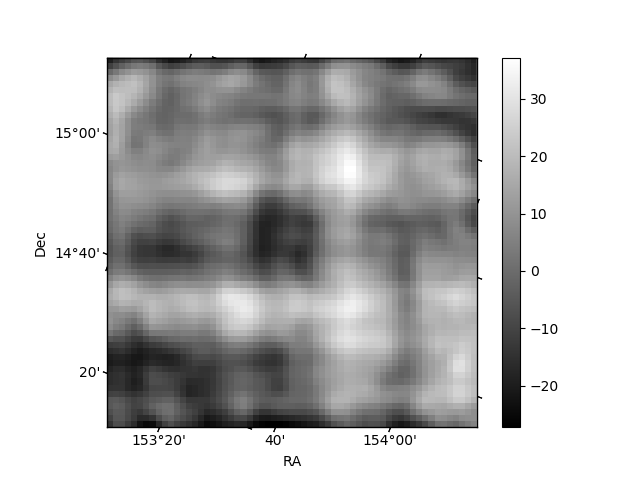
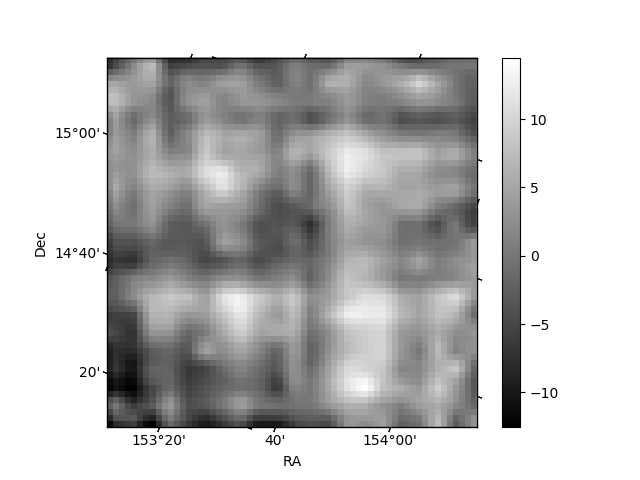
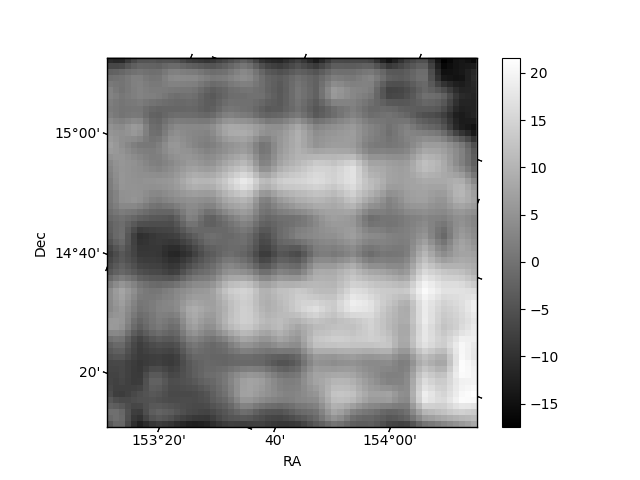
Histogram calculated using DETX and DETY for each event in the final _common_clean file
| Quadrant A | 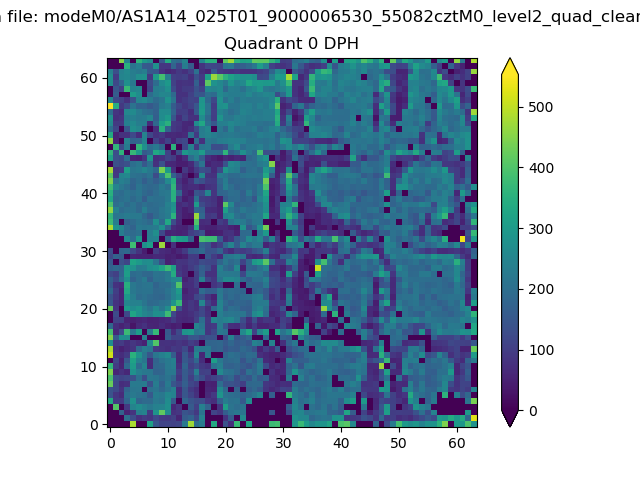 |
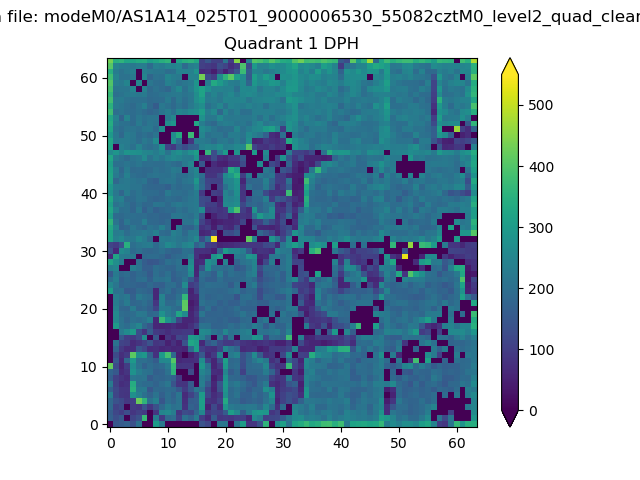 |
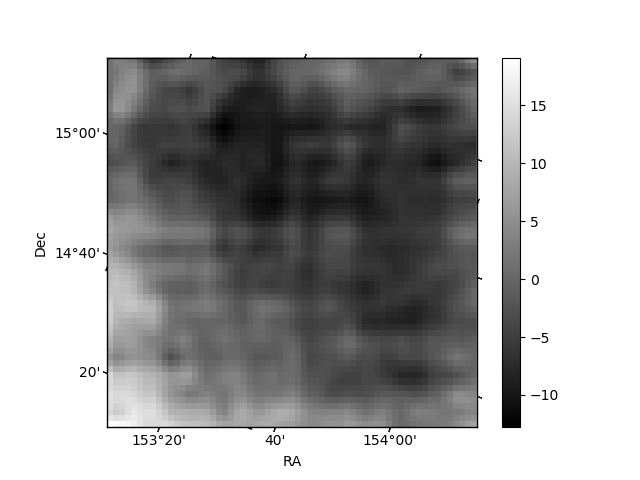
Quadrant B |
|---|---|---|---|
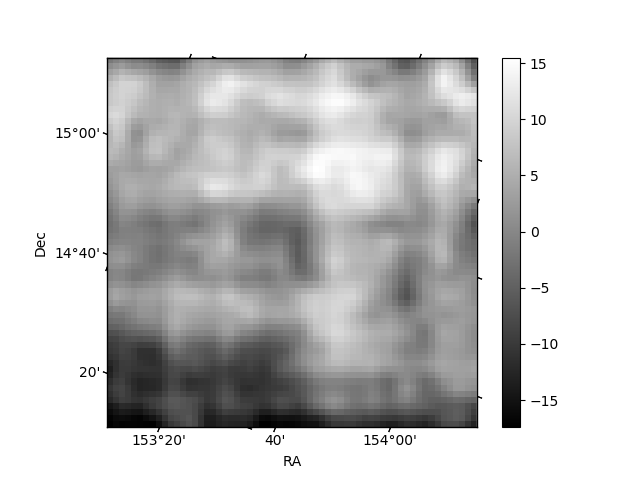
| Quadrant D | 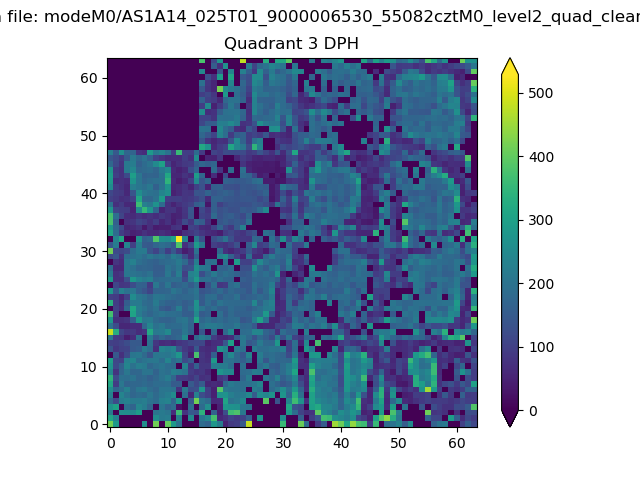 |
 |
Quadrant C |
| Plot type | Count rate plots | Images |
|---|---|---|
| Comparison with Poisson distribution Blue bars denote a histogram of data divided into 1 sec bins. Red curve is a Poisson curve with rate = median count rate of data. |
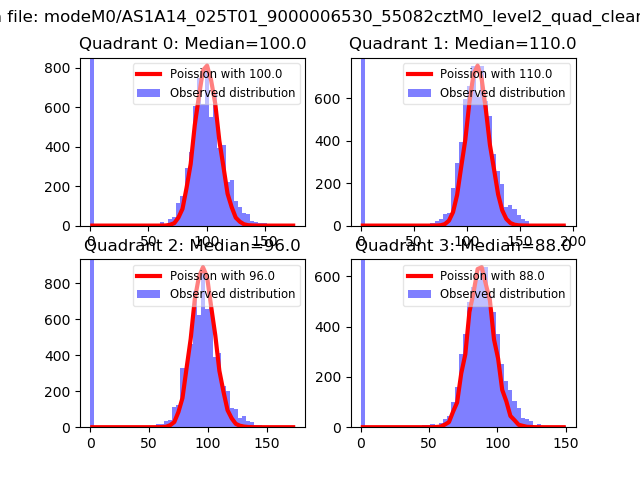 |
 |
| Quadrant-wise count rates Data is divided into 100 sec bins |
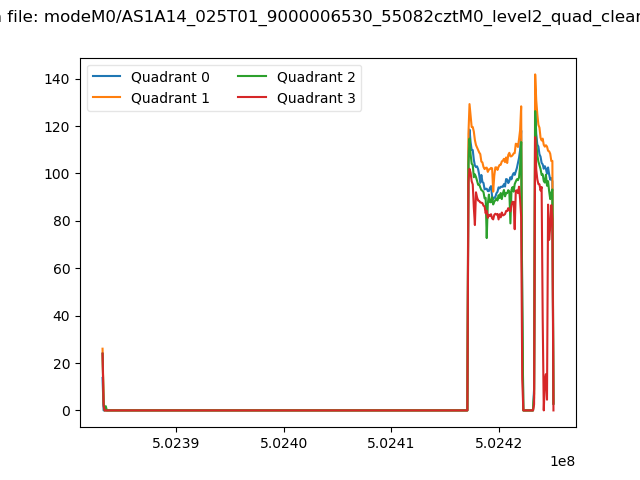 |
|
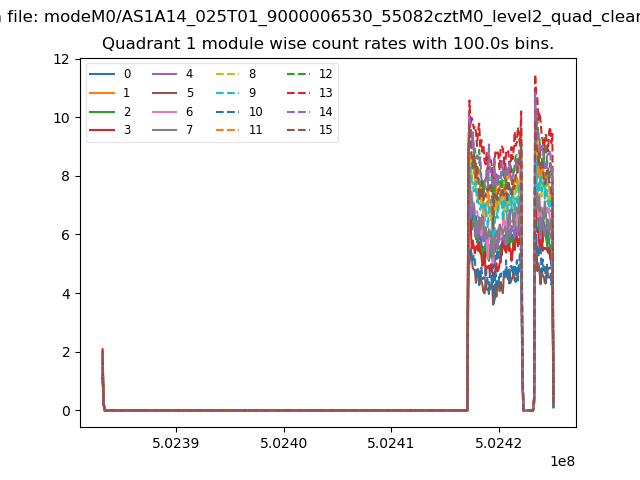
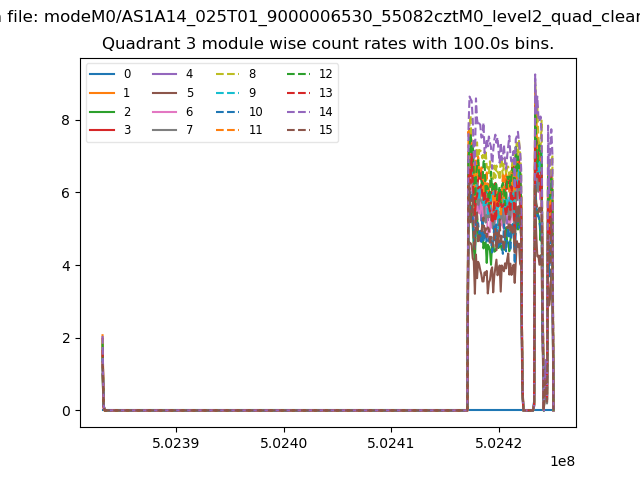
| Module-wise count rates for Quadrant A Data is divided into 100 sec bins |
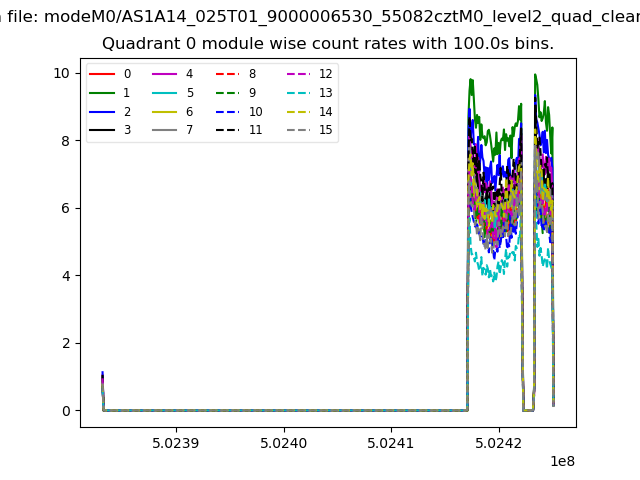 |
 |
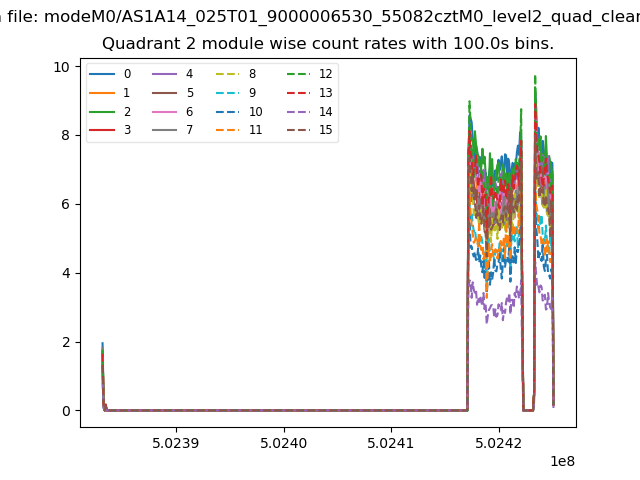
| Module-wise count rates for Quadrant B Data is divided into 100 sec bins |
 |
 |
| Module-wise count rates for Quadrant C Data is divided into 100 sec bins |
 |
 |
| Module-wise count rates for Quadrant D Data is divided into 100 sec bins |
 |
 |
| Parameter | Plot |
|---|---|
| CZT HV Monitor | 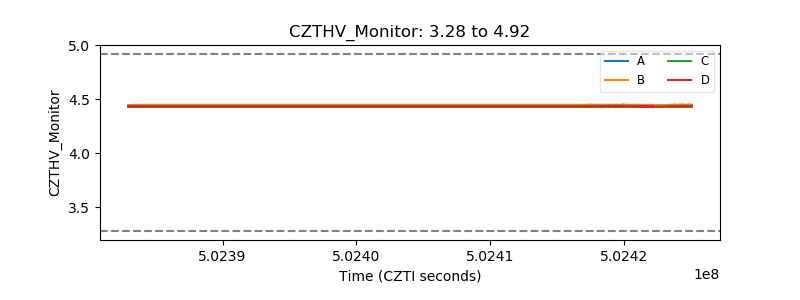 |
| D_VDD | 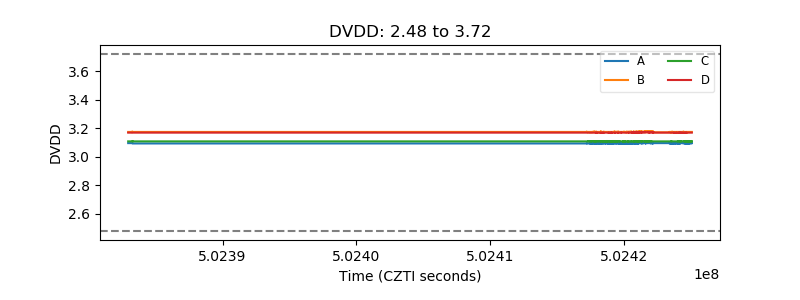 |
| Temperature 1 | 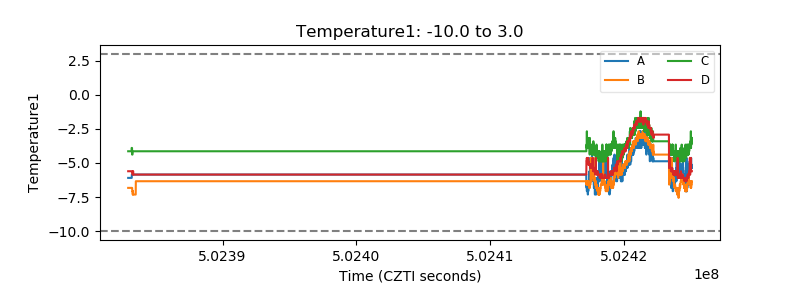 |
| Veto HV Monitor | 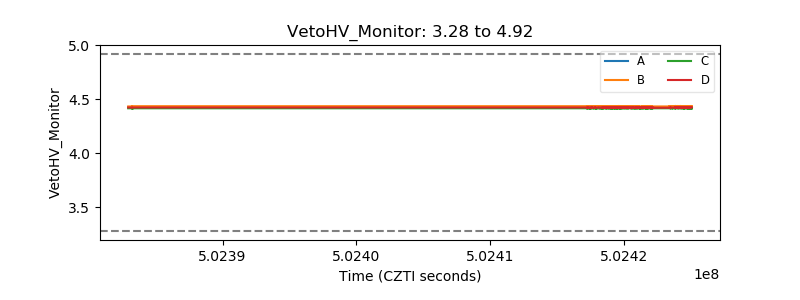 |
| Veto LLD | 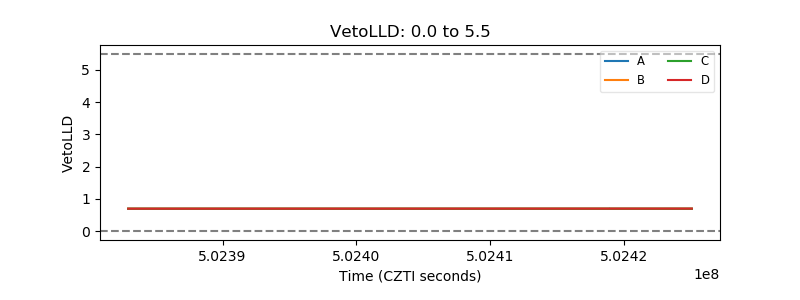 |
| Alpha Counter | 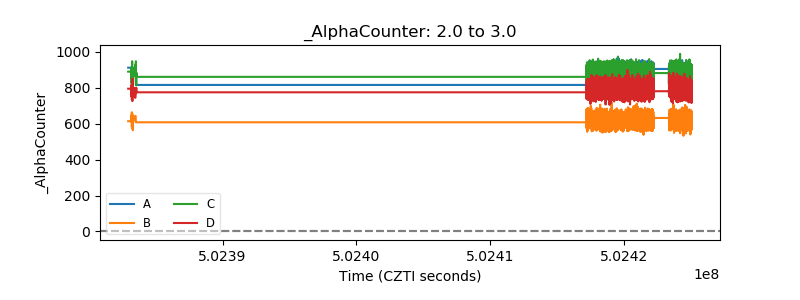 |
| _CPM_Rate | 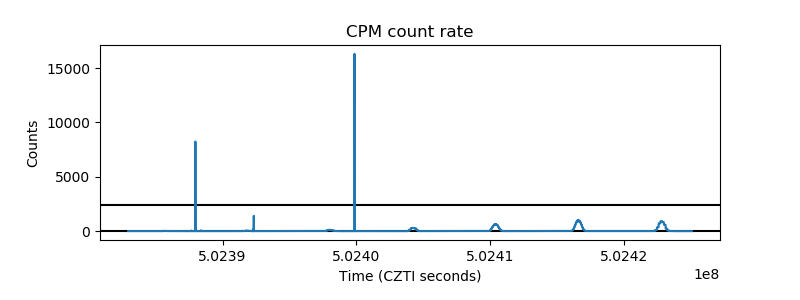 |
| CZT Counter | 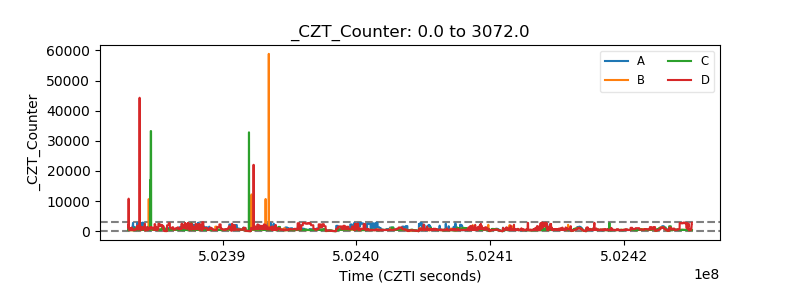 |
| +2.5 Volts monitor |  |
| +5 Volts monitor |  |
| _ROLL_ROT | 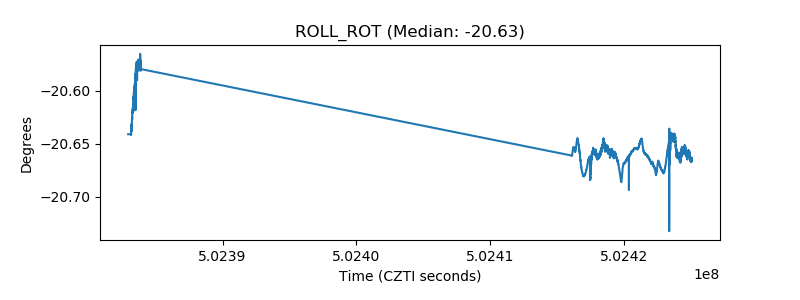 |
| _Roll_DEC | 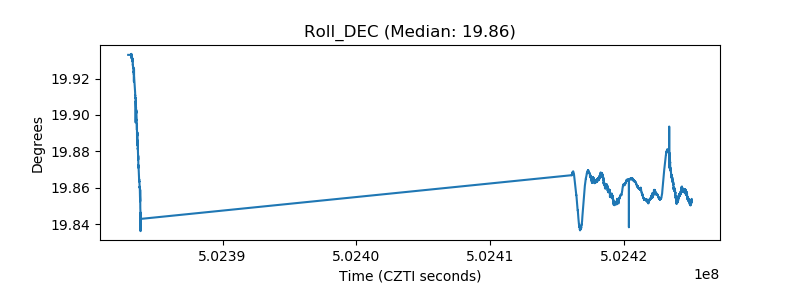 |
| _Roll_RA | 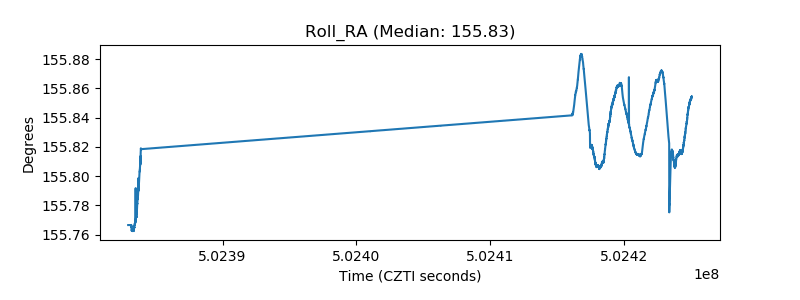 |
| Veto Counter | 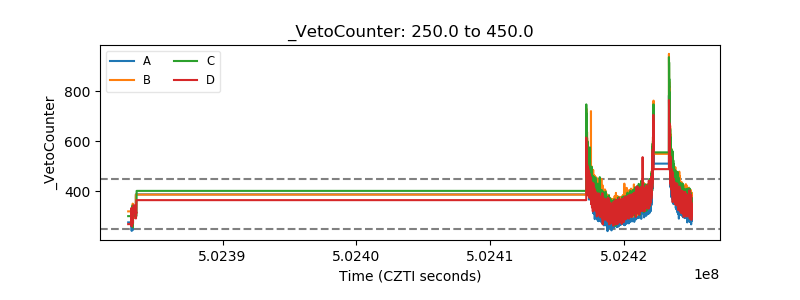 |