| Param | Original file | Final file |
|---|---|---|
| Filename | modeM0/AS1A14_025T01_9000006530_55083cztM0_level2.fits | modeM0/AS1A14_025T01_9000006530_55083cztM0_level2_quad_clean.evt |
| Size (bytes) | 2,915,795,520 | 609,376,320 |
| Size | 2.7 GB | 581.1 MB |
| Events in quadrant A | 29,981,674 | 3,881,766 |
| Events in quadrant B | 19,719,993 | 4,406,310 |
| Events in quadrant C | 19,699,446 | 3,893,074 |
| Events in quadrant D | 35,243,345 | 3,348,181 |
| Mode M0 | |||
|---|---|---|---|
| Quadrant | BADHDUFLAG | Total packets | Discarded packets |
| A | 0 | 119727 | 14 |
| B | 0 | 89875 | 8 |
| C | 0 | 90928 | 11 |
| D | 0 | 135258 | 10 |
| Mode SS | |||
|---|---|---|---|
| Quadrant | BADHDUFLAG | Total packets | Discarded packets |
| A | 0 | 870 | 0 |
| B | 0 | 870 | 0 |
| C | 0 | 870 | 0 |
| D | 0 | 870 | 0 |
| Mode M9 | |||
|---|---|---|---|
| Quadrant | BADHDUFLAG | Total packets | Discarded packets |
| A | 0 | 65 | 0 |
| B | 0 | 65 | 0 |
| C | 0 | 65 | 0 |
| D | 0 | 65 | 0 |
| Quadrant | Total seconds | Saturated seconds | Saturation percentage |
|---|---|---|---|
| A | 42538 | 2967 | 6.974940% |
| B | 42539 | 620 | 1.457486% |
| C | 42539 | 434 | 1.020240% |
| D | 42539 | 4296 | 10.098968% |
Noise dominated data is calculated using 1-second bins in cleaned event files. If a bin has >2000 counts, and if more than 50% of those come from <1% of pixels, then it is considered to be noise-dominated and hence unusable.
| Quadrant | # 1 sec bins | Bins with >0 counts | Bins with >2000 counts | High rate bins dominated by noise | Noise dominated (total time) | Noise dominated (detector-on time) | Marked lightcurve |
|---|---|---|---|---|---|---|---|
| A | 49204 | 42543 | 2367 | 2367 | 4.81% | 5.56% | 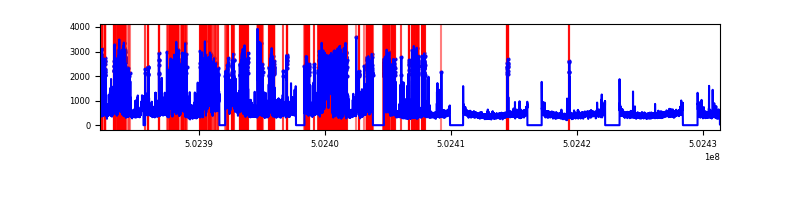 |
| B | 49205 | 42542 | 94 | 94 | 0.19% | 0.22% | 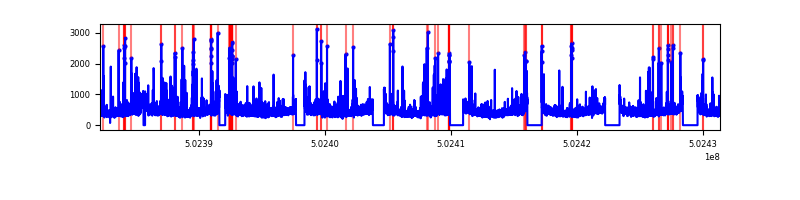 |
| C | 49205 | 42543 | 189 | 189 | 0.38% | 0.44% | 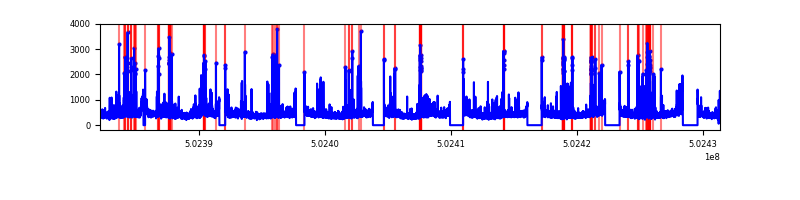 |
| D | 49205 | 42543 | 3894 | 3894 | 7.91% | 9.15% | 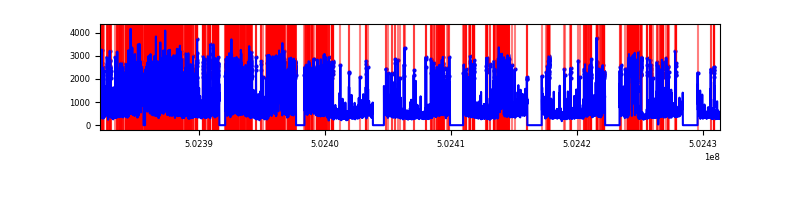 |
Top three noisy pixels from each quadrant. If the there are fewer than three noisy pixels in the level2.evt file, extra rows are filled as -1
| Pixel properties | Quadrant properties | ||||||
|---|---|---|---|---|---|---|---|
| Quadrant | DetID | PixID | Counts | Sigma | Mean | Median | Sigma |
| A | 15 | 32 | 11173131 | 10184.11 | 4503 | 4395 | 1096.7 |
| A | 0 | 8 | 666585 | 603.81 | 4503 | 4395 | 1096.7 |
| A | 4 | 78 | 238688 | 213.64 | 4503 | 4395 | 1096.7 |
| B | 5 | 185 | 572150 | 572.11 | 4587 | 4393 | 992.4 |
| B | 10 | 247 | 269759 | 267.4 | 4587 | 4393 | 992.4 |
| B | 10 | 245 | 224384 | 221.68 | 4587 | 4393 | 992.4 |
| C | 9 | 38 | 504220 | 407.13 | 4515 | 4481 | 1227.5 |
| C | 13 | 3 | 459804 | 370.95 | 4515 | 4481 | 1227.5 |
| C | 12 | 252 | 359717 | 289.41 | 4515 | 4481 | 1227.5 |
| D | 11 | 129 | 6484494 | 5358.26 | 4286 | 4097 | 1209.4 |
| D | 15 | 94 | 6076615 | 5021.01 | 4286 | 4097 | 1209.4 |
| D | 2 | 249 | 1899470 | 1567.17 | 4286 | 4097 | 1209.4 |
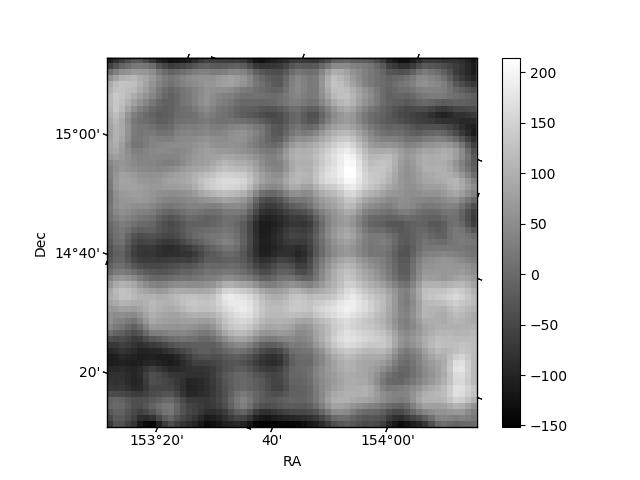
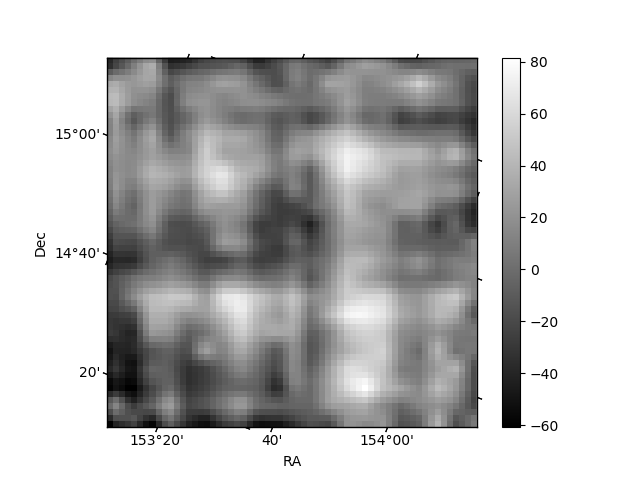
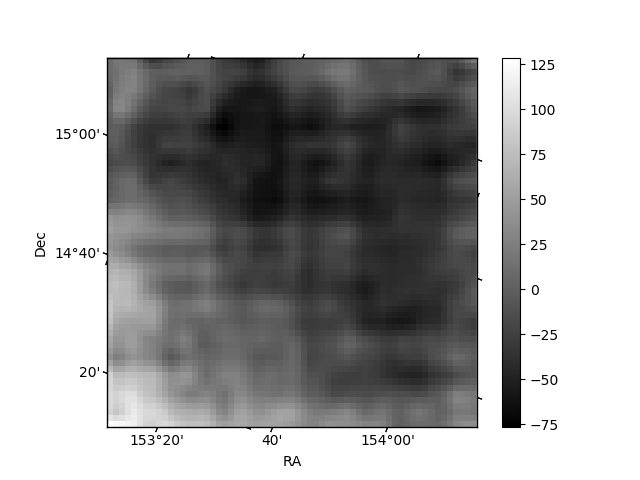
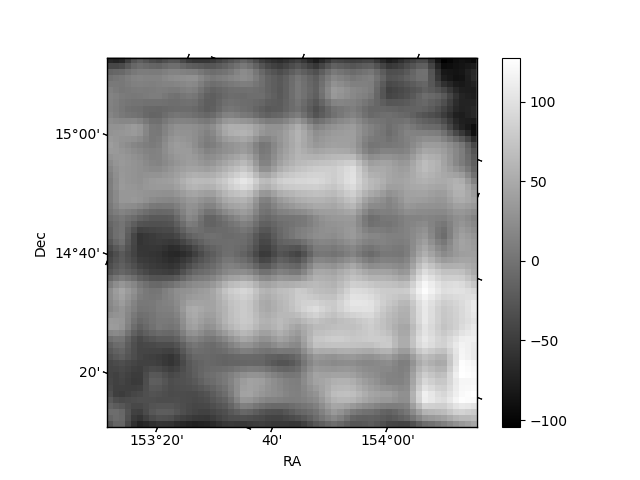
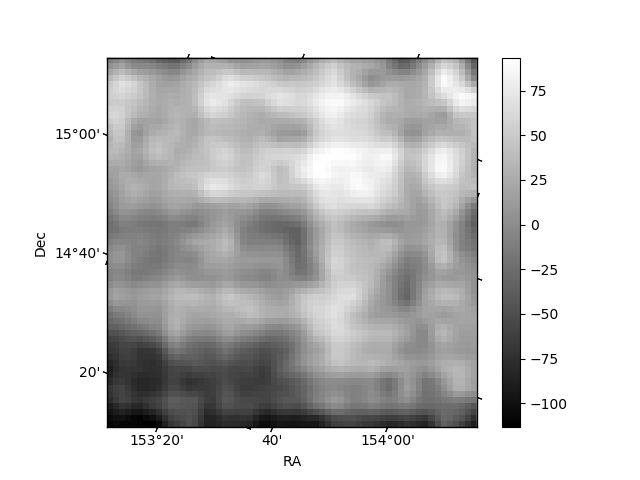
Histogram calculated using DETX and DETY for each event in the final _common_clean file
| Quadrant A | 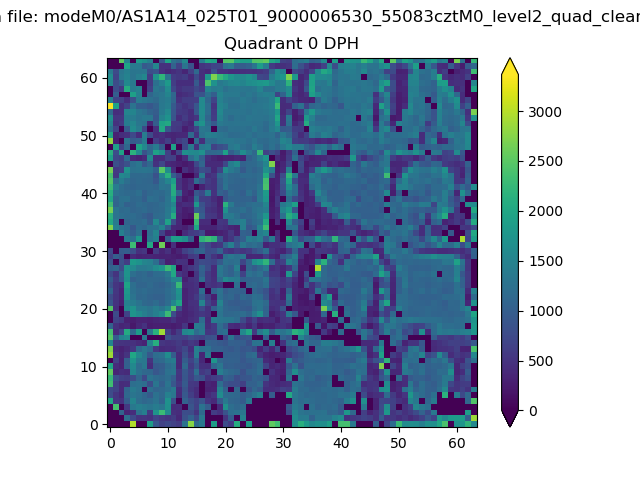 |
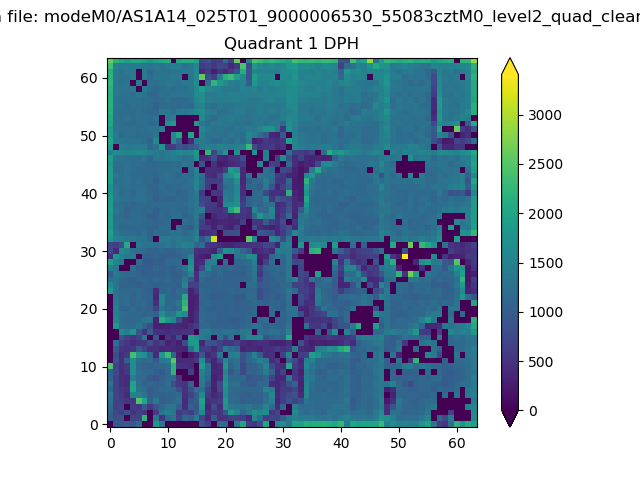 |
Quadrant B |
|---|---|---|---|
| Quadrant D |  |
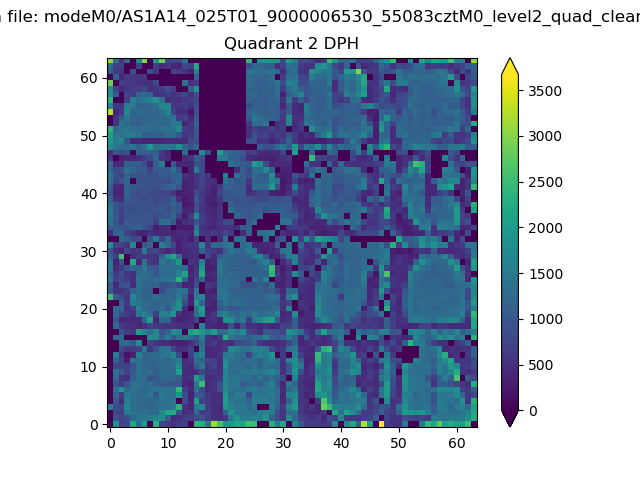 |
Quadrant C |
| Plot type | Count rate plots | Images |
|---|---|---|
| Comparison with Poisson distribution Blue bars denote a histogram of data divided into 1 sec bins. Red curve is a Poisson curve with rate = median count rate of data. |
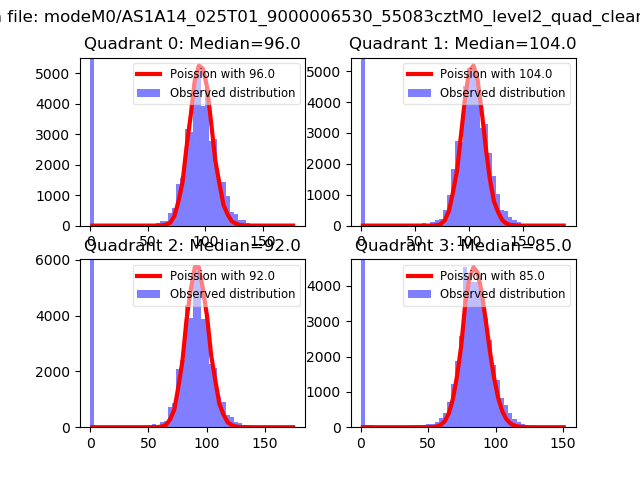 |
 |
| Quadrant-wise count rates Data is divided into 100 sec bins |
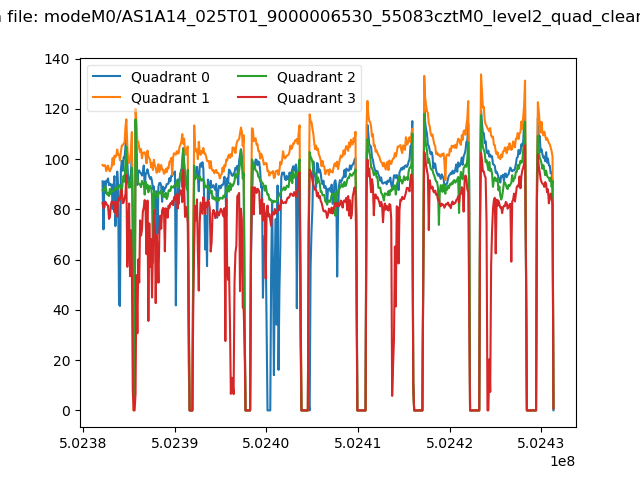 |
|
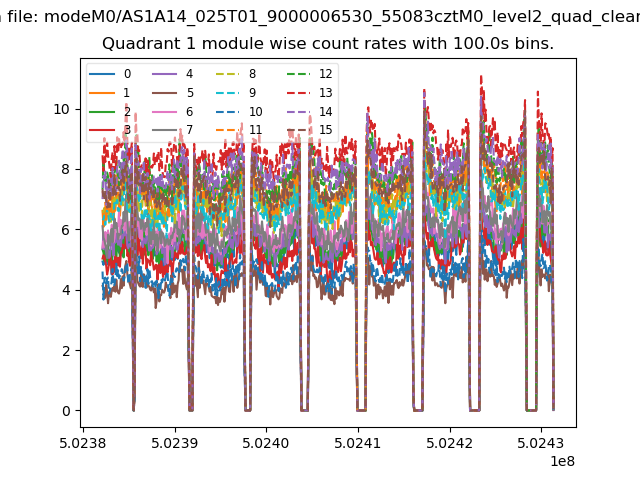
| Module-wise count rates for Quadrant A Data is divided into 100 sec bins |
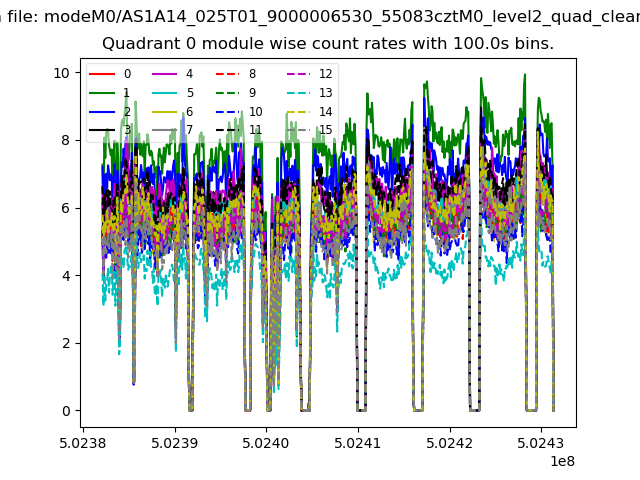 |
 |
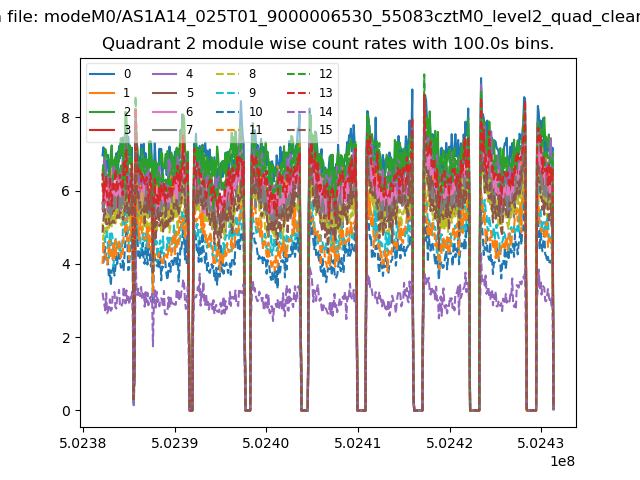
| Module-wise count rates for Quadrant B Data is divided into 100 sec bins |
 |
 |
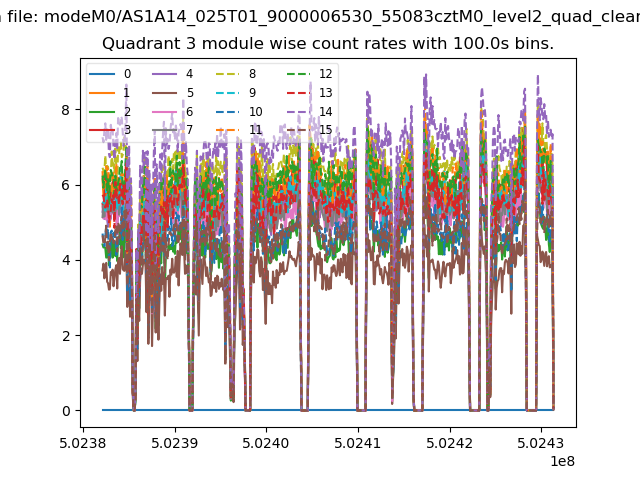
| Module-wise count rates for Quadrant C Data is divided into 100 sec bins |
 |
 |
| Module-wise count rates for Quadrant D Data is divided into 100 sec bins |
 |
 |
| Parameter | Plot |
|---|---|
| CZT HV Monitor | 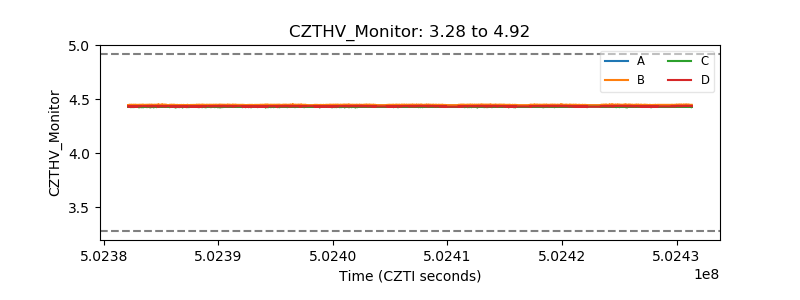 |
| D_VDD | 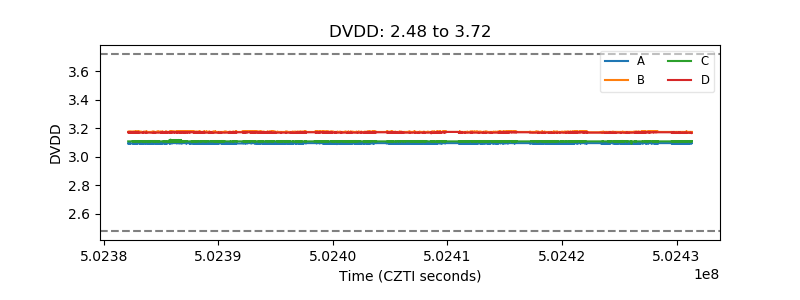 |
| Temperature 1 | 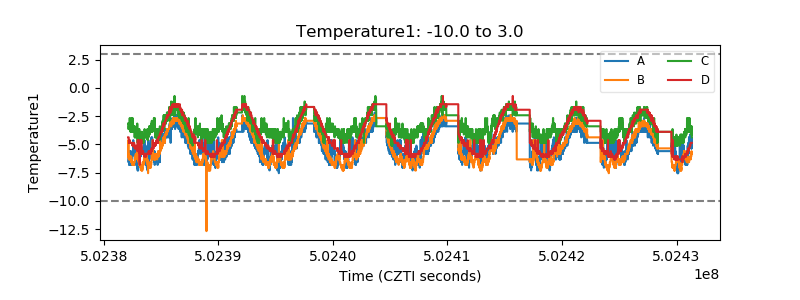 |
| Veto HV Monitor | 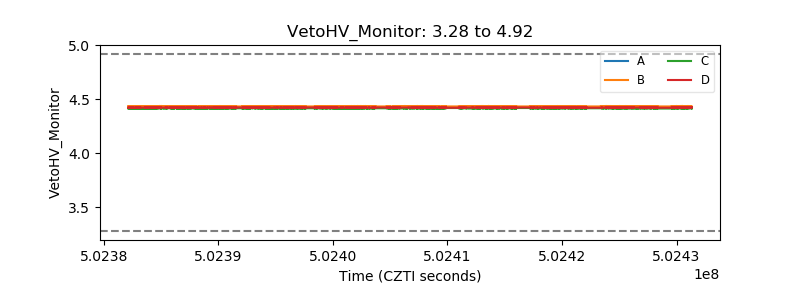 |
| Veto LLD | 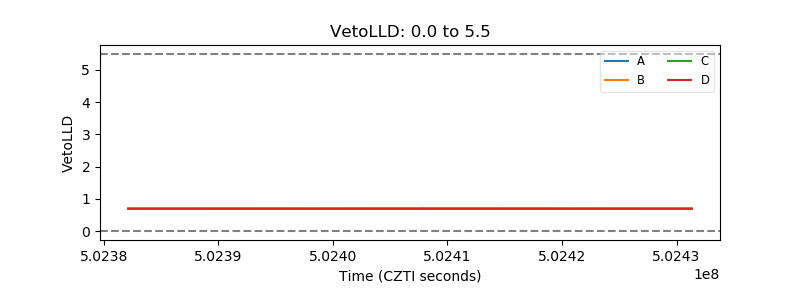 |
| Alpha Counter | 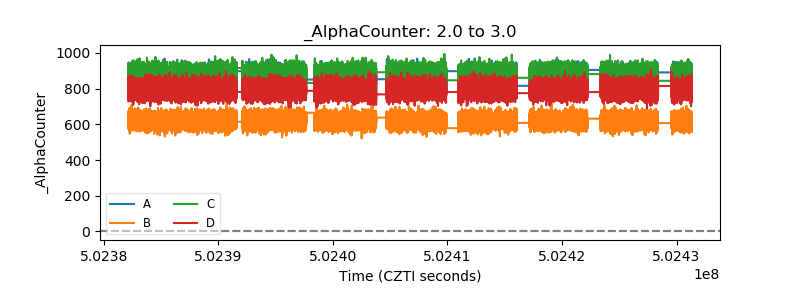 |
| _CPM_Rate | 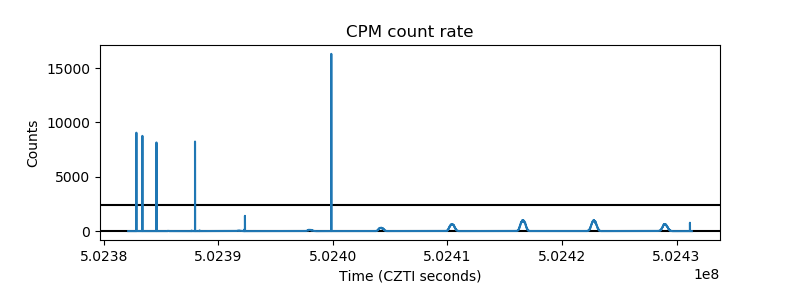 |
| CZT Counter |  |
| +2.5 Volts monitor |  |
| +5 Volts monitor |  |
| _ROLL_ROT | 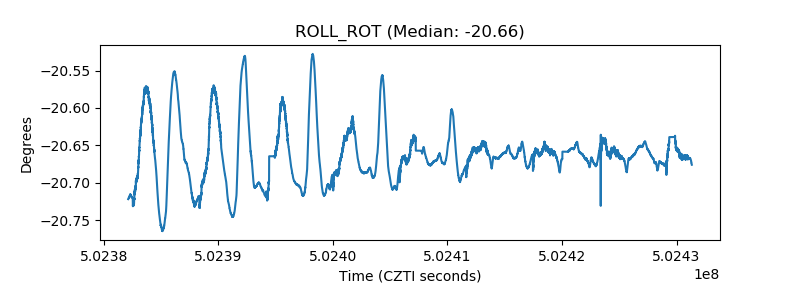 |
| _Roll_DEC | 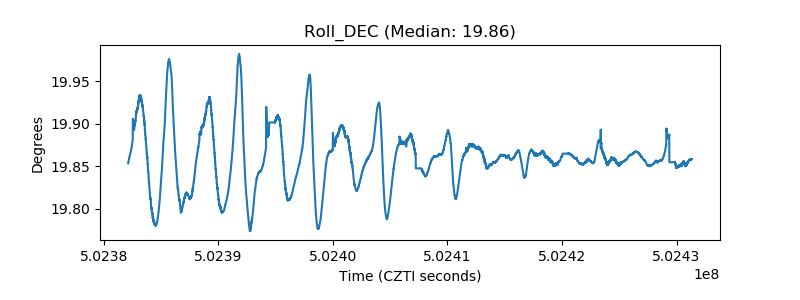 |
| _Roll_RA |  |
| Veto Counter | 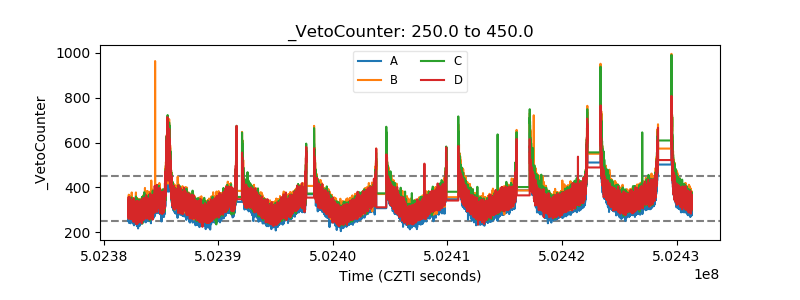 |