| Param | Original file | Final file |
|---|---|---|
| Filename | modeM0/AS1A14_025T01_9000006530_55085cztM0_level2.fits | modeM0/AS1A14_025T01_9000006530_55085cztM0_level2_quad_clean.evt |
| Size (bytes) | 410,716,800 | 105,744,960 |
| Size | 391.7 MB | 100.8 MB |
| Events in quadrant A | 3,266,924 | 687,970 |
| Events in quadrant B | 3,547,716 | 737,248 |
| Events in quadrant C | 3,536,898 | 665,104 |
| Events in quadrant D | 4,293,912 | 612,622 |
| Mode M0 | |||
|---|---|---|---|
| Quadrant | BADHDUFLAG | Total packets | Discarded packets |
| A | 0 | 15099 | 2 |
| B | 0 | 15788 | 2 |
| C | 0 | 15869 | 2 |
| D | 0 | 18049 | 2 |
| Mode SS | |||
|---|---|---|---|
| Quadrant | BADHDUFLAG | Total packets | Discarded packets |
| A | 0 | 148 | 0 |
| B | 0 | 148 | 0 |
| C | 0 | 148 | 0 |
| D | 0 | 148 | 0 |
| Mode M9 | |||
|---|---|---|---|
| Quadrant | BADHDUFLAG | Total packets | Discarded packets |
| A | 0 | 18 | 0 |
| B | 0 | 18 | 0 |
| C | 0 | 18 | 0 |
| D | 0 | 18 | 0 |
| Quadrant | Total seconds | Saturated seconds | Saturation percentage |
|---|---|---|---|
| A | 7166 | 146 | 2.037399% |
| B | 7166 | 245 | 3.418923% |
| C | 7167 | 116 | 1.618529% |
| D | 7167 | 215 | 2.999860% |
Noise dominated data is calculated using 1-second bins in cleaned event files. If a bin has >2000 counts, and if more than 50% of those come from <1% of pixels, then it is considered to be noise-dominated and hence unusable.
| Quadrant | # 1 sec bins | Bins with >0 counts | Bins with >2000 counts | High rate bins dominated by noise | Noise dominated (total time) | Noise dominated (detector-on time) | Marked lightcurve |
|---|---|---|---|---|---|---|---|
| A | 9016 | 7166 | 1 | 1 | 0.01% | 0.01% | 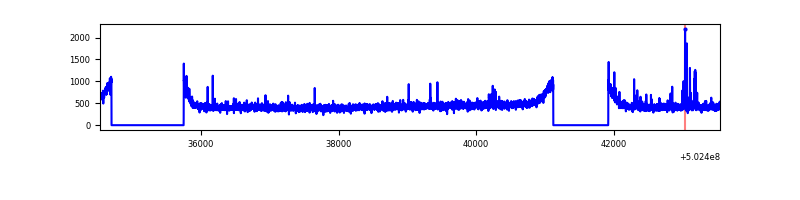 |
| B | 9016 | 7166 | 32 | 32 | 0.35% | 0.45% | 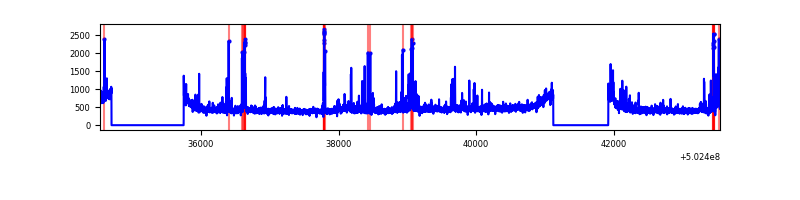 |
| C | 9017 | 7167 | 27 | 27 | 0.30% | 0.38% | 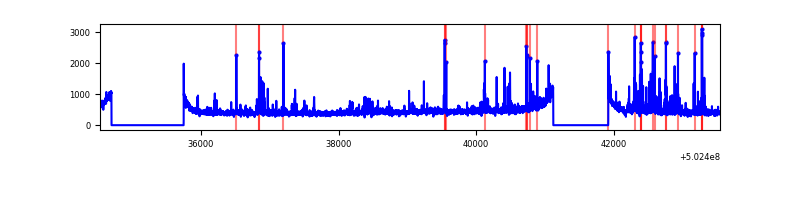 |
| D | 9017 | 7168 | 104 | 104 | 1.15% | 1.45% | 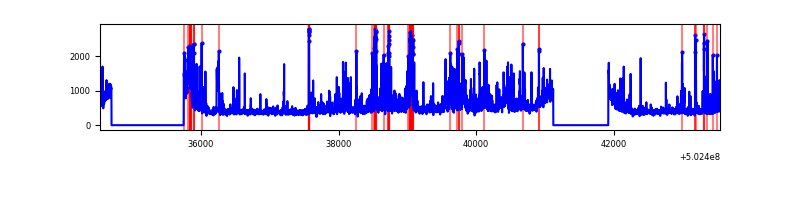 |
Top three noisy pixels from each quadrant. If the there are fewer than three noisy pixels in the level2.evt file, extra rows are filled as -1
| Pixel properties | Quadrant properties | ||||||
|---|---|---|---|---|---|---|---|
| Quadrant | DetID | PixID | Counts | Sigma | Mean | Median | Sigma |
| A | 0 | 250 | 32621 | 158.91 | 816 | 796 | 200.3 |
| A | 4 | 3 | 24532 | 118.52 | 816 | 796 | 200.3 |
| A | 13 | 254 | 23087 | 111.3 | 816 | 796 | 200.3 |
| B | 5 | 185 | 343921 | 1967.54 | 798 | 765 | 174.4 |
| B | 12 | 111 | 21500 | 118.89 | 798 | 765 | 174.4 |
| B | 11 | 111 | 20003 | 110.3 | 798 | 765 | 174.4 |
| C | 6 | 223 | 127143 | 582.4 | 790 | 779 | 217.0 |
| C | 13 | 3 | 85423 | 390.12 | 790 | 779 | 217.0 |
| C | 1 | 16 | 76078 | 347.05 | 790 | 779 | 217.0 |
| D | 11 | 129 | 401670 | 1837.08 | 779 | 747 | 218.2 |
| D | 15 | 94 | 142564 | 649.82 | 779 | 747 | 218.2 |
| D | 2 | 249 | 122284 | 556.9 | 779 | 747 | 218.2 |
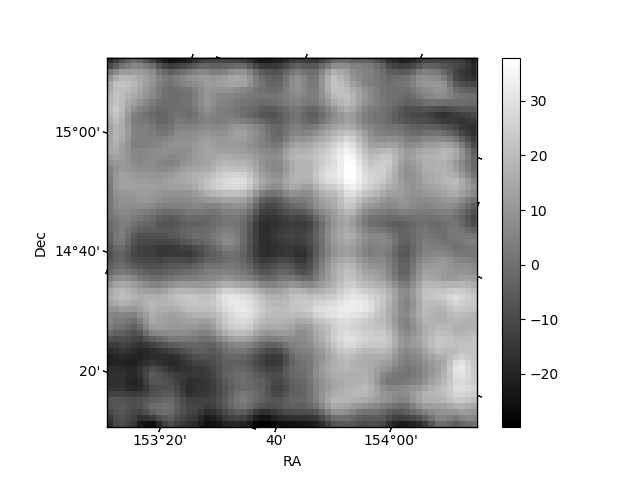
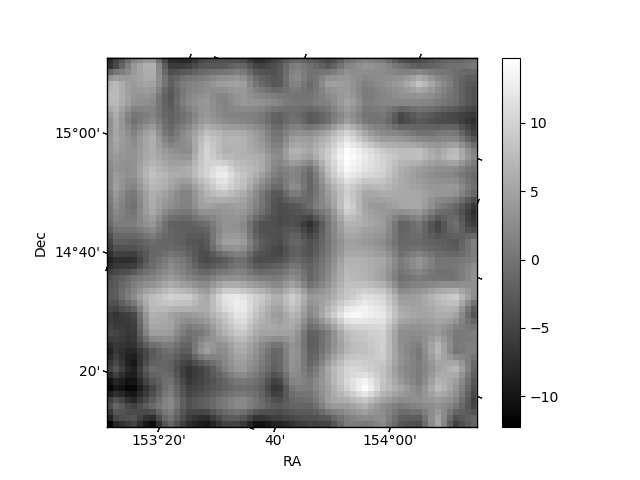
Histogram calculated using DETX and DETY for each event in the final _common_clean file
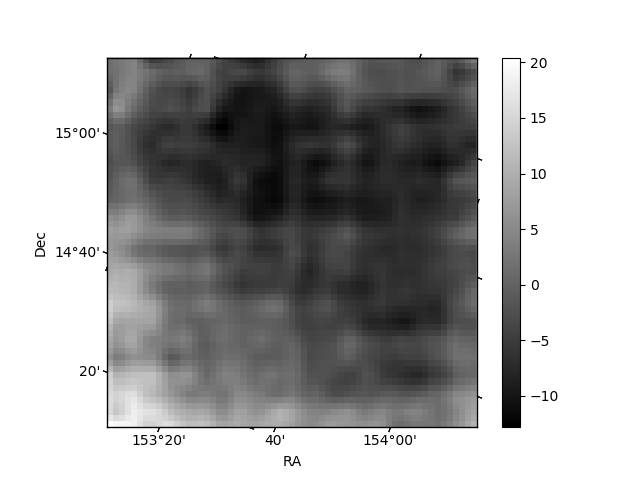
| Quadrant A | 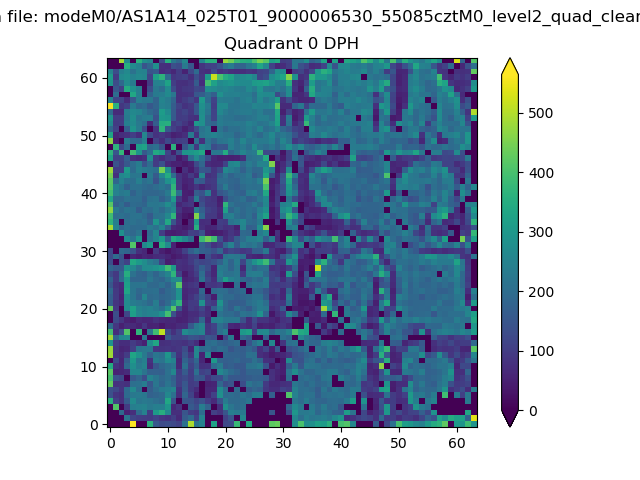 |
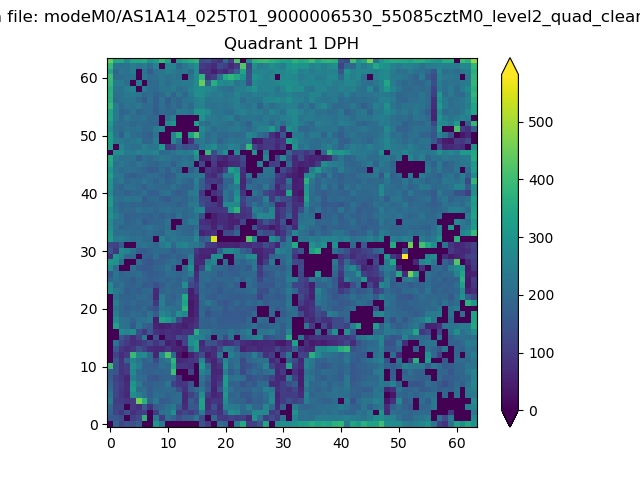 |
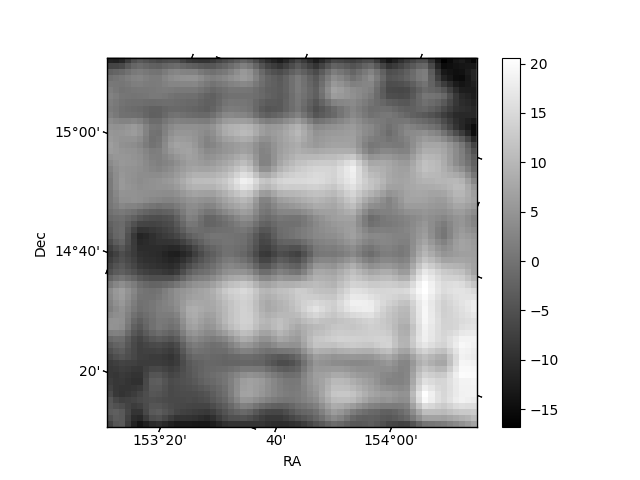
Quadrant B |
|---|---|---|---|
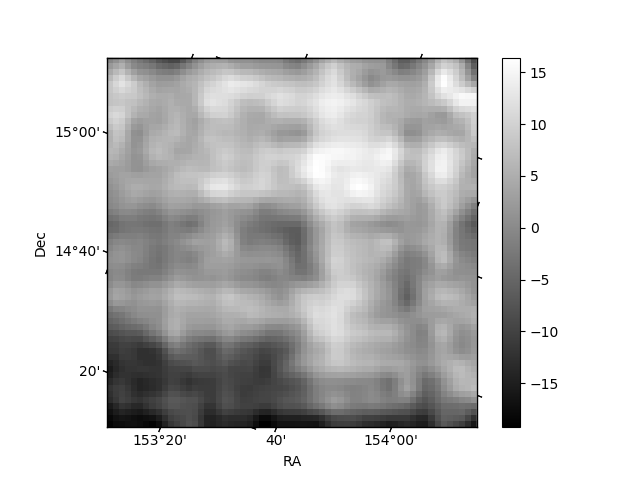
| Quadrant D | 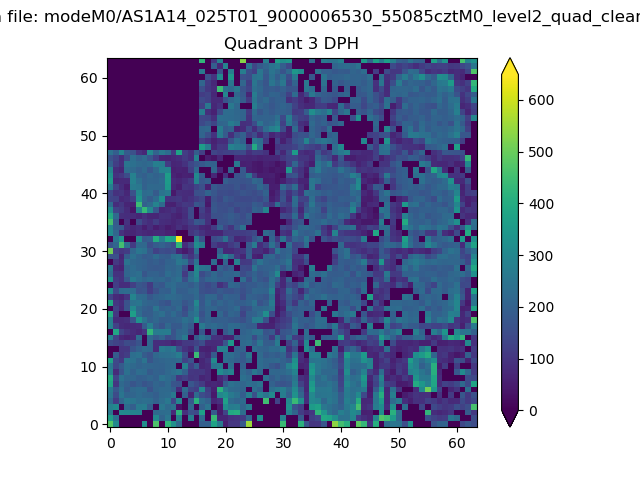 |
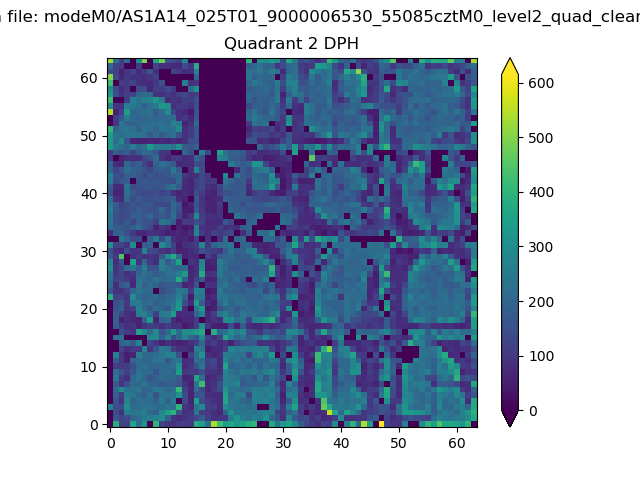 |
Quadrant C |
| Plot type | Count rate plots | Images |
|---|---|---|
| Comparison with Poisson distribution Blue bars denote a histogram of data divided into 1 sec bins. Red curve is a Poisson curve with rate = median count rate of data. |
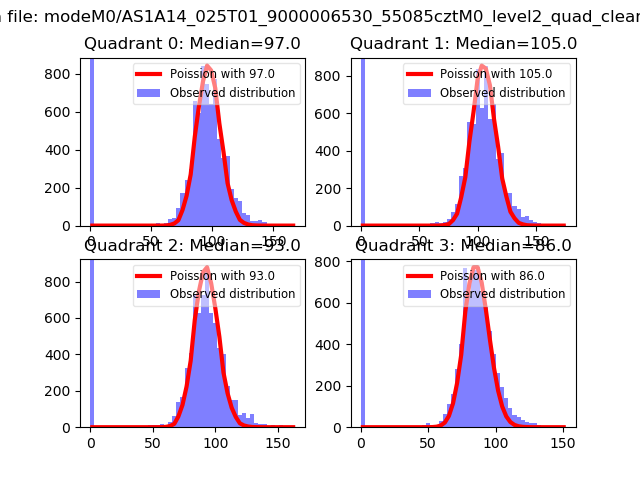 |
 |
| Quadrant-wise count rates Data is divided into 100 sec bins |
 |
|
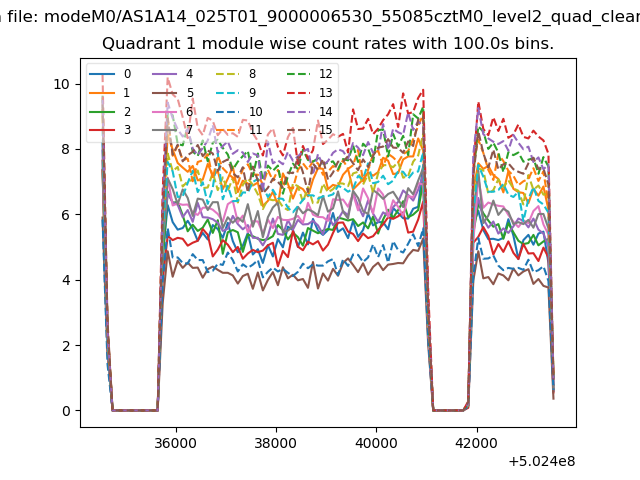
| Module-wise count rates for Quadrant A Data is divided into 100 sec bins |
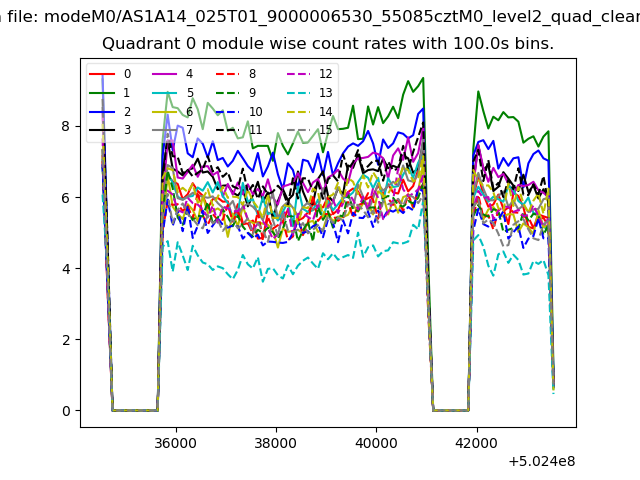 |
 |
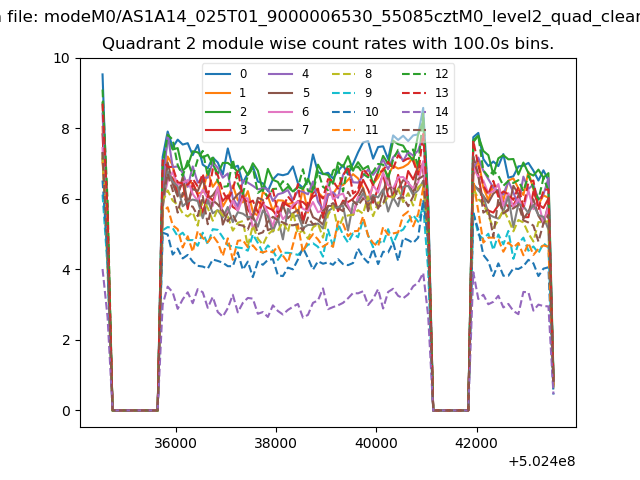
| Module-wise count rates for Quadrant B Data is divided into 100 sec bins |
 |
 |
| Module-wise count rates for Quadrant C Data is divided into 100 sec bins |
 |
 |
| Module-wise count rates for Quadrant D Data is divided into 100 sec bins |
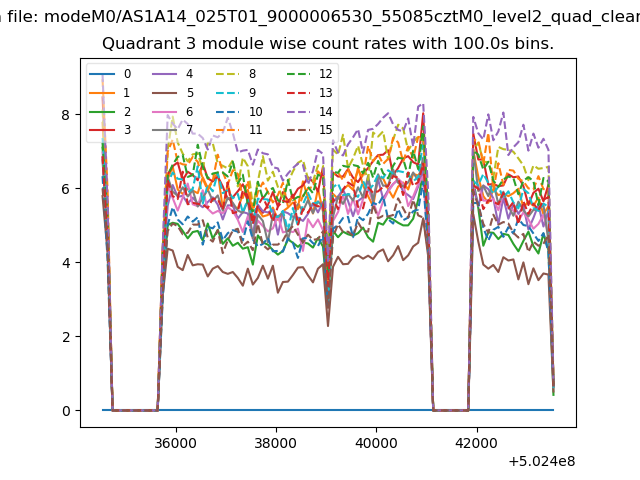 |
 |
| Parameter | Plot |
|---|---|
| CZT HV Monitor | 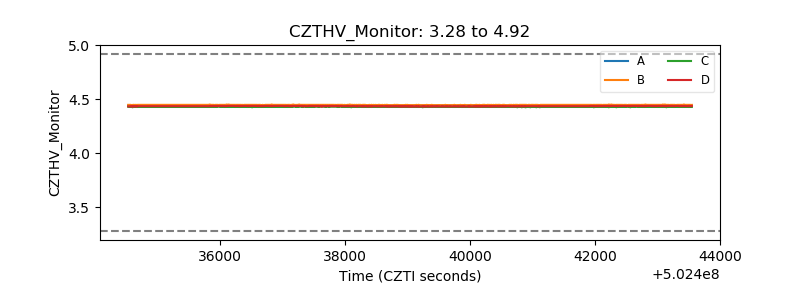 |
| D_VDD | 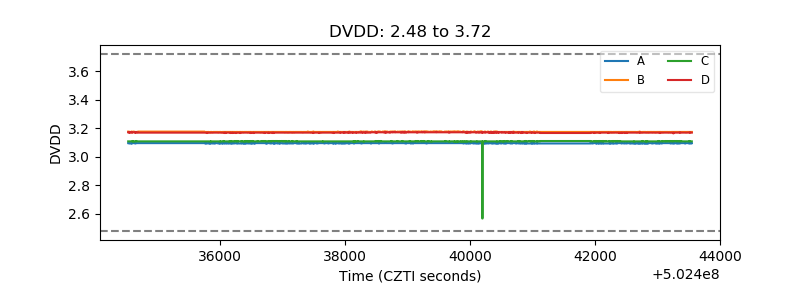 |
| Temperature 1 | 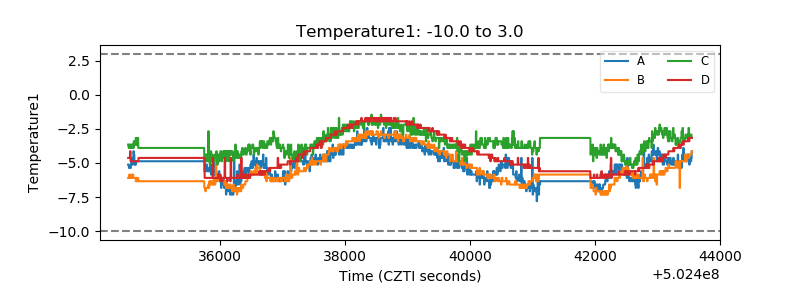 |
| Veto HV Monitor | 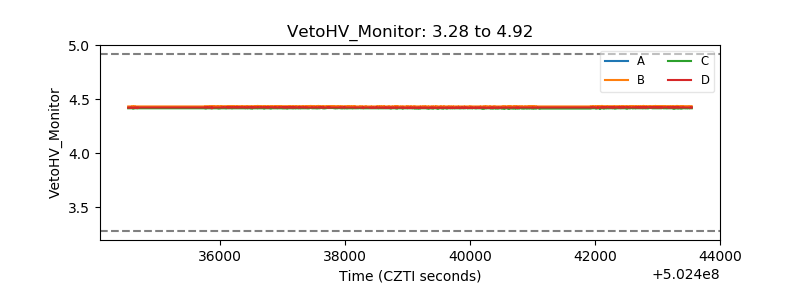 |
| Veto LLD | 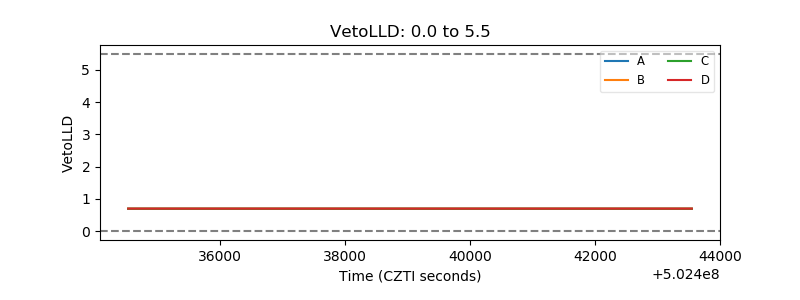 |
| Alpha Counter |  |
| _CPM_Rate | 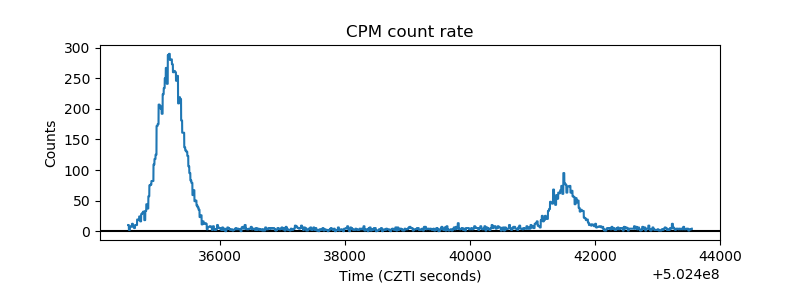 |
| CZT Counter | 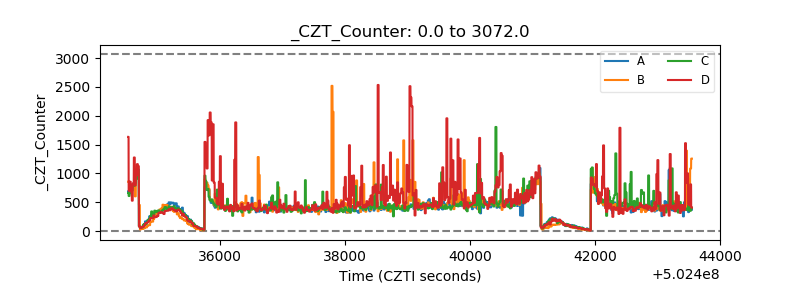 |
| +2.5 Volts monitor |  |
| +5 Volts monitor |  |
| _ROLL_ROT | 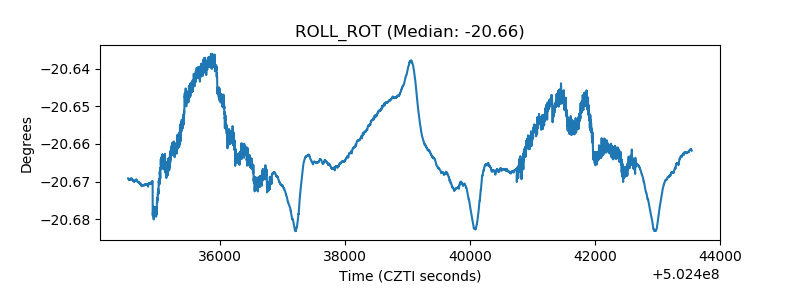 |
| _Roll_DEC | 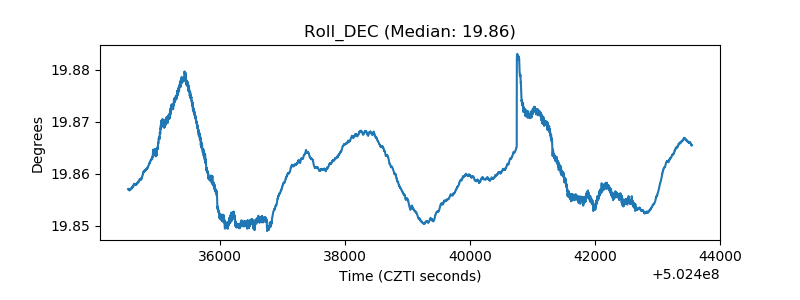 |
| _Roll_RA | 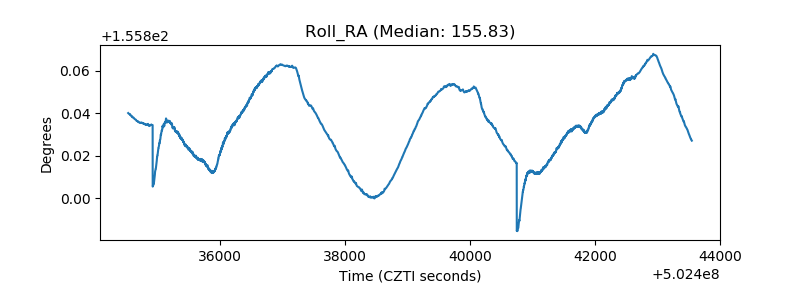 |
| Veto Counter | 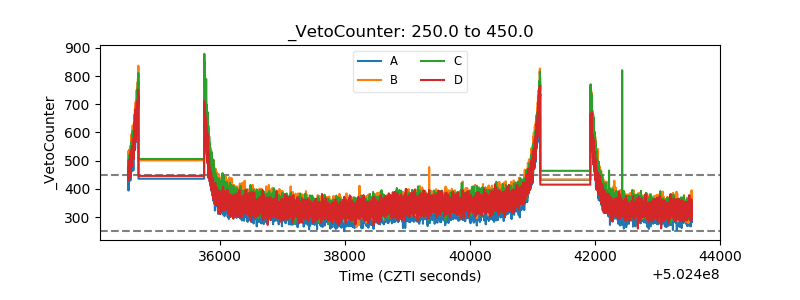 |