| Param | Original file | Final file |
|---|---|---|
| Filename | modeM0/AS1A14_025T01_9000006530_55086cztM0_level2.fits | modeM0/AS1A14_025T01_9000006530_55086cztM0_level2_quad_clean.evt |
| Size (bytes) | 402,327,360 | 98,642,880 |
| Size | 383.7 MB | 94.1 MB |
| Events in quadrant A | 3,177,368 | 639,923 |
| Events in quadrant B | 3,256,215 | 691,635 |
| Events in quadrant C | 3,493,420 | 614,478 |
| Events in quadrant D | 4,428,550 | 561,595 |
| Mode M0 | |||
|---|---|---|---|
| Quadrant | BADHDUFLAG | Total packets | Discarded packets |
| A | 0 | 14773 | 199 |
| B | 0 | 14927 | 197 |
| C | 0 | 15629 | 265 |
| D | 0 | 18431 | 284 |
| Mode SS | |||
|---|---|---|---|
| Quadrant | BADHDUFLAG | Total packets | Discarded packets |
| A | 0 | 138 | 2 |
| B | 0 | 138 | 0 |
| C | 0 | 138 | 0 |
| D | 0 | 138 | 0 |
| Mode M9 | |||
|---|---|---|---|
| Quadrant | BADHDUFLAG | Total packets | Discarded packets |
| A | 0 | 2 | 0 |
| B | 0 | 2 | 0 |
| C | 0 | 2 | 0 |
| D | 0 | 3 | 0 |
| Quadrant | Total seconds | Saturated seconds | Saturation percentage |
|---|---|---|---|
| A | 6898 | 264 | 3.827196% |
| B | 6895 | 279 | 4.046410% |
| C | 6895 | 214 | 3.103698% |
| D | 6879 | 405 | 5.887484% |
Noise dominated data is calculated using 1-second bins in cleaned event files. If a bin has >2000 counts, and if more than 50% of those come from <1% of pixels, then it is considered to be noise-dominated and hence unusable.
| Quadrant | # 1 sec bins | Bins with >0 counts | Bins with >2000 counts | High rate bins dominated by noise | Noise dominated (total time) | Noise dominated (detector-on time) | Marked lightcurve |
|---|---|---|---|---|---|---|---|
| A | 7817 | 6991 | 17 | 17 | 0.22% | 0.24% | 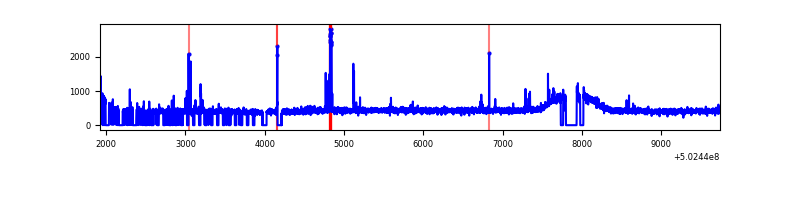 |
| B | 7818 | 6993 | 9 | 9 | 0.12% | 0.13% | 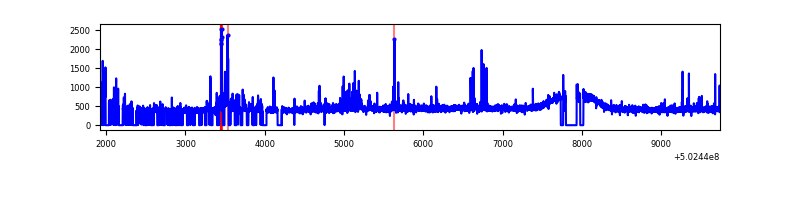 |
| C | 7817 | 6988 | 42 | 42 | 0.54% | 0.60% | 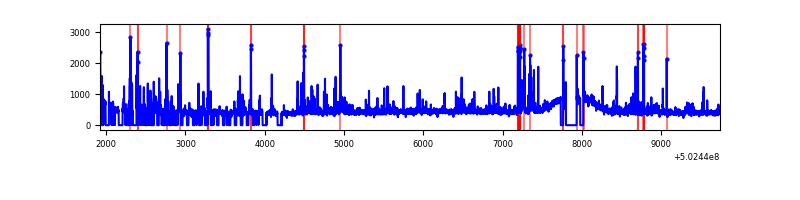 |
| D | 7817 | 6981 | 198 | 198 | 2.53% | 2.84% | 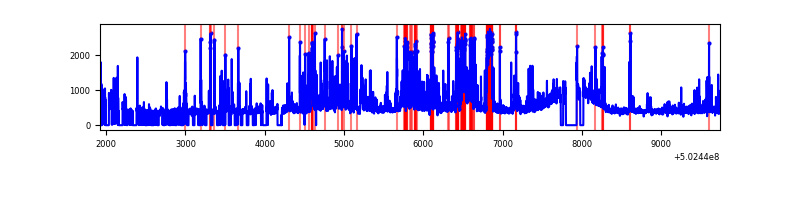 |
Top three noisy pixels from each quadrant. If the there are fewer than three noisy pixels in the level2.evt file, extra rows are filled as -1
| Pixel properties | Quadrant properties | ||||||
|---|---|---|---|---|---|---|---|
| Quadrant | DetID | PixID | Counts | Sigma | Mean | Median | Sigma |
| A | 0 | 8 | 72290 | 372.28 | 778 | 758 | 192.1 |
| A | 4 | 3 | 26601 | 134.5 | 778 | 758 | 192.1 |
| A | 13 | 254 | 21386 | 107.36 | 778 | 758 | 192.1 |
| B | 5 | 185 | 166825 | 1000.54 | 764 | 732 | 166.0 |
| B | 0 | 182 | 50697 | 300.99 | 764 | 732 | 166.0 |
| B | 12 | 111 | 20824 | 121.03 | 764 | 732 | 166.0 |
| C | 13 | 3 | 165676 | 797.7 | 758 | 750 | 206.8 |
| C | 6 | 223 | 130460 | 627.37 | 758 | 750 | 206.8 |
| C | 12 | 252 | 42343 | 201.17 | 758 | 750 | 206.8 |
| D | 9 | 1 | 454898 | 2157.64 | 749 | 716 | 210.5 |
| D | 11 | 129 | 344132 | 1631.44 | 749 | 716 | 210.5 |
| D | 6 | 239 | 218325 | 1033.78 | 749 | 716 | 210.5 |
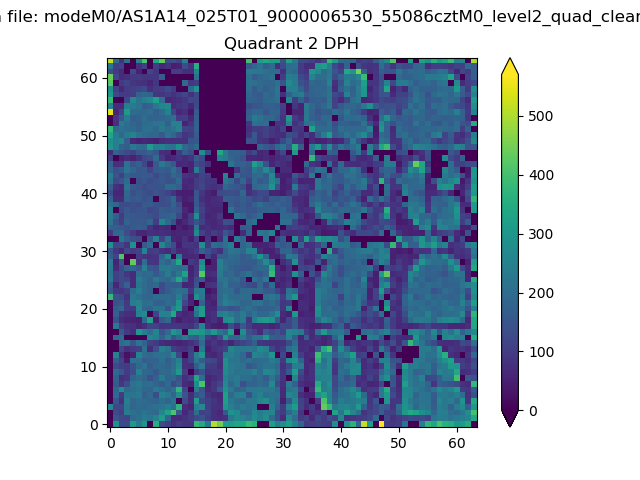
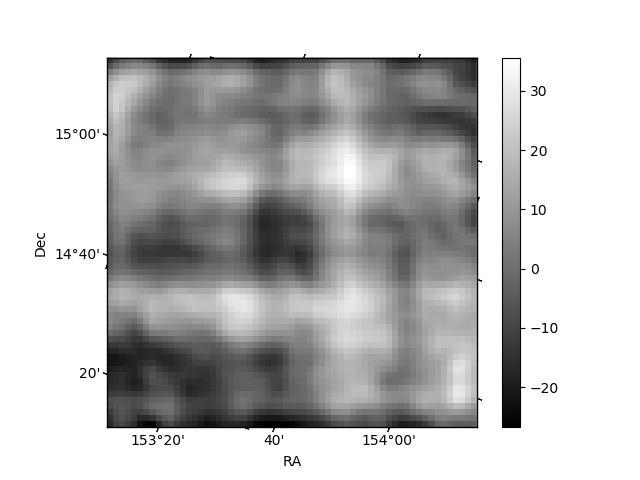
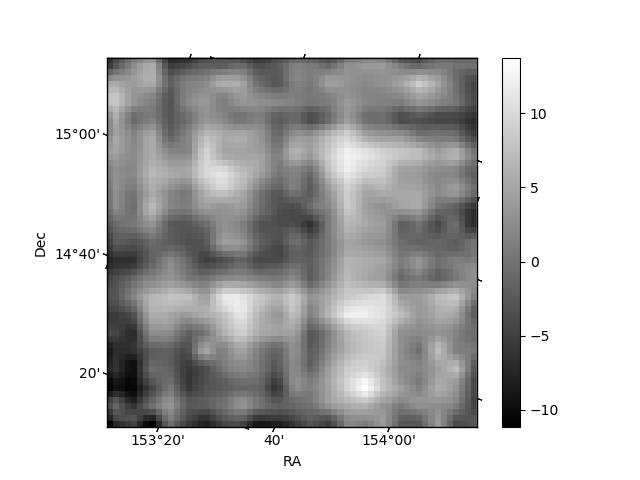
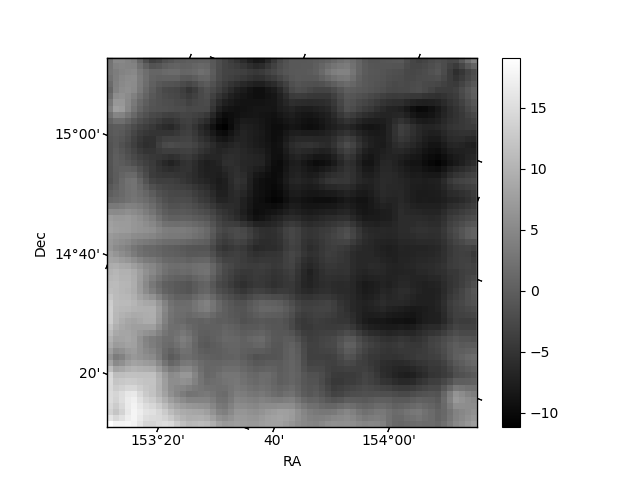
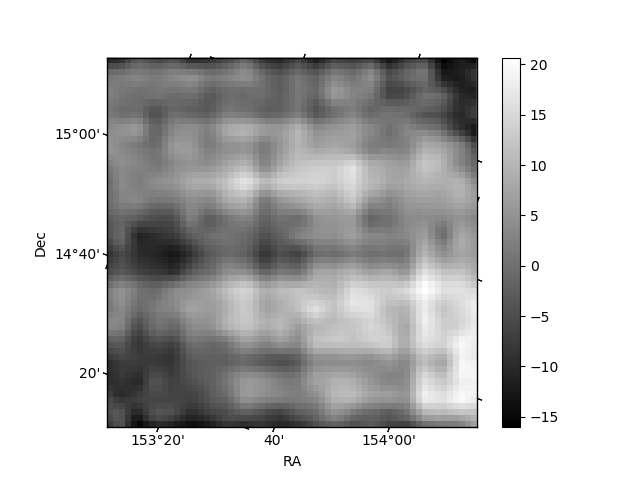
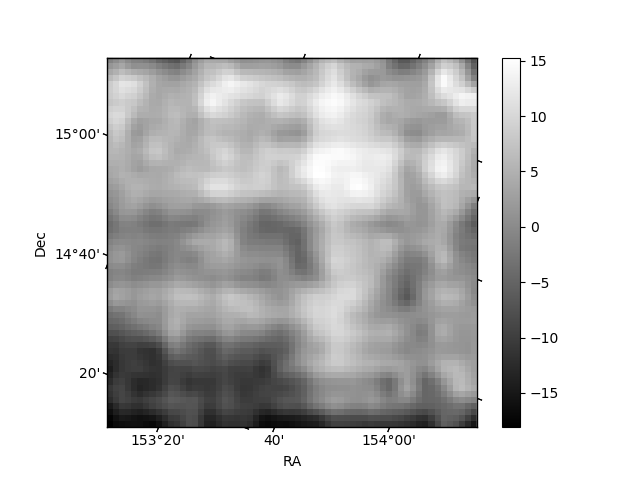
Histogram calculated using DETX and DETY for each event in the final _common_clean file
| Quadrant A | 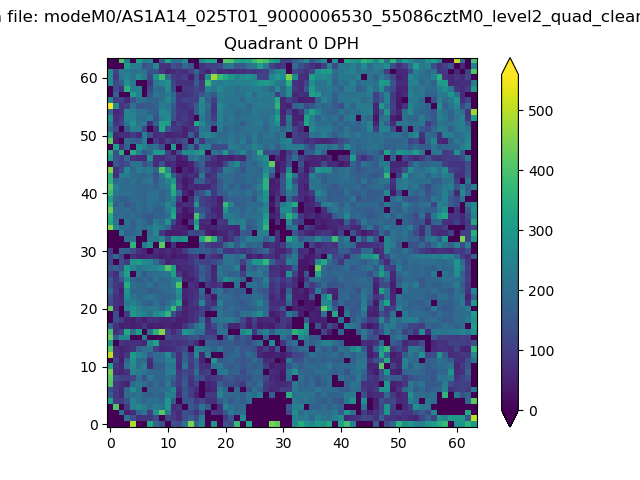 |
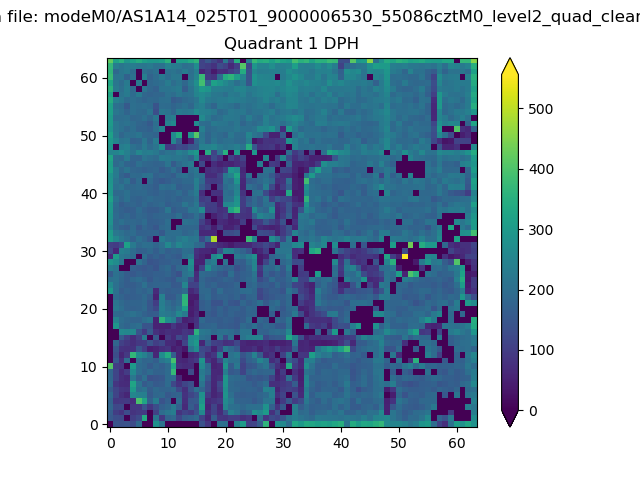 |
Quadrant B |
|---|---|---|---|
| Quadrant D | 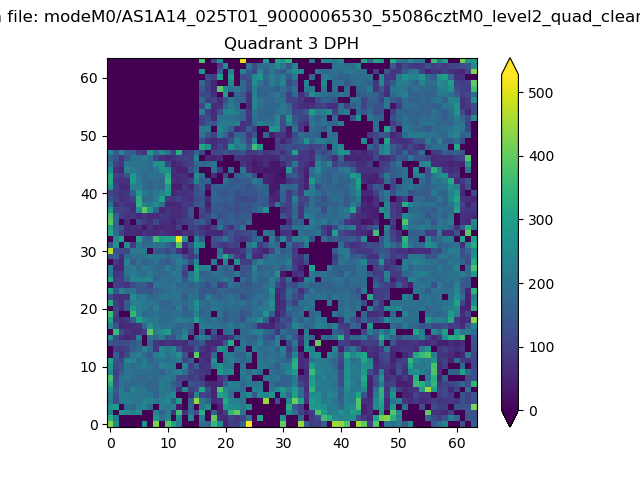 |
 |
Quadrant C |
| Plot type | Count rate plots | Images |
|---|---|---|
| Comparison with Poisson distribution Blue bars denote a histogram of data divided into 1 sec bins. Red curve is a Poisson curve with rate = median count rate of data. |
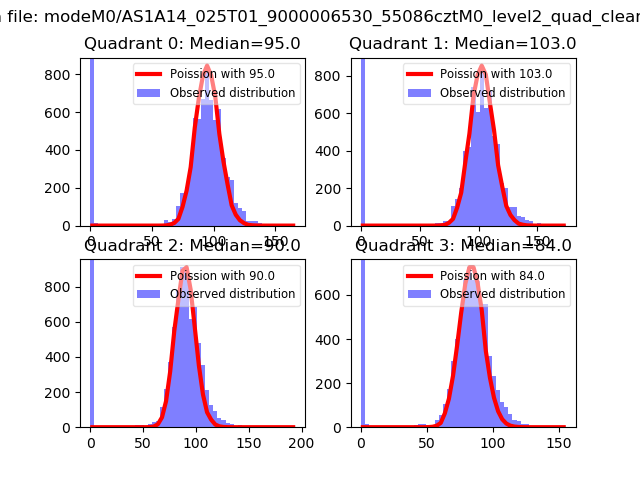 |
 |
| Quadrant-wise count rates Data is divided into 100 sec bins |
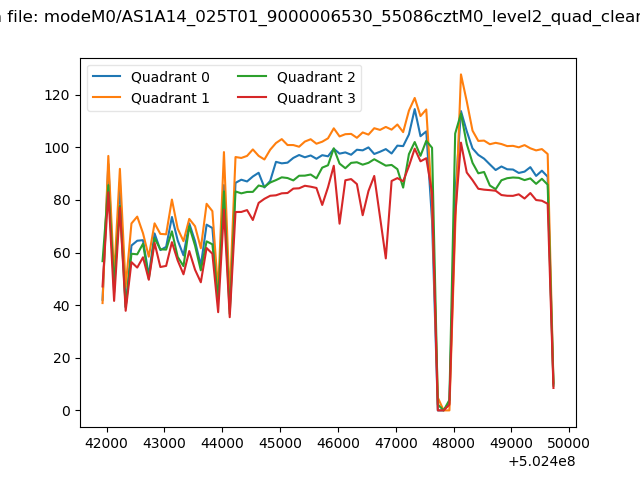 |
|
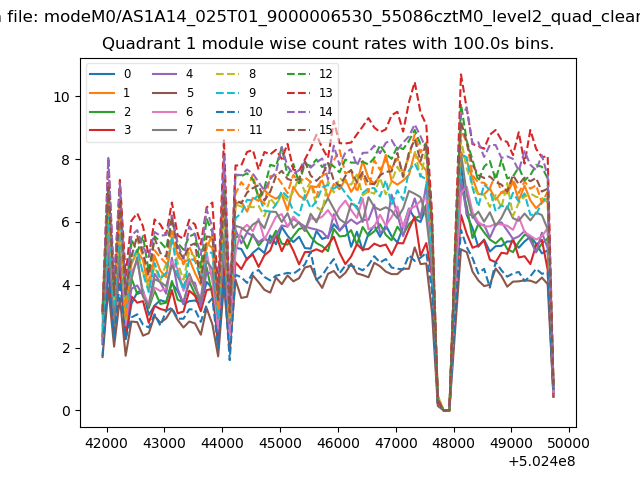
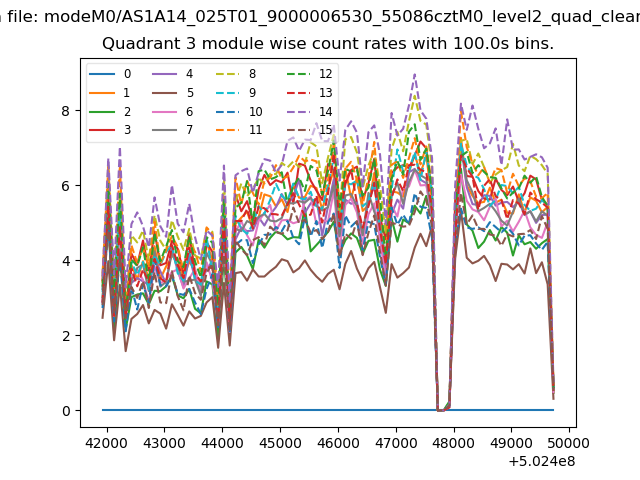
| Module-wise count rates for Quadrant A Data is divided into 100 sec bins |
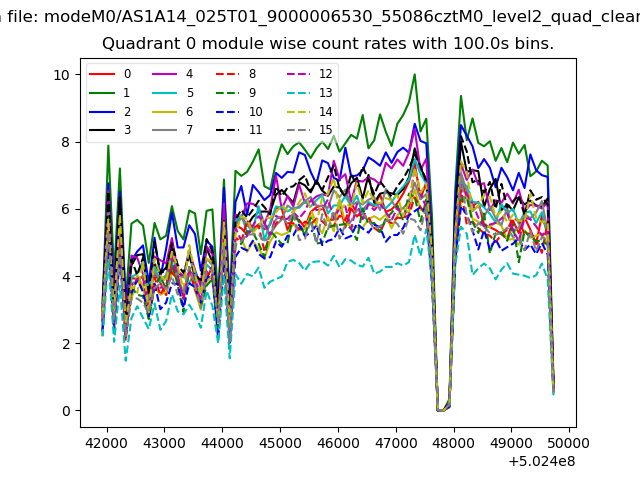 |
 |
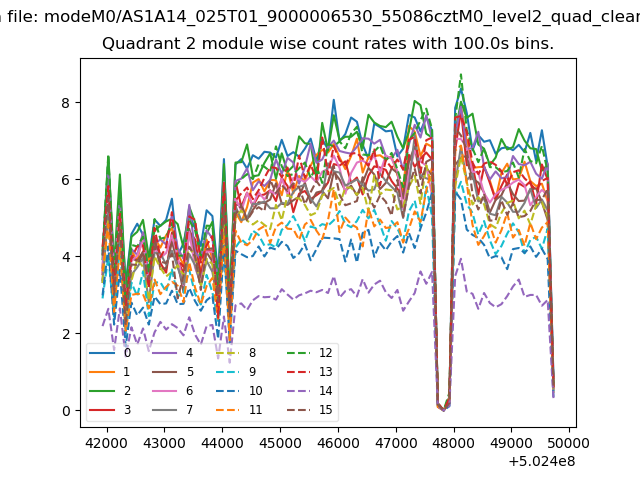
| Module-wise count rates for Quadrant B Data is divided into 100 sec bins |
 |
 |
| Module-wise count rates for Quadrant C Data is divided into 100 sec bins |
 |
 |
| Module-wise count rates for Quadrant D Data is divided into 100 sec bins |
 |
 |
| Parameter | Plot |
|---|---|
| CZT HV Monitor | 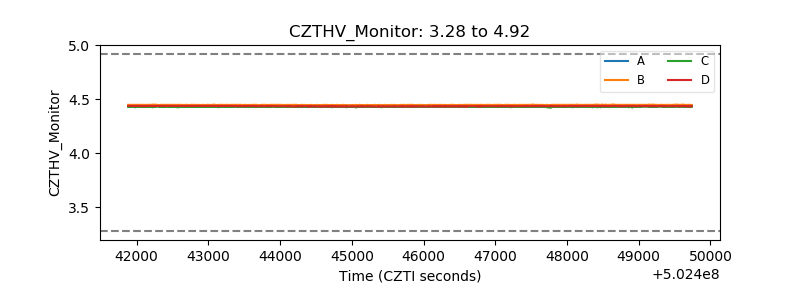 |
| D_VDD | 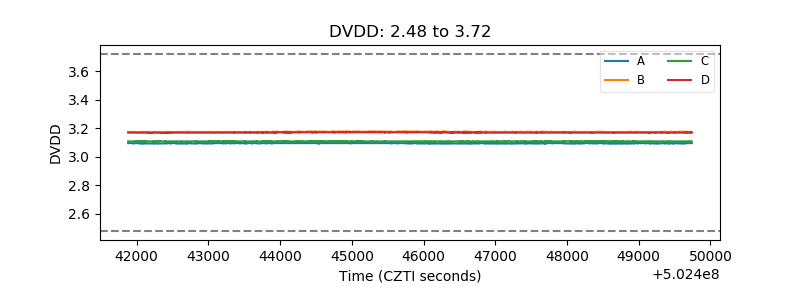 |
| Temperature 1 |  |
| Veto HV Monitor | 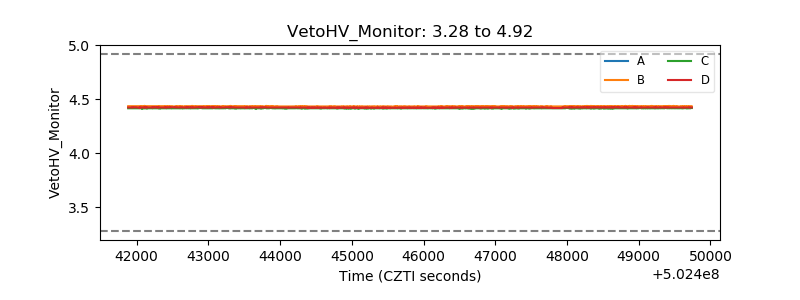 |
| Veto LLD | 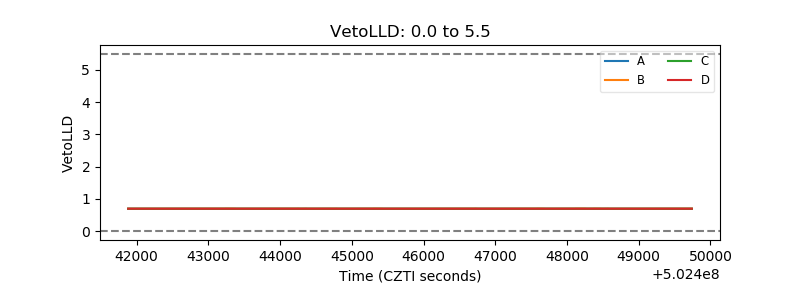 |
| Alpha Counter | 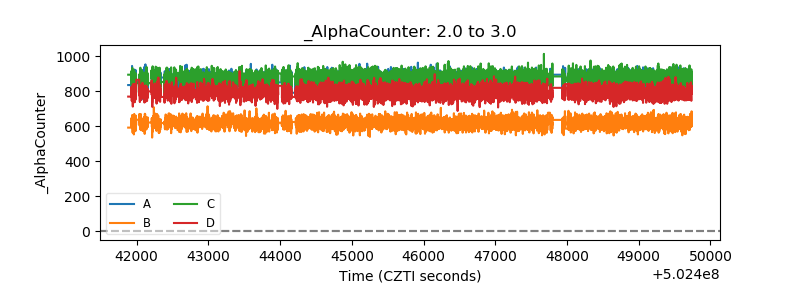 |
| _CPM_Rate | 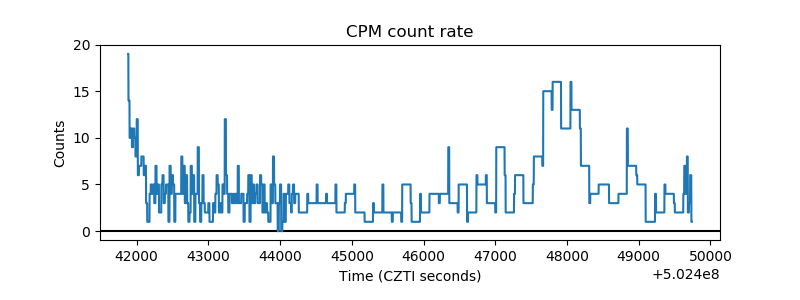 |
| CZT Counter |  |
| +2.5 Volts monitor |  |
| +5 Volts monitor |  |
| _ROLL_ROT | 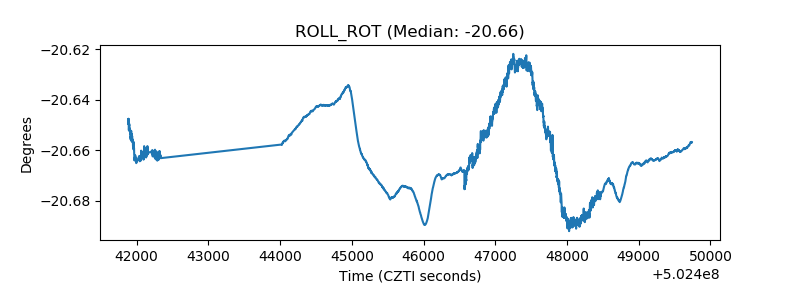 |
| _Roll_DEC | 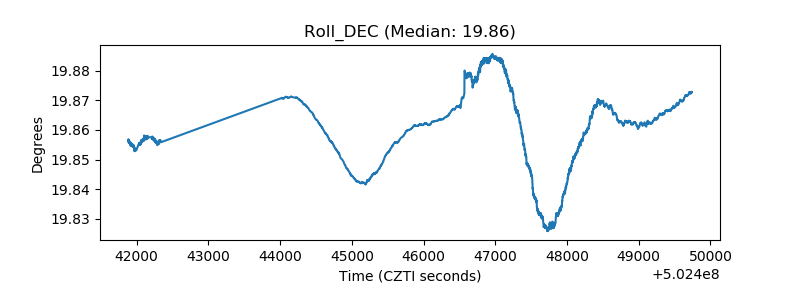 |
| _Roll_RA | 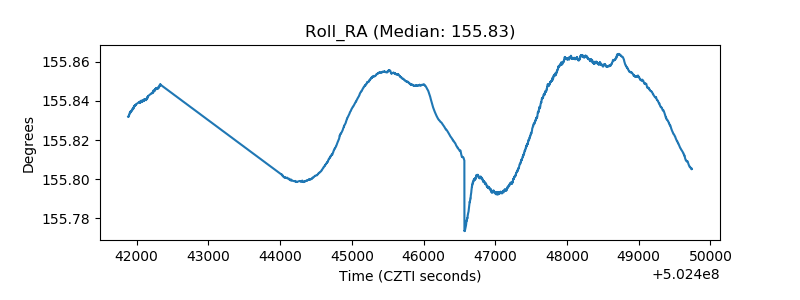 |
| Veto Counter | 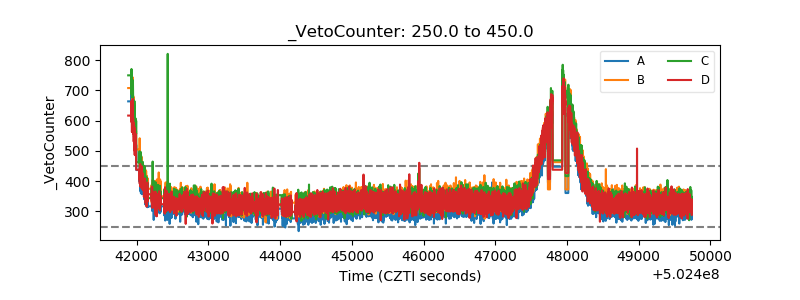 |