| Param | Original file | Final file |
|---|---|---|
| Filename | modeM0/AS1A14_025T01_9000006530_55087cztM0_level2.fits | modeM0/AS1A14_025T01_9000006530_55087cztM0_level2_quad_clean.evt |
| Size (bytes) | 410,826,240 | 109,535,040 |
| Size | 391.8 MB | 104.5 MB |
| Events in quadrant A | 3,234,722 | 712,433 |
| Events in quadrant B | 3,324,647 | 770,206 |
| Events in quadrant C | 4,039,664 | 676,537 |
| Events in quadrant D | 4,019,136 | 630,578 |
| Mode M0 | |||
|---|---|---|---|
| Quadrant | BADHDUFLAG | Total packets | Discarded packets |
| A | 0 | 15410 | 0 |
| B | 0 | 15529 | 3 |
| C | 0 | 17574 | 0 |
| D | 0 | 17405 | 2 |
| Mode SS | |||
|---|---|---|---|
| Quadrant | BADHDUFLAG | Total packets | Discarded packets |
| A | 0 | 152 | 0 |
| B | 0 | 152 | 0 |
| C | 0 | 152 | 0 |
| D | 0 | 152 | 0 |
| Quadrant | Total seconds | Saturated seconds | Saturation percentage |
|---|---|---|---|
| A | 7573 | 4 | 0.052819% |
| B | 7572 | 16 | 0.211305% |
| C | 7573 | 52 | 0.686650% |
| D | 7572 | 119 | 1.571580% |
Noise dominated data is calculated using 1-second bins in cleaned event files. If a bin has >2000 counts, and if more than 50% of those come from <1% of pixels, then it is considered to be noise-dominated and hence unusable.
| Quadrant | # 1 sec bins | Bins with >0 counts | Bins with >2000 counts | High rate bins dominated by noise | Noise dominated (total time) | Noise dominated (detector-on time) | Marked lightcurve |
|---|---|---|---|---|---|---|---|
| A | 7572 | 7572 | 2 | 2 | 0.03% | 0.03% | 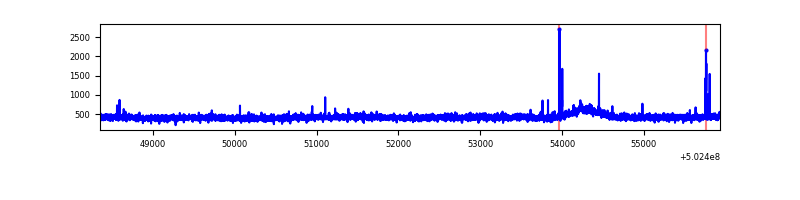 |
| B | 7572 | 7571 | 8 | 8 | 0.11% | 0.11% | 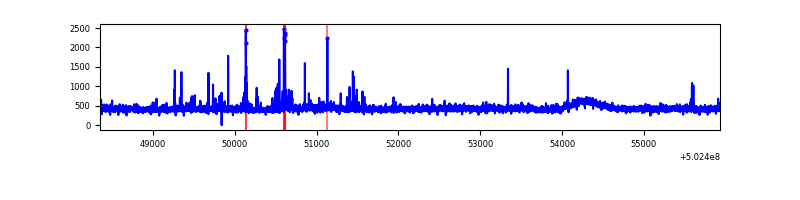 |
| C | 7572 | 7572 | 41 | 41 | 0.54% | 0.54% | 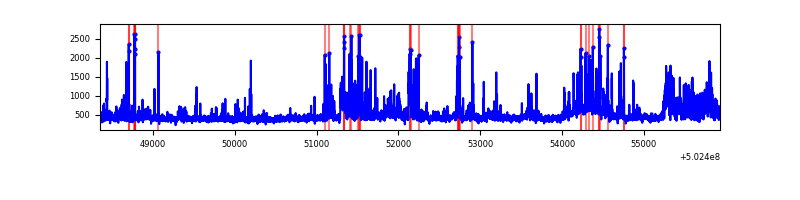 |
| D | 7572 | 7572 | 123 | 123 | 1.62% | 1.62% | 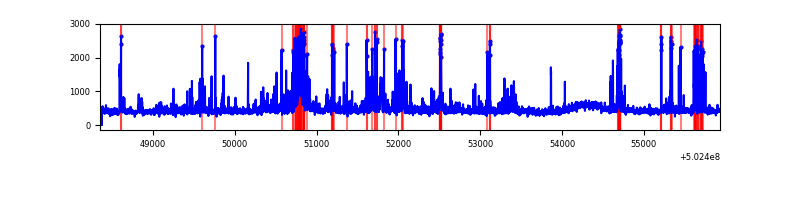 |
Top three noisy pixels from each quadrant. If the there are fewer than three noisy pixels in the level2.evt file, extra rows are filled as -1
| Pixel properties | Quadrant properties | ||||||
|---|---|---|---|---|---|---|---|
| Quadrant | DetID | PixID | Counts | Sigma | Mean | Median | Sigma |
| A | 4 | 3 | 28842 | 139.09 | 816 | 794 | 201.7 |
| A | 0 | 8 | 26976 | 129.83 | 816 | 794 | 201.7 |
| A | 13 | 254 | 22237 | 106.33 | 816 | 794 | 201.7 |
| B | 5 | 185 | 68166 | 387.13 | 804 | 773 | 174.1 |
| B | 4 | 169 | 28400 | 158.7 | 804 | 773 | 174.1 |
| B | 0 | 182 | 28181 | 157.44 | 804 | 773 | 174.1 |
| C | 9 | 38 | 372897 | 1723.26 | 790 | 781 | 215.9 |
| C | 13 | 3 | 215561 | 994.64 | 790 | 781 | 215.9 |
| C | 12 | 252 | 135092 | 621.99 | 790 | 781 | 215.9 |
| D | 9 | 1 | 281890 | 1292.89 | 782 | 749 | 217.5 |
| D | 7 | 96 | 203178 | 930.91 | 782 | 749 | 217.5 |
| D | 11 | 129 | 115300 | 526.79 | 782 | 749 | 217.5 |
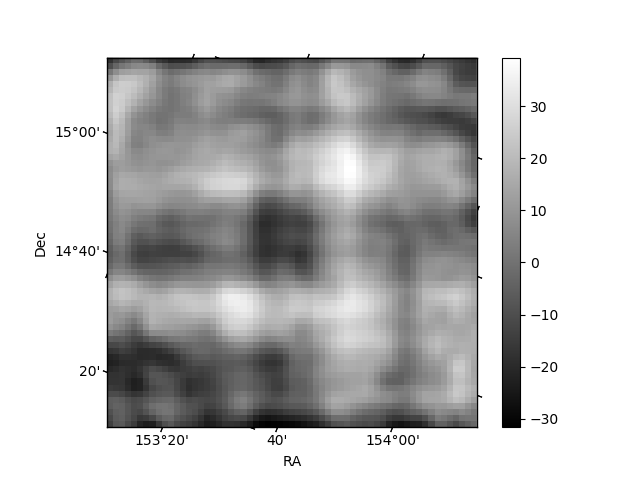
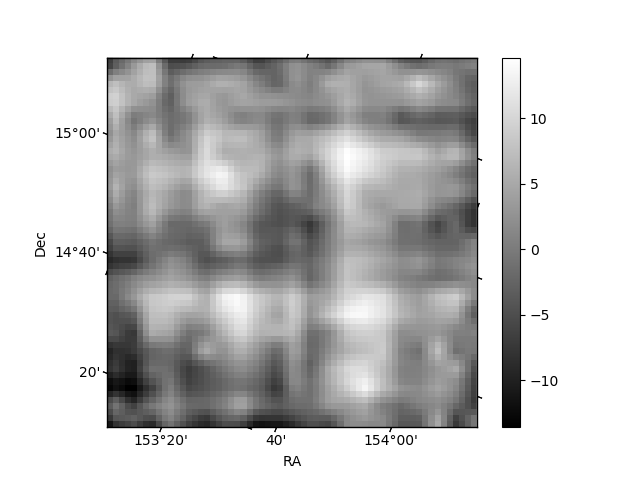
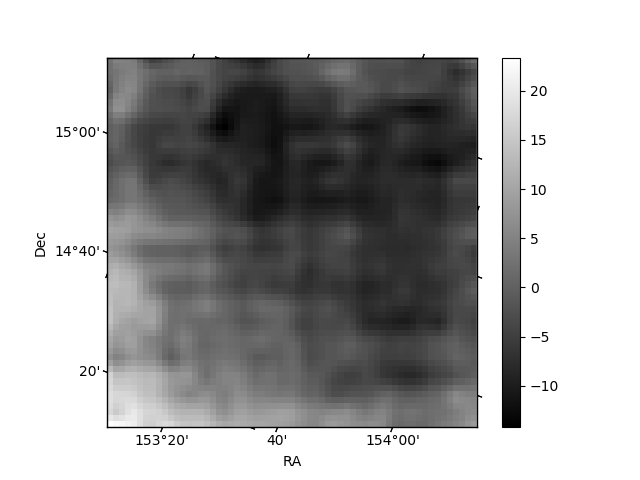
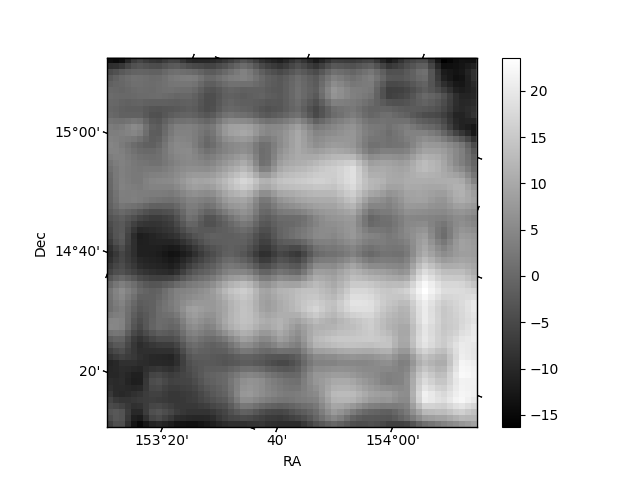
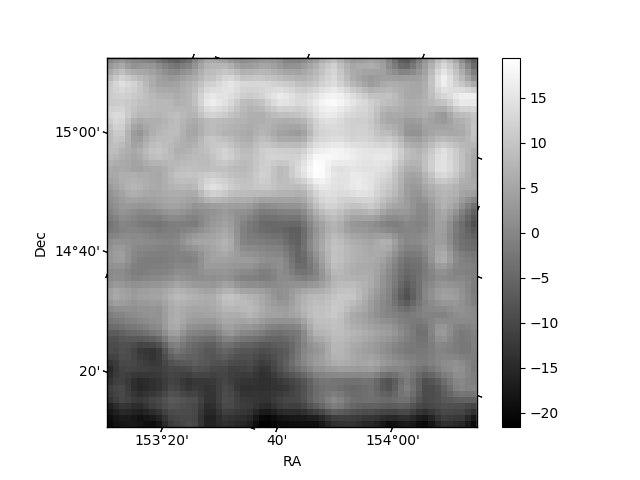
Histogram calculated using DETX and DETY for each event in the final _common_clean file
| Quadrant A | 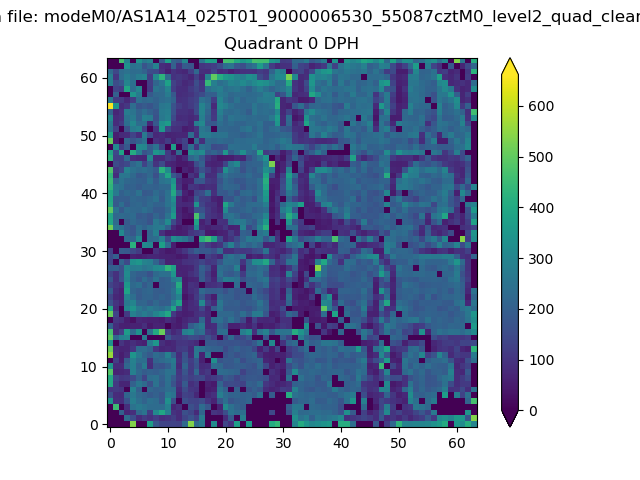 |
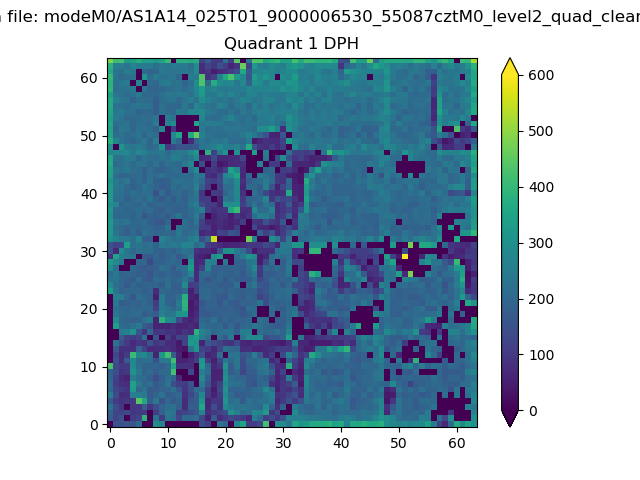 |
Quadrant B |
|---|---|---|---|
| Quadrant D | 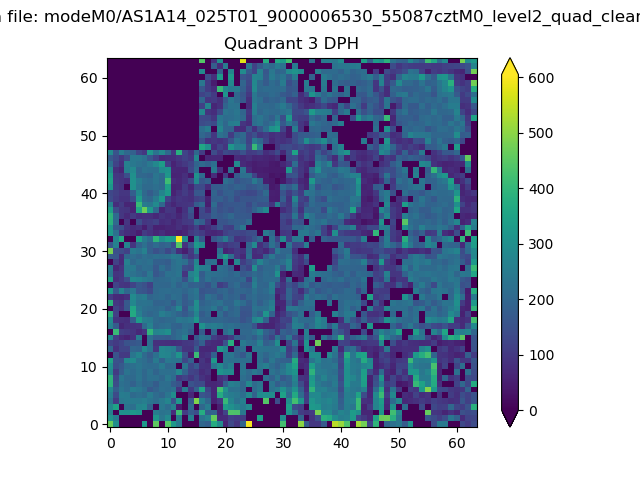 |
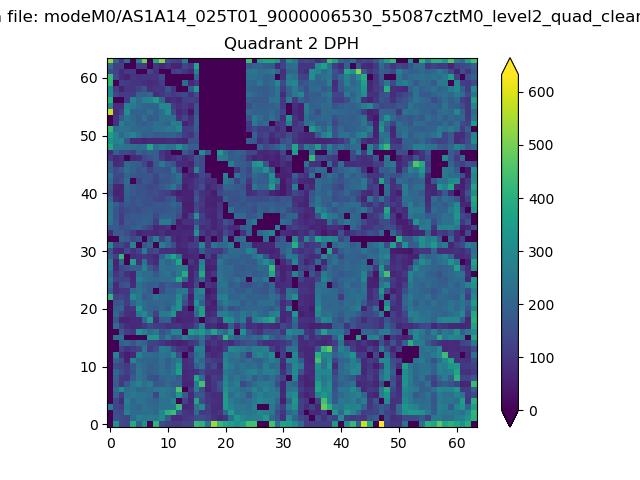 |
Quadrant C |
| Plot type | Count rate plots | Images |
|---|---|---|
| Comparison with Poisson distribution Blue bars denote a histogram of data divided into 1 sec bins. Red curve is a Poisson curve with rate = median count rate of data. |
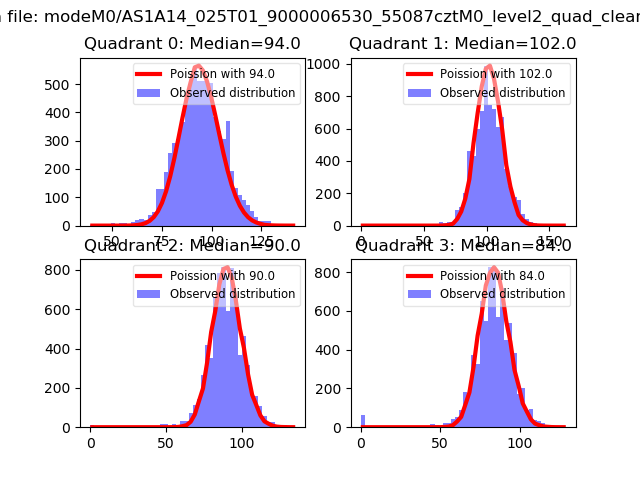 |
 |
| Quadrant-wise count rates Data is divided into 100 sec bins |
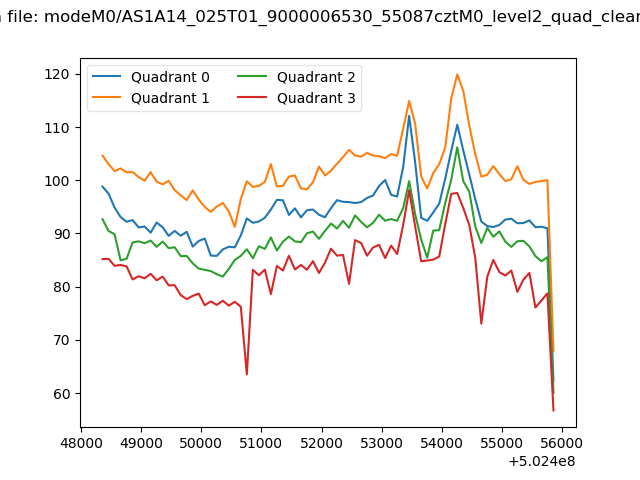 |
|
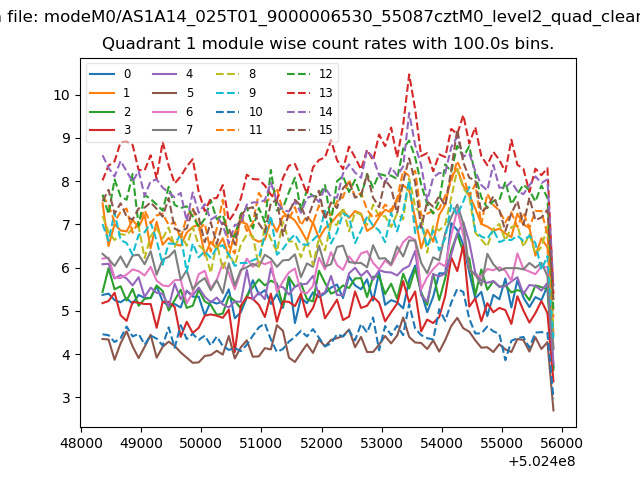
| Module-wise count rates for Quadrant A Data is divided into 100 sec bins |
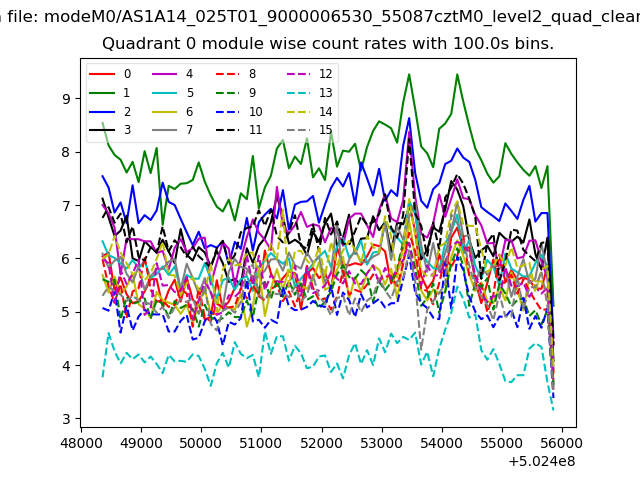 |
 |
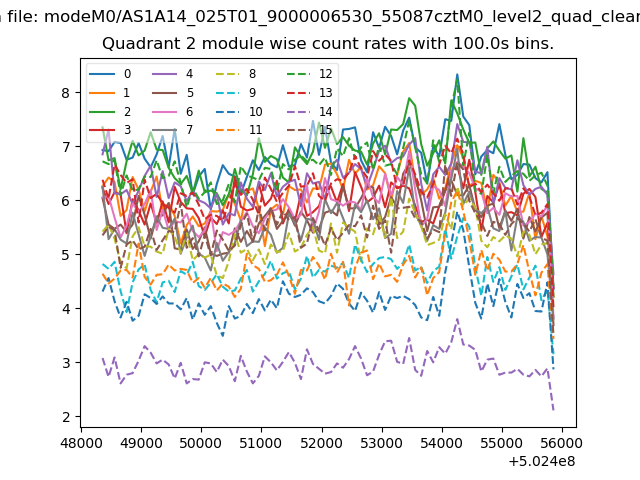
| Module-wise count rates for Quadrant B Data is divided into 100 sec bins |
 |
 |
| Module-wise count rates for Quadrant C Data is divided into 100 sec bins |
 |
 |
| Module-wise count rates for Quadrant D Data is divided into 100 sec bins |
 |
 |
| Parameter | Plot |
|---|---|
| CZT HV Monitor | 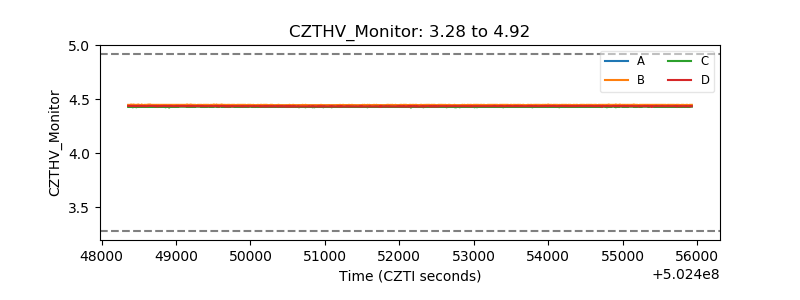 |
| D_VDD | 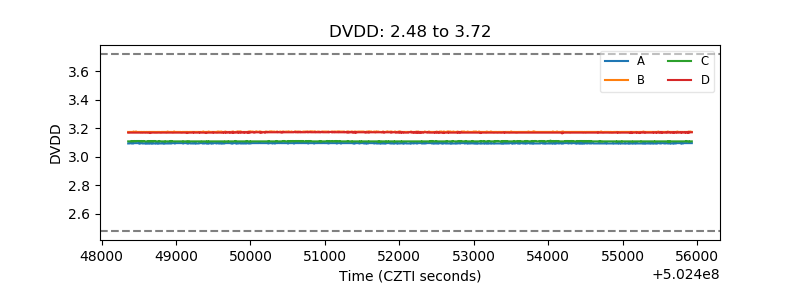 |
| Temperature 1 | 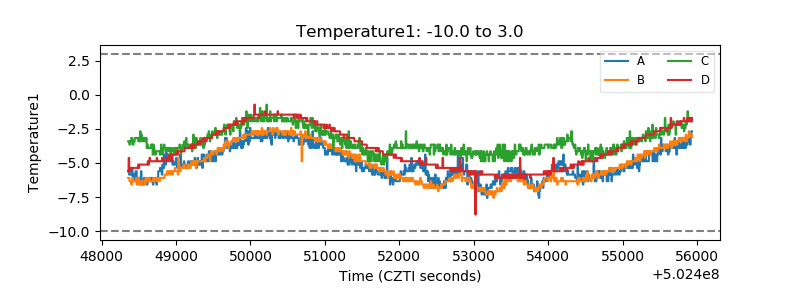 |
| Veto HV Monitor | 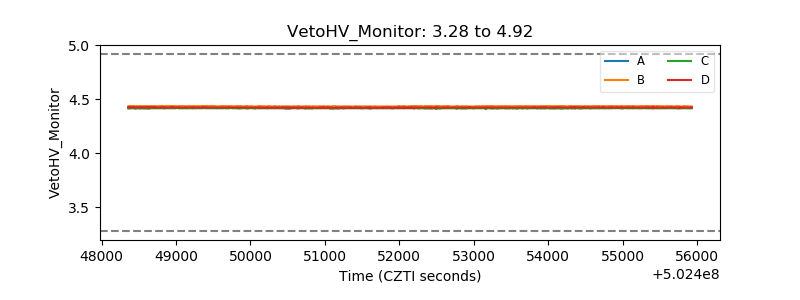 |
| Veto LLD | 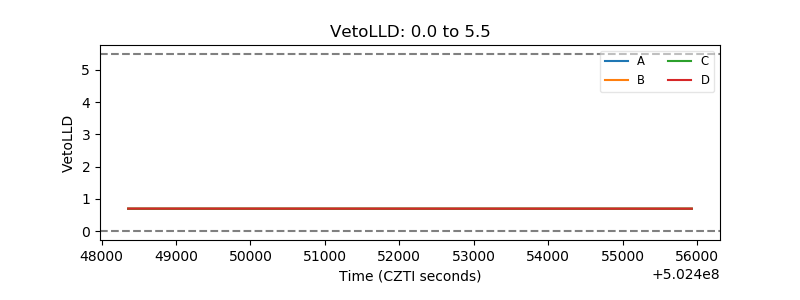 |
| Alpha Counter | 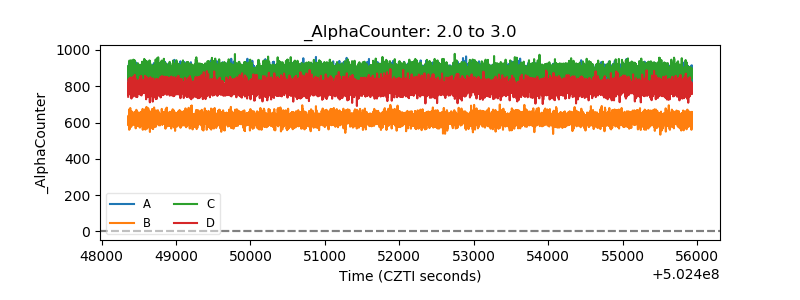 |
| _CPM_Rate | 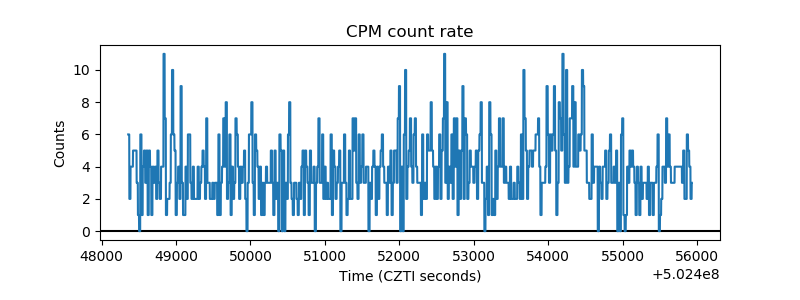 |
| CZT Counter | 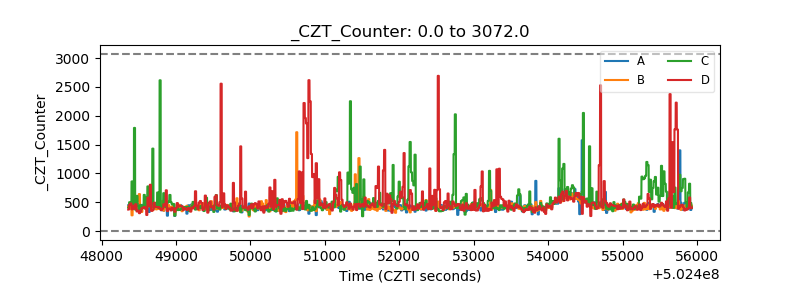 |
| +2.5 Volts monitor |  |
| +5 Volts monitor | 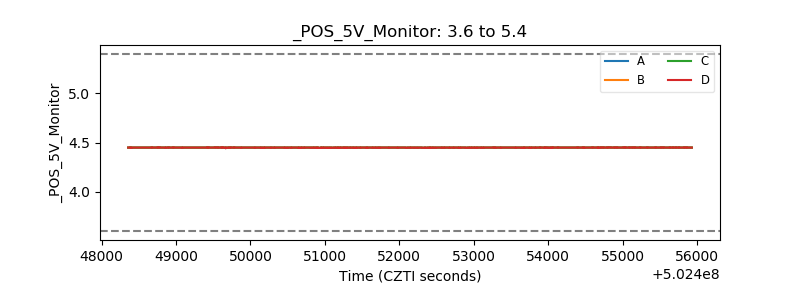 |
| _ROLL_ROT |  |
| _Roll_DEC | 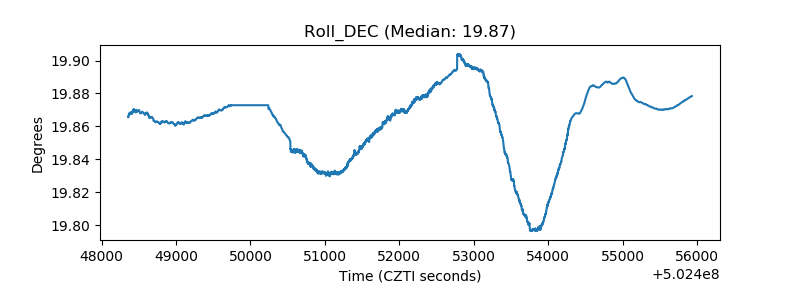 |
| _Roll_RA | 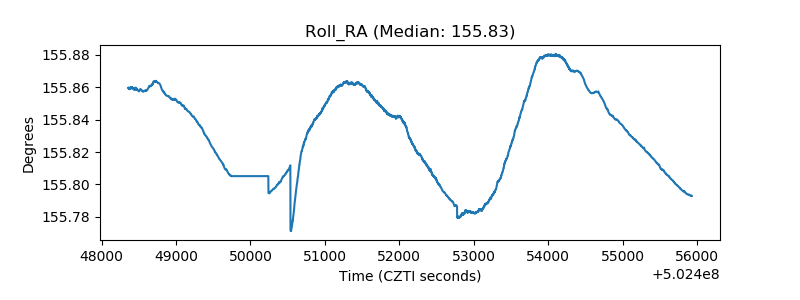 |
| Veto Counter |  |