| Param | Original file | Final file |
|---|---|---|
| Filename | modeM0/AS1A14_025T01_9000006530_55088cztM0_level2.fits | modeM0/AS1A14_025T01_9000006530_55088cztM0_level2_quad_clean.evt |
| Size (bytes) | 436,224,960 | 107,386,560 |
| Size | 416.0 MB | 102.4 MB |
| Events in quadrant A | 3,379,126 | 701,870 |
| Events in quadrant B | 3,400,623 | 756,872 |
| Events in quadrant C | 4,408,110 | 660,566 |
| Events in quadrant D | 4,375,527 | 609,672 |
| Mode M0 | |||
|---|---|---|---|
| Quadrant | BADHDUFLAG | Total packets | Discarded packets |
| A | 0 | 16361 | 689 |
| B | 0 | 16250 | 688 |
| C | 0 | 19494 | 877 |
| D | 0 | 19182 | 891 |
| Mode SS | |||
|---|---|---|---|
| Quadrant | BADHDUFLAG | Total packets | Discarded packets |
| A | 0 | 158 | 8 |
| B | 0 | 158 | 8 |
| C | 0 | 158 | 6 |
| D | 0 | 158 | 6 |
| Quadrant | Total seconds | Saturated seconds | Saturation percentage |
|---|---|---|---|
| A | 7516 | 26 | 0.345929% |
| B | 7510 | 6 | 0.079893% |
| C | 7499 | 110 | 1.466862% |
| D | 7506 | 215 | 2.864375% |
Noise dominated data is calculated using 1-second bins in cleaned event files. If a bin has >2000 counts, and if more than 50% of those come from <1% of pixels, then it is considered to be noise-dominated and hence unusable.
| Quadrant | # 1 sec bins | Bins with >0 counts | Bins with >2000 counts | High rate bins dominated by noise | Noise dominated (total time) | Noise dominated (detector-on time) | Marked lightcurve |
|---|---|---|---|---|---|---|---|
| A | 7717 | 7575 | 23 | 23 | 0.30% | 0.30% | 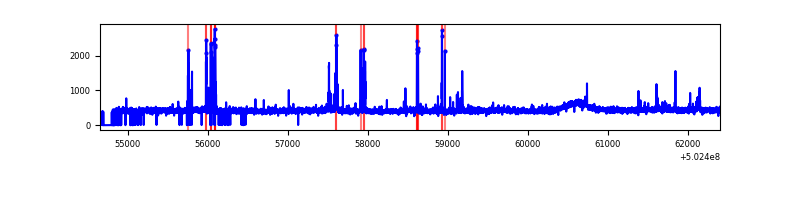 |
| B | 7746 | 7590 | 4 | 4 | 0.05% | 0.05% | 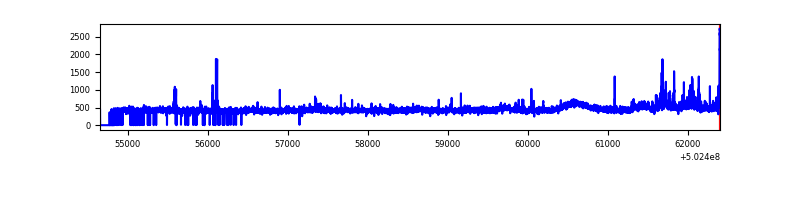 |
| C | 7669 | 7570 | 111 | 111 | 1.45% | 1.47% | 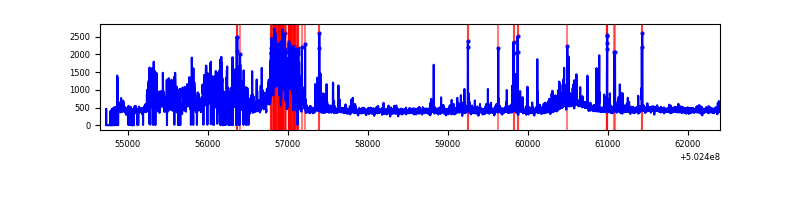 |
| D | 7734 | 7575 | 235 | 235 | 3.04% | 3.10% | 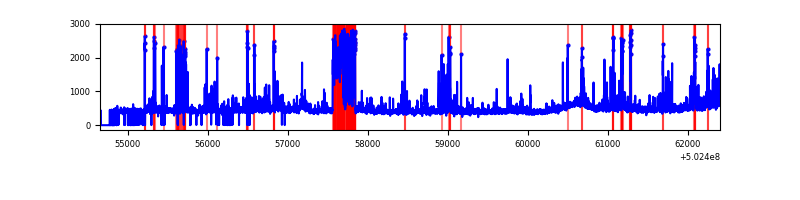 |
Top three noisy pixels from each quadrant. If the there are fewer than three noisy pixels in the level2.evt file, extra rows are filled as -1
| Pixel properties | Quadrant properties | ||||||
|---|---|---|---|---|---|---|---|
| Quadrant | DetID | PixID | Counts | Sigma | Mean | Median | Sigma |
| A | 0 | 8 | 120711 | 600.67 | 808 | 788 | 199.6 |
| A | 3 | 61 | 63706 | 315.14 | 808 | 788 | 199.6 |
| A | 4 | 3 | 33038 | 161.53 | 808 | 788 | 199.6 |
| B | 7 | 0 | 112566 | 651.5 | 796 | 766 | 171.6 |
| B | 5 | 185 | 78888 | 455.24 | 796 | 766 | 171.6 |
| B | 10 | 247 | 27608 | 156.42 | 796 | 766 | 171.6 |
| C | 9 | 38 | 863963 | 4068.55 | 780 | 774 | 212.2 |
| C | 14 | 254 | 164548 | 771.93 | 780 | 774 | 212.2 |
| C | 6 | 223 | 106792 | 499.7 | 780 | 774 | 212.2 |
| D | 15 | 94 | 401706 | 1839.01 | 774 | 741 | 218.0 |
| D | 9 | 1 | 140851 | 642.61 | 774 | 741 | 218.0 |
| D | 2 | 31 | 123986 | 565.26 | 774 | 741 | 218.0 |
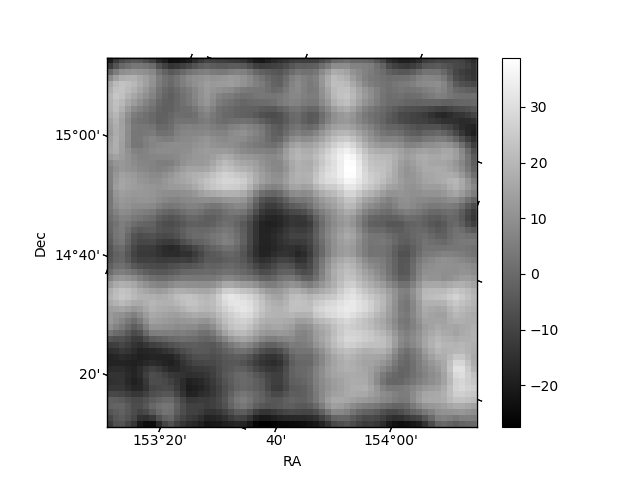
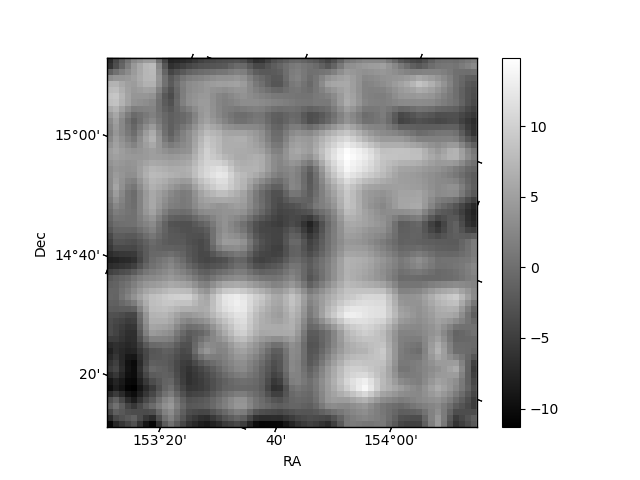
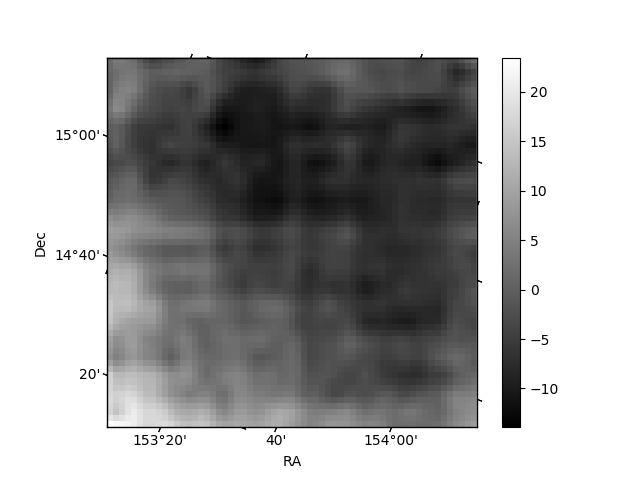
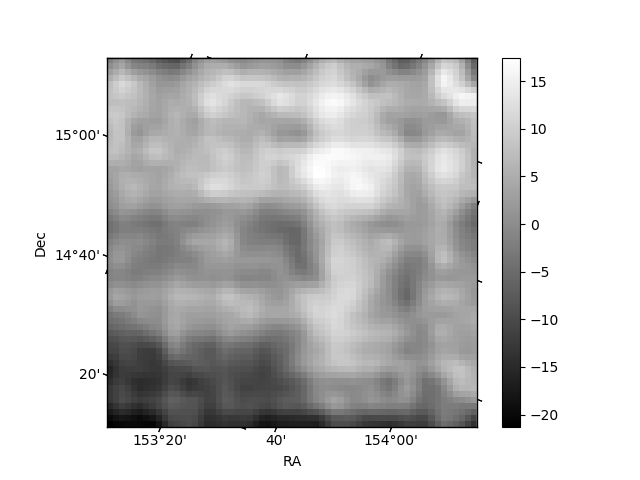
Histogram calculated using DETX and DETY for each event in the final _common_clean file
| Quadrant A | 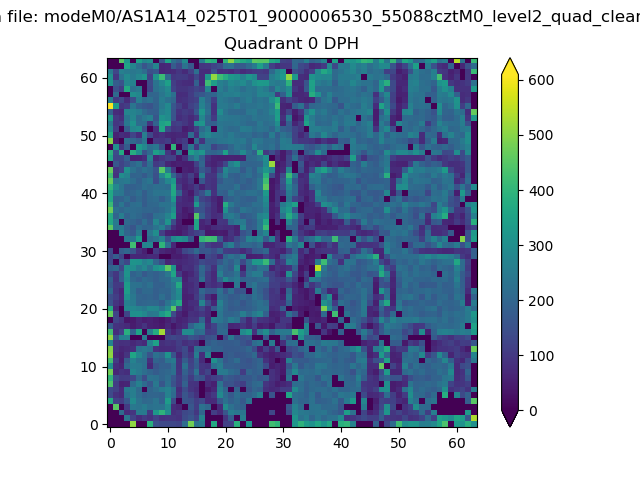 |
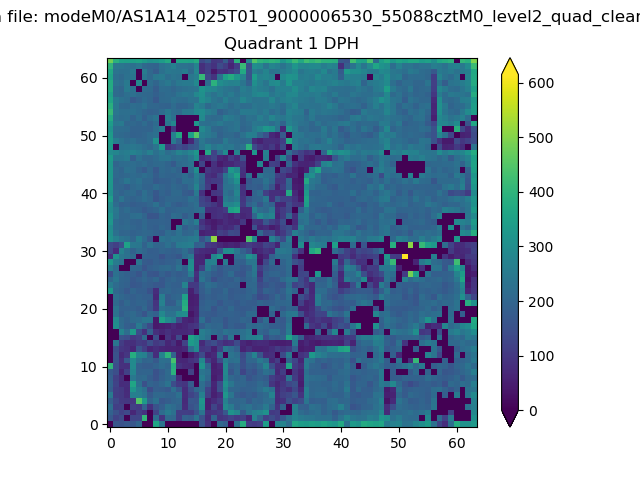 |
Quadrant B |
|---|---|---|---|
| Quadrant D | 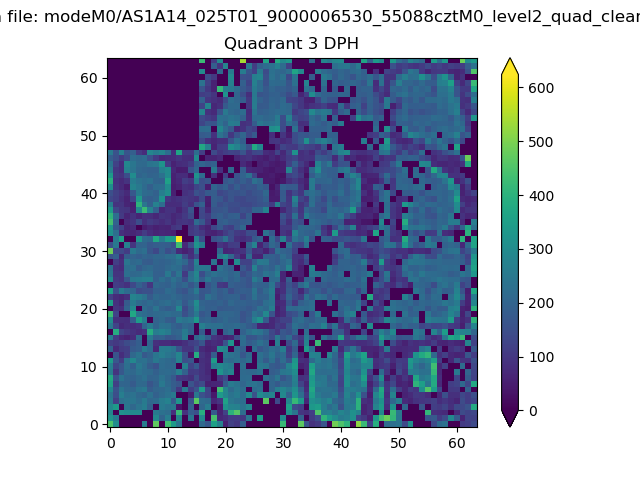 |
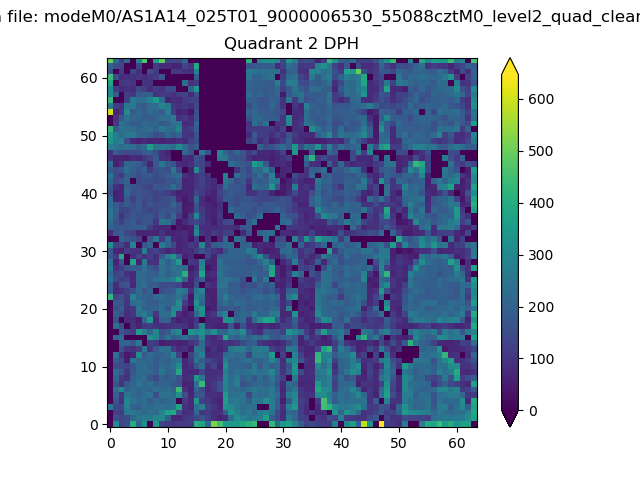 |
Quadrant C |
| Plot type | Count rate plots | Images |
|---|---|---|
| Comparison with Poisson distribution Blue bars denote a histogram of data divided into 1 sec bins. Red curve is a Poisson curve with rate = median count rate of data. |
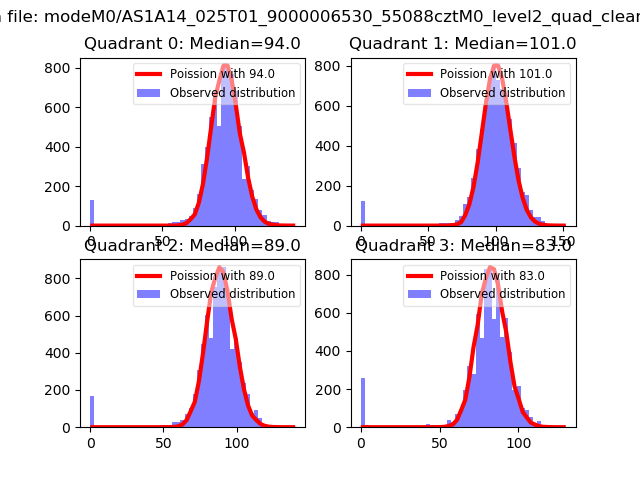 |
 |
| Quadrant-wise count rates Data is divided into 100 sec bins |
 |
|
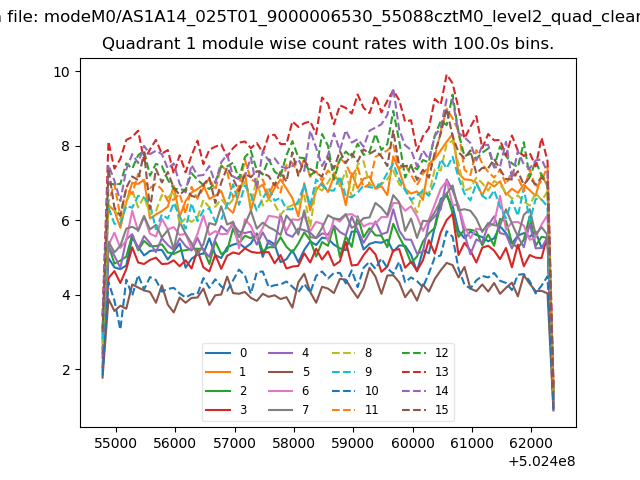
| Module-wise count rates for Quadrant A Data is divided into 100 sec bins |
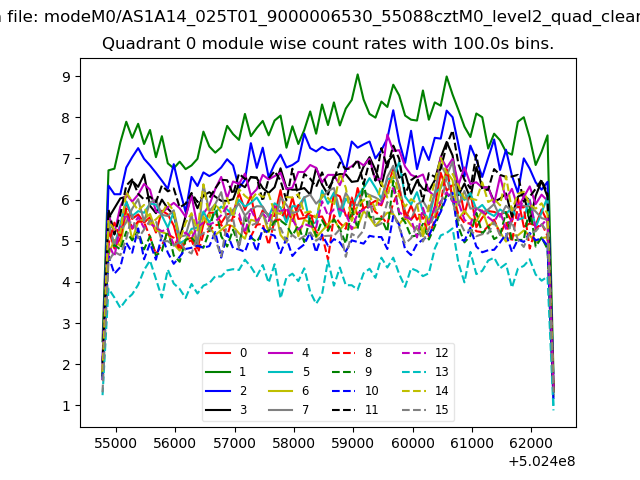 |
 |
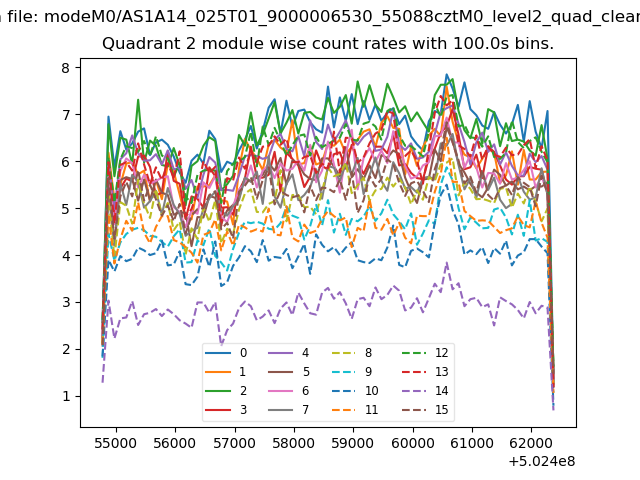
| Module-wise count rates for Quadrant B Data is divided into 100 sec bins |
 |
 |
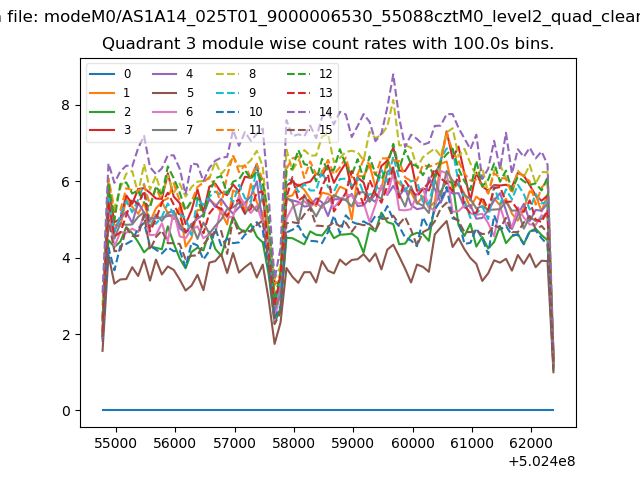
| Module-wise count rates for Quadrant C Data is divided into 100 sec bins |
 |
 |
| Module-wise count rates for Quadrant D Data is divided into 100 sec bins |
 |
 |
| Parameter | Plot |
|---|---|
| CZT HV Monitor |  |
| D_VDD | 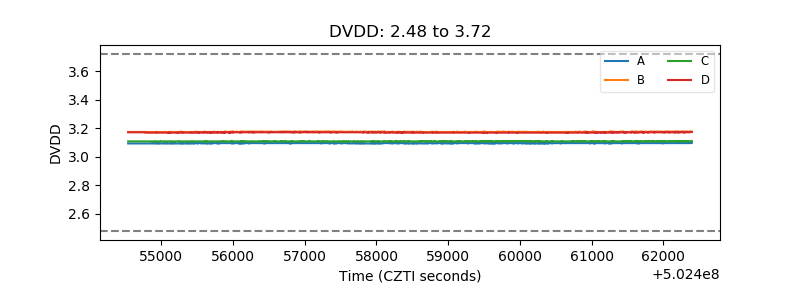 |
| Temperature 1 | 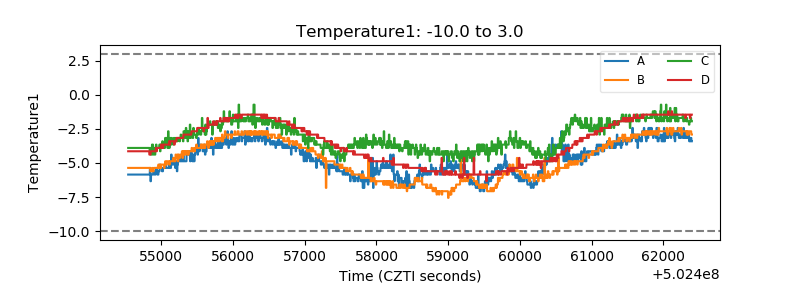 |
| Veto HV Monitor | 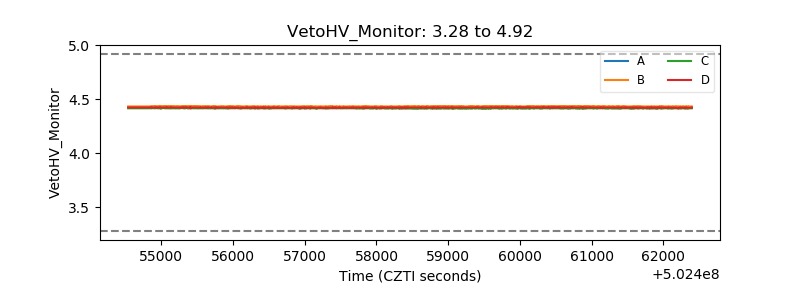 |
| Veto LLD | 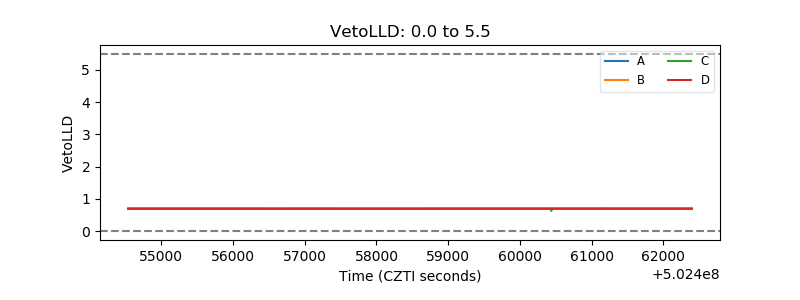 |
| Alpha Counter |  |
| _CPM_Rate | 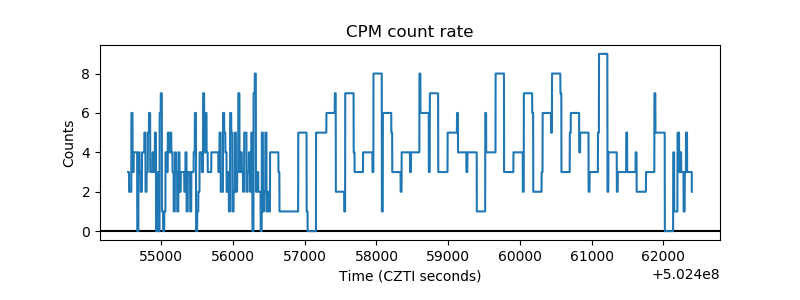 |
| CZT Counter | 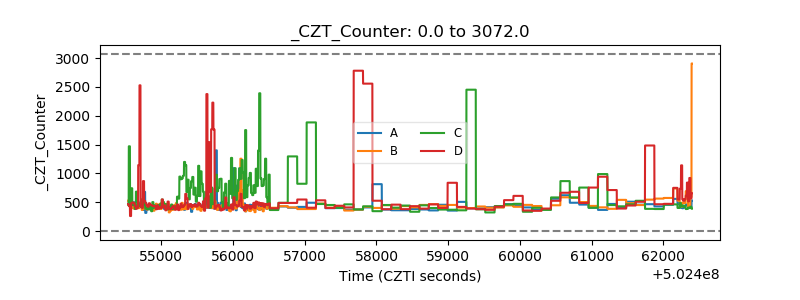 |
| +2.5 Volts monitor |  |
| +5 Volts monitor |  |
| _ROLL_ROT | 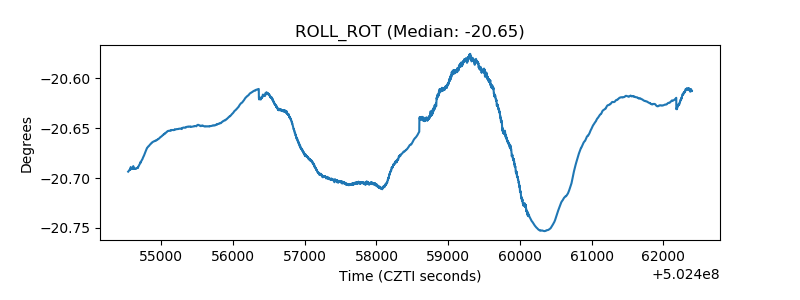 |
| _Roll_DEC | 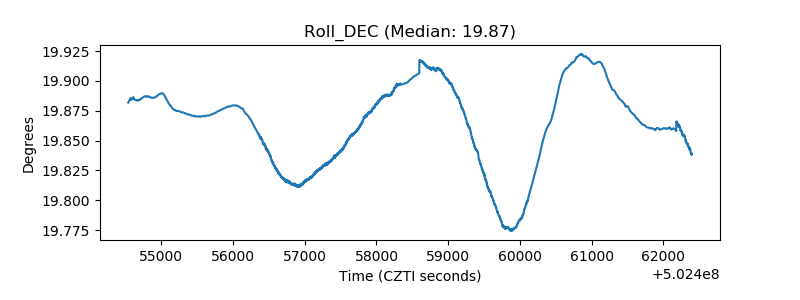 |
| _Roll_RA | 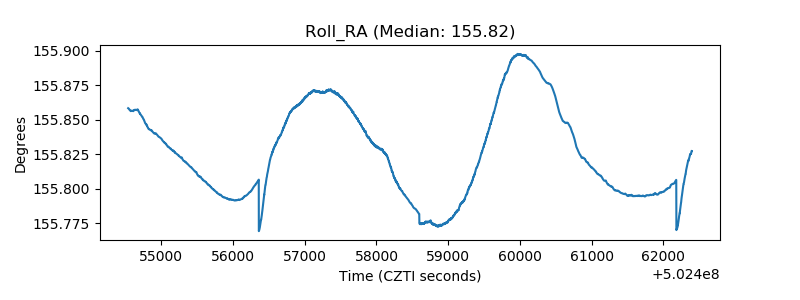 |
| Veto Counter | 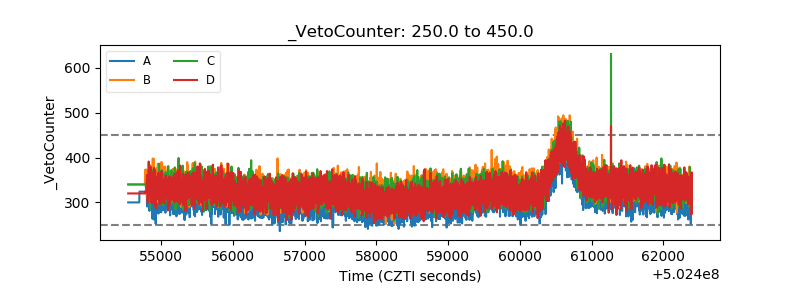 |