| Param | Original file | Final file |
|---|---|---|
| Filename | modeM0/AS1A14_025T01_9000006530_55093cztM0_level2.fits | modeM0/AS1A14_025T01_9000006530_55093cztM0_level2_quad_clean.evt |
| Size (bytes) | 440,429,760 | 100,416,960 |
| Size | 420.0 MB | 95.8 MB |
| Events in quadrant A | 2,936,824 | 680,512 |
| Events in quadrant B | 2,992,610 | 715,425 |
| Events in quadrant C | 4,397,640 | 614,100 |
| Events in quadrant D | 5,466,300 | 573,452 |
| Mode M0 | |||
|---|---|---|---|
| Quadrant | BADHDUFLAG | Total packets | Discarded packets |
| A | 0 | 13613 | 11 |
| B | 0 | 13809 | 10 |
| C | 0 | 17658 | 28 |
| D | 0 | 20826 | 46 |
| Mode SS | |||
|---|---|---|---|
| Quadrant | BADHDUFLAG | Total packets | Discarded packets |
| A | 0 | 132 | 0 |
| B | 0 | 132 | 0 |
| C | 0 | 132 | 0 |
| D | 0 | 132 | 0 |
| Mode M9 | |||
|---|---|---|---|
| Quadrant | BADHDUFLAG | Total packets | Discarded packets |
| A | 0 | 10 | 0 |
| B | 0 | 10 | 0 |
| C | 0 | 10 | 0 |
| D | 0 | 10 | 0 |
| Quadrant | Total seconds | Saturated seconds | Saturation percentage |
|---|---|---|---|
| A | 6562 | 24 | 0.365742% |
| B | 6562 | 42 | 0.640049% |
| C | 6558 | 251 | 3.827386% |
| D | 6557 | 539 | 8.220223% |
Noise dominated data is calculated using 1-second bins in cleaned event files. If a bin has >2000 counts, and if more than 50% of those come from <1% of pixels, then it is considered to be noise-dominated and hence unusable.
| Quadrant | # 1 sec bins | Bins with >0 counts | Bins with >2000 counts | High rate bins dominated by noise | Noise dominated (total time) | Noise dominated (detector-on time) | Marked lightcurve |
|---|---|---|---|---|---|---|---|
| A | 7507 | 6568 | 2 | 2 | 0.03% | 0.03% | 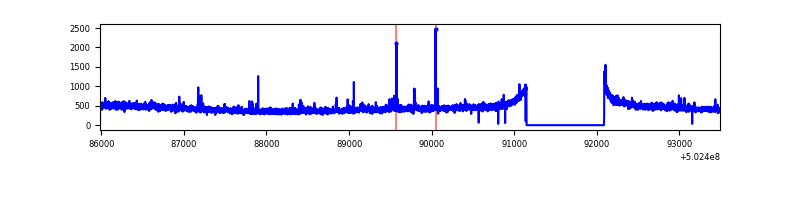 |
| B | 7506 | 6567 | 5 | 5 | 0.07% | 0.08% | 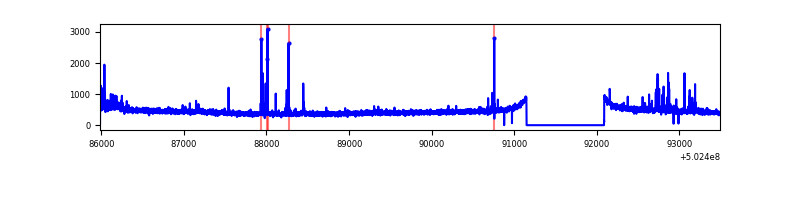 |
| C | 7507 | 6568 | 176 | 176 | 2.34% | 2.68% | 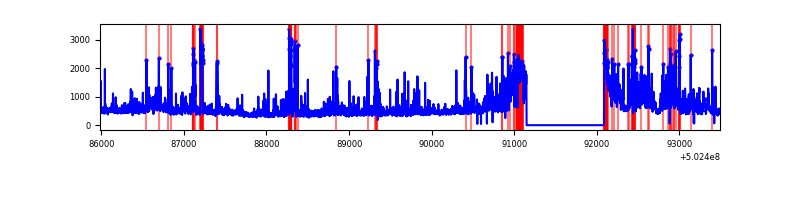 |
| D | 7507 | 6568 | 539 | 539 | 7.18% | 8.21% | 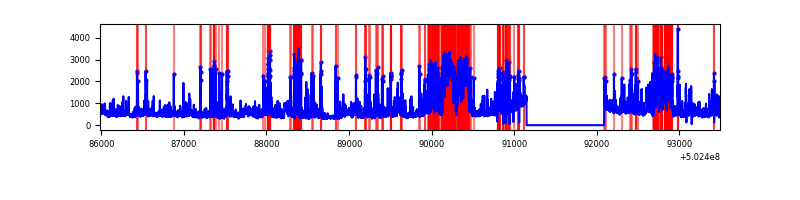 |
Top three noisy pixels from each quadrant. If the there are fewer than three noisy pixels in the level2.evt file, extra rows are filled as -1
| Pixel properties | Quadrant properties | ||||||
|---|---|---|---|---|---|---|---|
| Quadrant | DetID | PixID | Counts | Sigma | Mean | Median | Sigma |
| A | 4 | 3 | 41520 | 223.13 | 728 | 711 | 182.9 |
| A | 3 | 61 | 27566 | 146.84 | 728 | 711 | 182.9 |
| A | 7 | 160 | 20975 | 110.8 | 728 | 711 | 182.9 |
| B | 5 | 185 | 39612 | 248.68 | 717 | 692 | 156.5 |
| B | 5 | 172 | 35188 | 220.41 | 717 | 692 | 156.5 |
| B | 4 | 21 | 33484 | 209.53 | 717 | 692 | 156.5 |
| C | 3 | 242 | 746486 | 3847.11 | 696 | 689 | 193.9 |
| C | 13 | 3 | 273442 | 1406.97 | 696 | 689 | 193.9 |
| C | 6 | 223 | 186678 | 959.4 | 696 | 689 | 193.9 |
| D | 15 | 94 | 1267539 | 6416.9 | 683 | 652 | 197.4 |
| D | 6 | 239 | 432392 | 2186.8 | 683 | 652 | 197.4 |
| D | 3 | 12 | 341344 | 1725.64 | 683 | 652 | 197.4 |
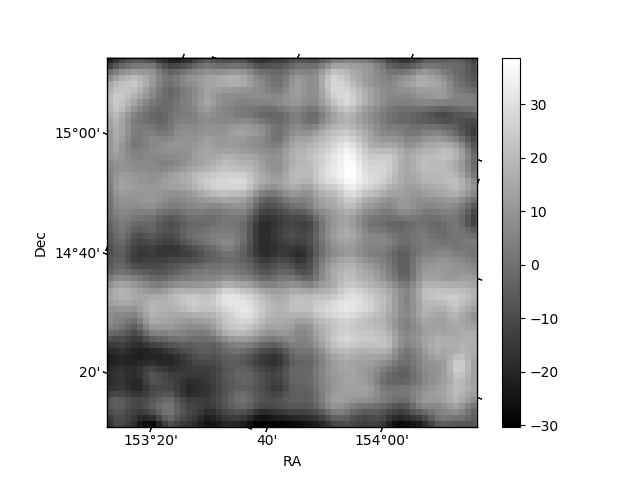
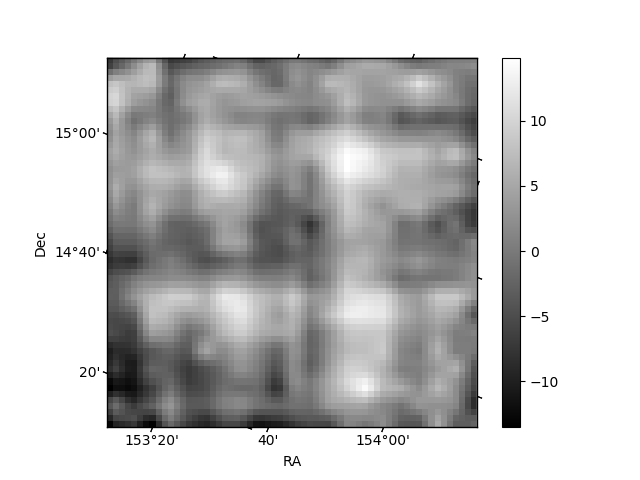
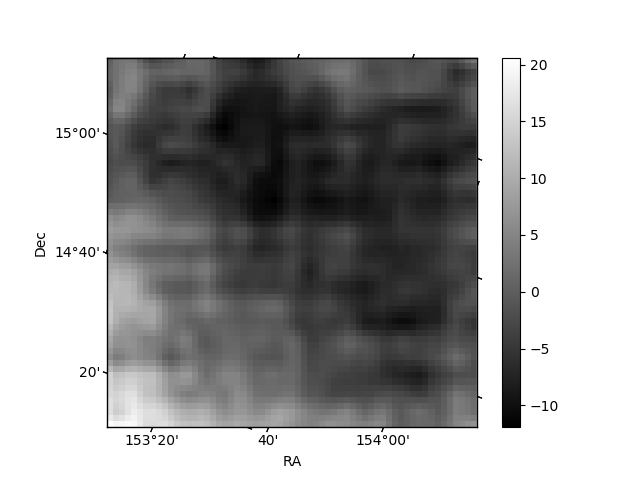
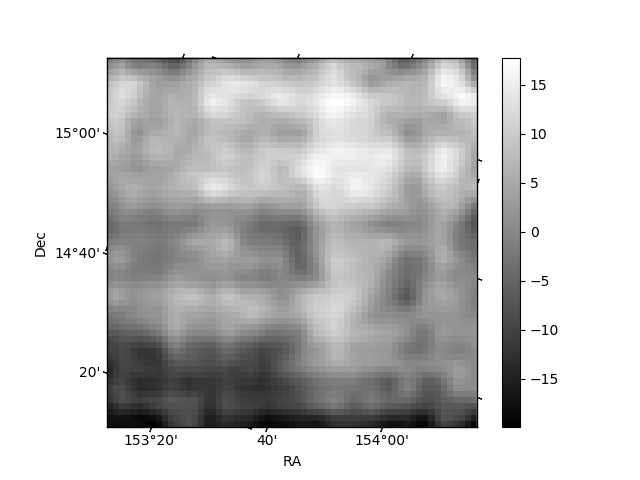
Histogram calculated using DETX and DETY for each event in the final _common_clean file
| Quadrant A | 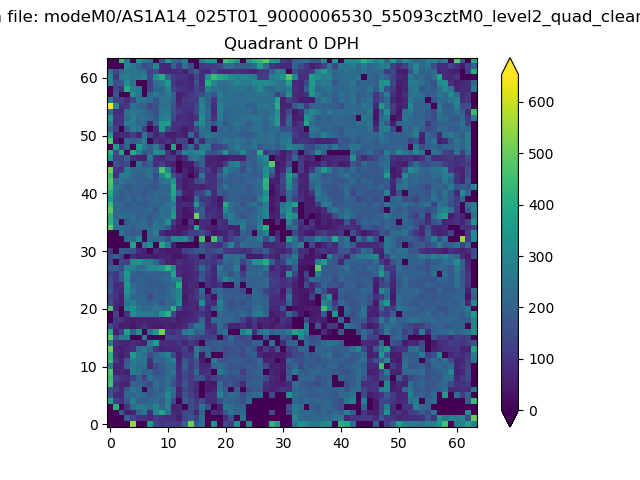 |
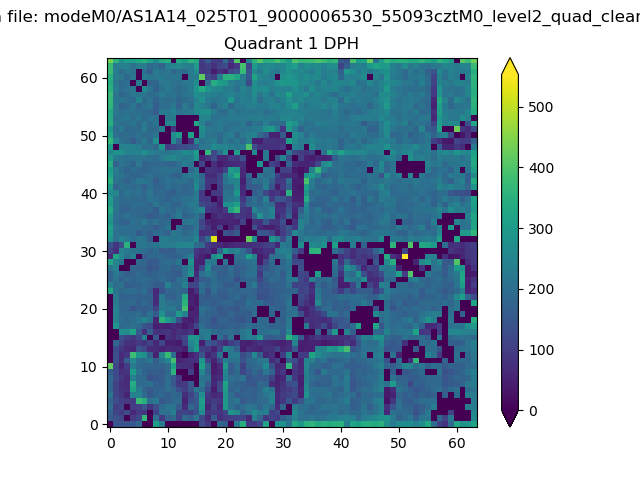 |
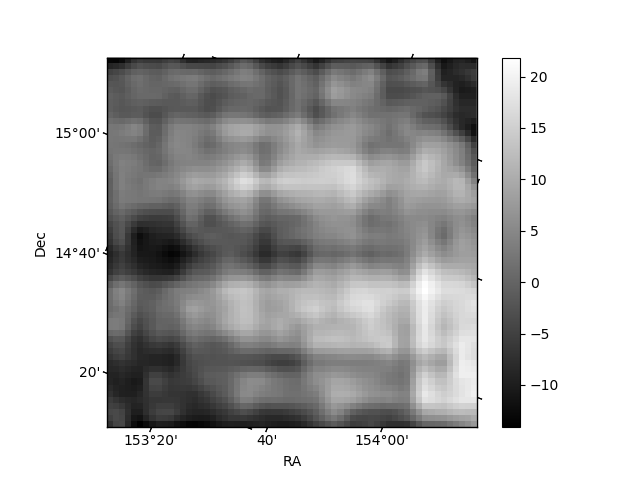
Quadrant B |
|---|---|---|---|
| Quadrant D | 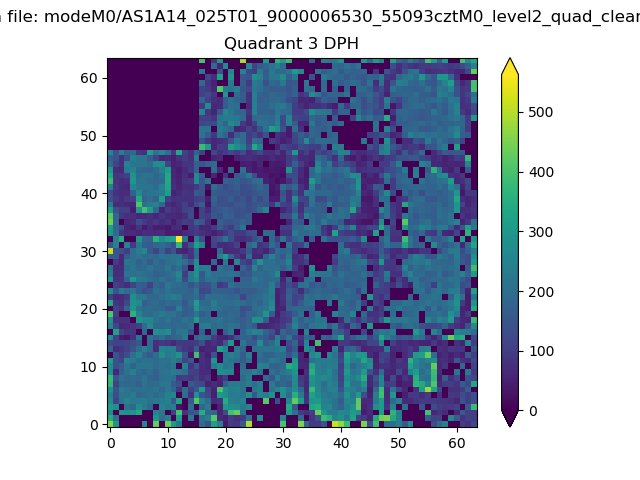 |
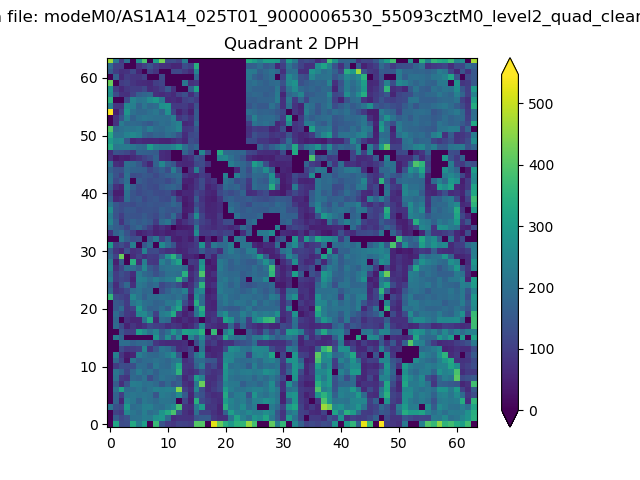 |
Quadrant C |
| Plot type | Count rate plots | Images |
|---|---|---|
| Comparison with Poisson distribution Blue bars denote a histogram of data divided into 1 sec bins. Red curve is a Poisson curve with rate = median count rate of data. |
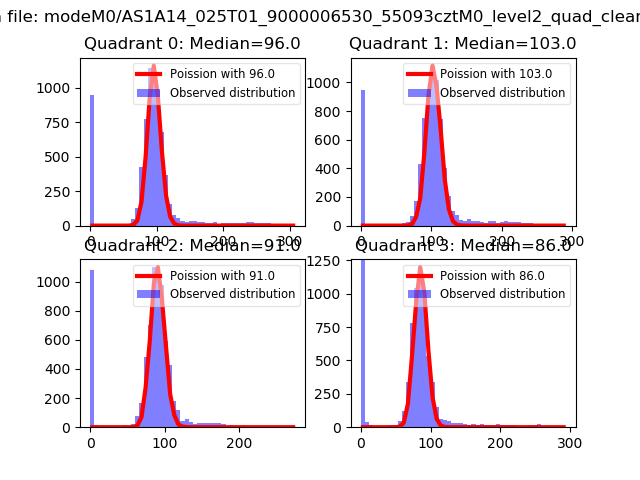 |
 |
| Quadrant-wise count rates Data is divided into 100 sec bins |
 |
|
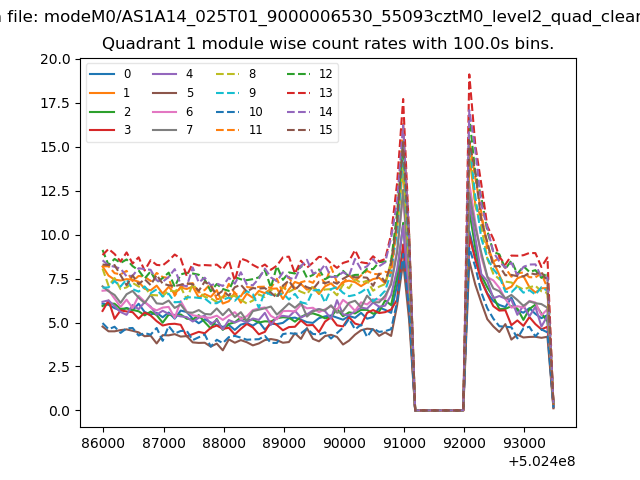
| Module-wise count rates for Quadrant A Data is divided into 100 sec bins |
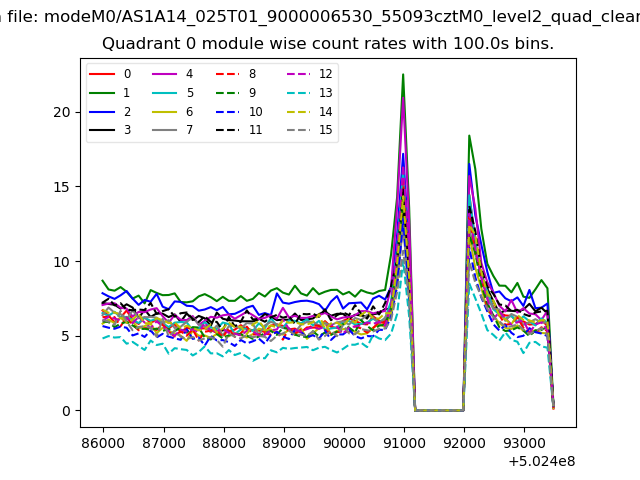 |
 |
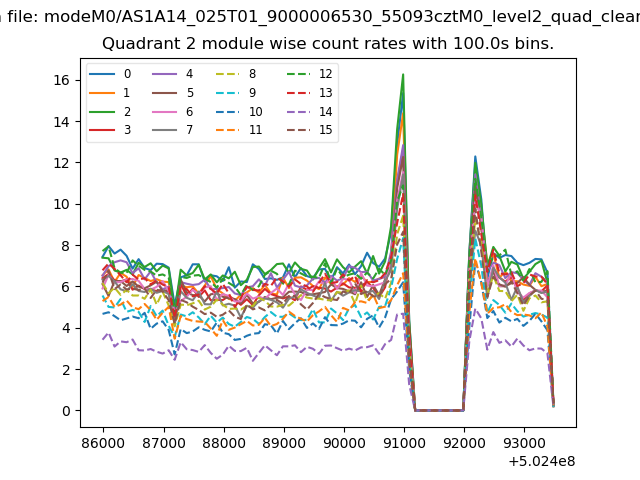
| Module-wise count rates for Quadrant B Data is divided into 100 sec bins |
 |
 |
| Module-wise count rates for Quadrant C Data is divided into 100 sec bins |
 |
 |
| Module-wise count rates for Quadrant D Data is divided into 100 sec bins |
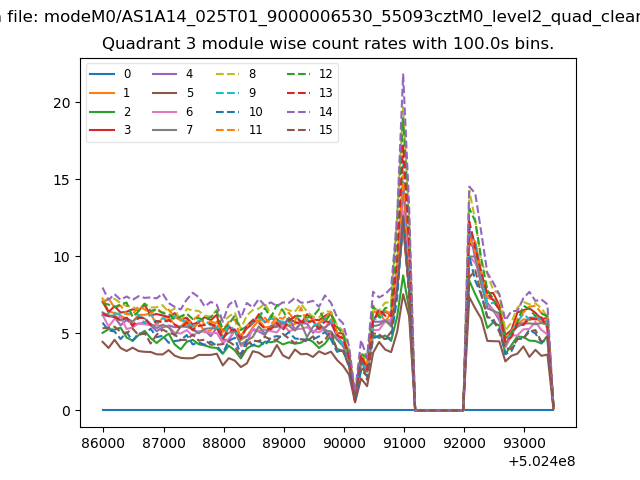 |
 |
| Parameter | Plot |
|---|---|
| CZT HV Monitor | 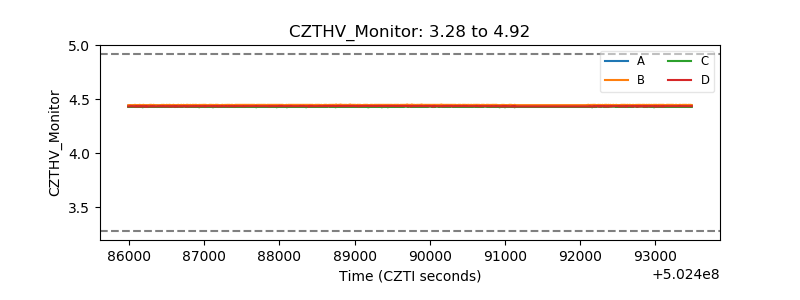 |
| D_VDD | 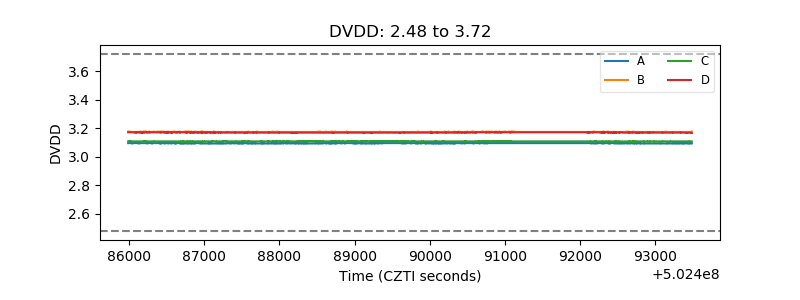 |
| Temperature 1 | 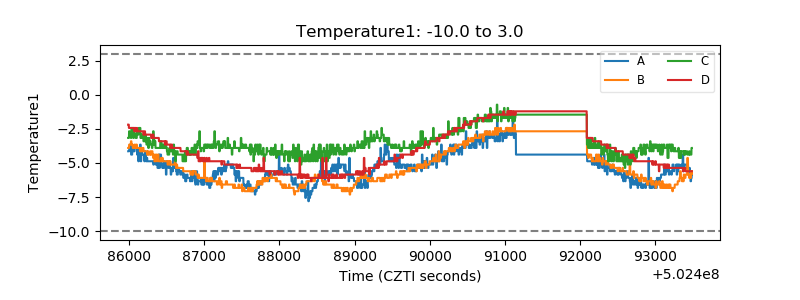 |
| Veto HV Monitor |  |
| Veto LLD | 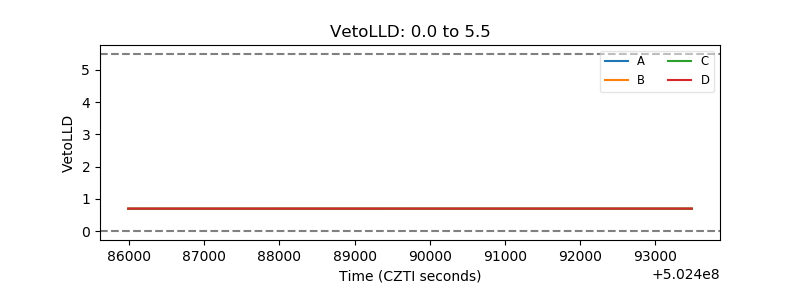 |
| Alpha Counter | 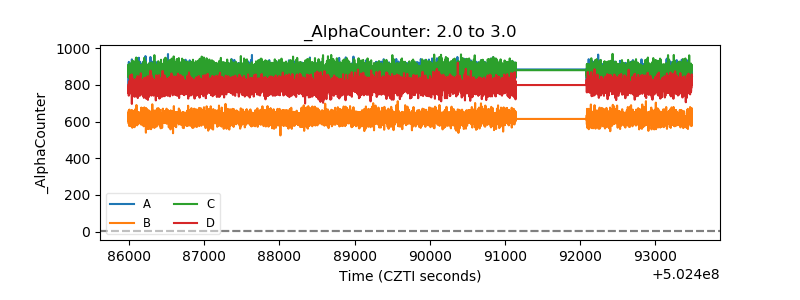 |
| _CPM_Rate | 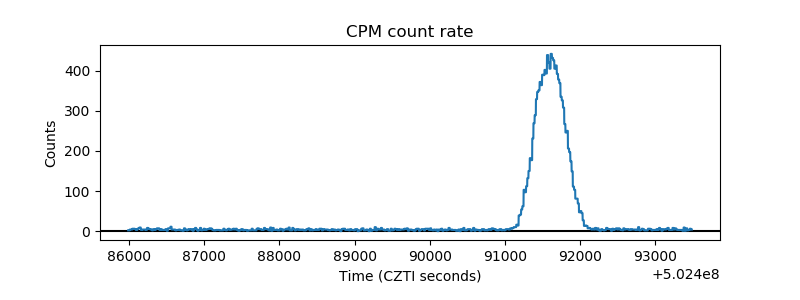 |
| CZT Counter | 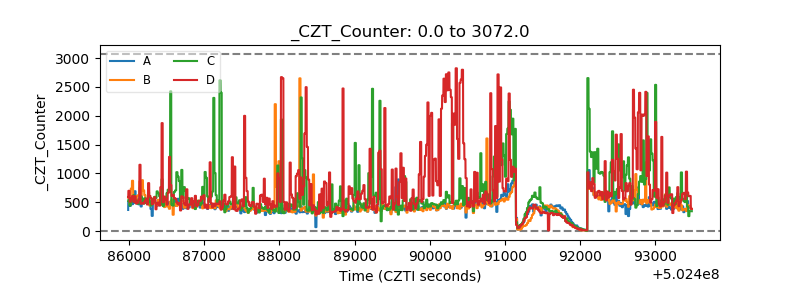 |
| +2.5 Volts monitor |  |
| +5 Volts monitor |  |
| _ROLL_ROT | 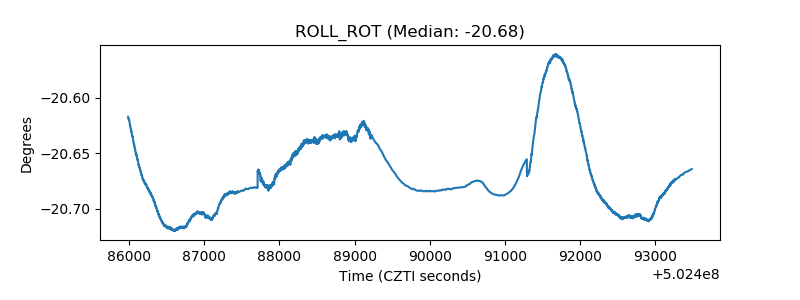 |
| _Roll_DEC |  |
| _Roll_RA | 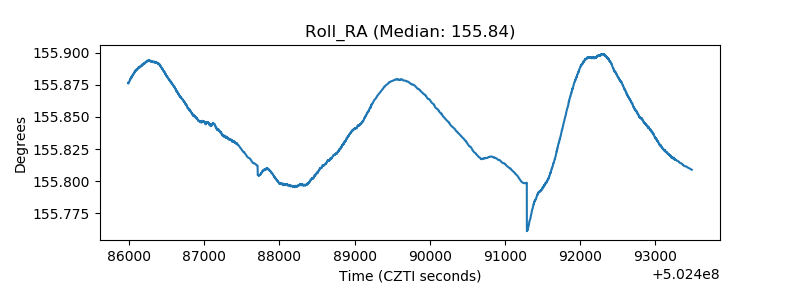 |
| Veto Counter | 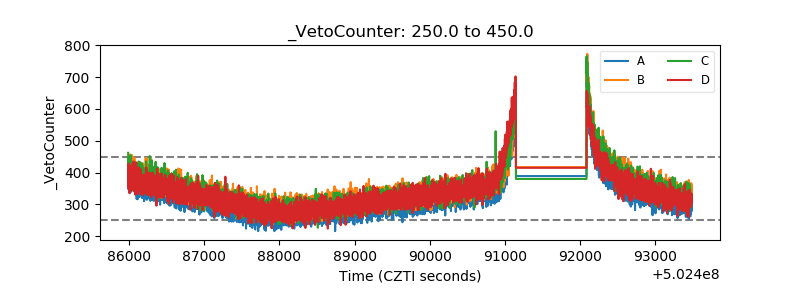 |