| Param | Original file | Final file |
|---|---|---|
| Filename | modeM0/AS1A14_025T01_9000006530_55095cztM0_level2.fits | modeM0/AS1A14_025T01_9000006530_55095cztM0_level2_quad_clean.evt |
| Size (bytes) | 474,367,680 | 99,164,160 |
| Size | 452.4 MB | 94.6 MB |
| Events in quadrant A | 2,930,828 | 669,292 |
| Events in quadrant B | 3,105,874 | 716,623 |
| Events in quadrant C | 4,865,051 | 618,696 |
| Events in quadrant D | 6,152,162 | 544,064 |
| Mode M0 | |||
|---|---|---|---|
| Quadrant | BADHDUFLAG | Total packets | Discarded packets |
| A | 0 | 13589 | 6 |
| B | 0 | 14034 | 2 |
| C | 0 | 18985 | 6 |
| D | 0 | 22967 | 9 |
| Mode SS | |||
|---|---|---|---|
| Quadrant | BADHDUFLAG | Total packets | Discarded packets |
| A | 0 | 132 | 0 |
| B | 0 | 132 | 0 |
| C | 0 | 132 | 0 |
| D | 0 | 132 | 0 |
| Mode M9 | |||
|---|---|---|---|
| Quadrant | BADHDUFLAG | Total packets | Discarded packets |
| A | 0 | 11 | 0 |
| B | 0 | 11 | 0 |
| C | 0 | 11 | 0 |
| D | 0 | 11 | 0 |
| Quadrant | Total seconds | Saturated seconds | Saturation percentage |
|---|---|---|---|
| A | 6510 | 30 | 0.460829% |
| B | 6512 | 56 | 0.859951% |
| C | 6511 | 217 | 3.332821% |
| D | 6511 | 780 | 11.979727% |
Noise dominated data is calculated using 1-second bins in cleaned event files. If a bin has >2000 counts, and if more than 50% of those come from <1% of pixels, then it is considered to be noise-dominated and hence unusable.
| Quadrant | # 1 sec bins | Bins with >0 counts | Bins with >2000 counts | High rate bins dominated by noise | Noise dominated (total time) | Noise dominated (detector-on time) | Marked lightcurve |
|---|---|---|---|---|---|---|---|
| A | 7572 | 6513 | 12 | 12 | 0.16% | 0.18% | 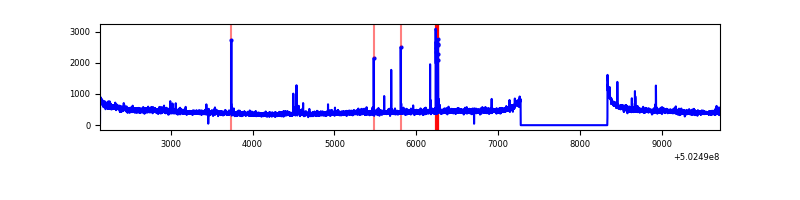 |
| B | 7572 | 6513 | 5 | 5 | 0.07% | 0.08% | 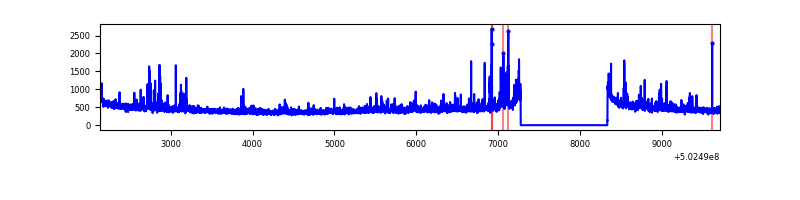 |
| C | 7572 | 6513 | 142 | 142 | 1.88% | 2.18% | 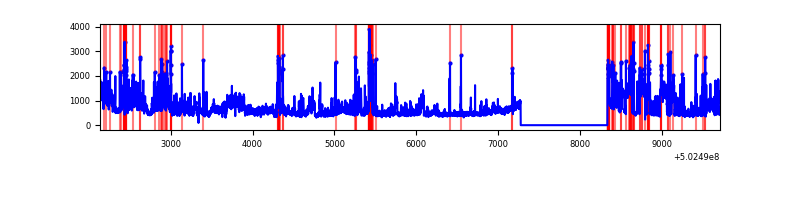 |
| D | 7572 | 6513 | 795 | 795 | 10.50% | 12.21% | 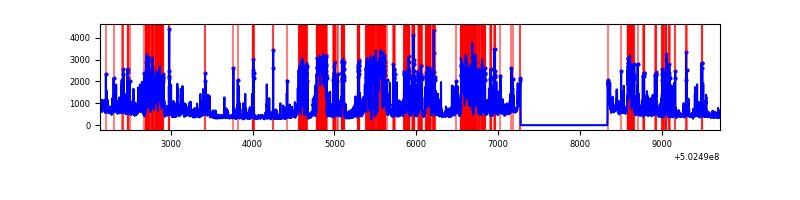 |
Top three noisy pixels from each quadrant. If the there are fewer than three noisy pixels in the level2.evt file, extra rows are filled as -1
| Pixel properties | Quadrant properties | ||||||
|---|---|---|---|---|---|---|---|
| Quadrant | DetID | PixID | Counts | Sigma | Mean | Median | Sigma |
| A | 4 | 3 | 60428 | 332.16 | 720 | 704 | 179.8 |
| A | 8 | 62 | 33303 | 181.3 | 720 | 704 | 179.8 |
| A | 3 | 61 | 25535 | 138.1 | 720 | 704 | 179.8 |
| B | 4 | 21 | 222904 | 1416.65 | 715 | 690 | 156.9 |
| B | 10 | 247 | 23700 | 146.69 | 715 | 690 | 156.9 |
| B | 12 | 111 | 18776 | 115.3 | 715 | 690 | 156.9 |
| C | 3 | 242 | 1400390 | 7309.16 | 692 | 687 | 191.5 |
| C | 6 | 223 | 290353 | 1512.62 | 692 | 687 | 191.5 |
| C | 13 | 3 | 279816 | 1457.59 | 692 | 687 | 191.5 |
| D | 15 | 94 | 2235790 | 11684.58 | 664 | 634 | 191.3 |
| D | 6 | 239 | 570008 | 2976.48 | 664 | 634 | 191.3 |
| D | 9 | 1 | 140280 | 730.02 | 664 | 634 | 191.3 |
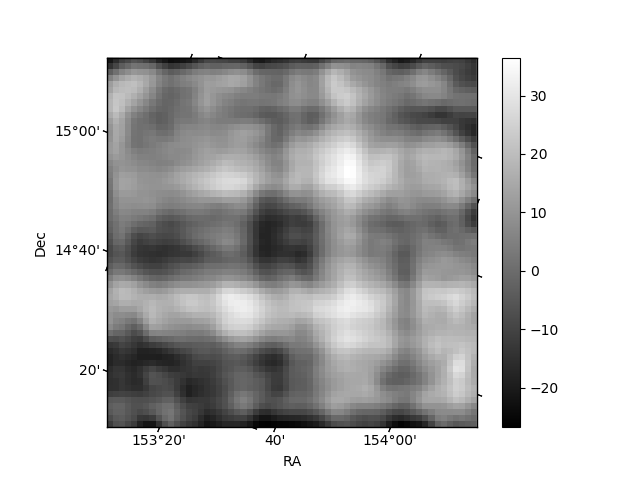
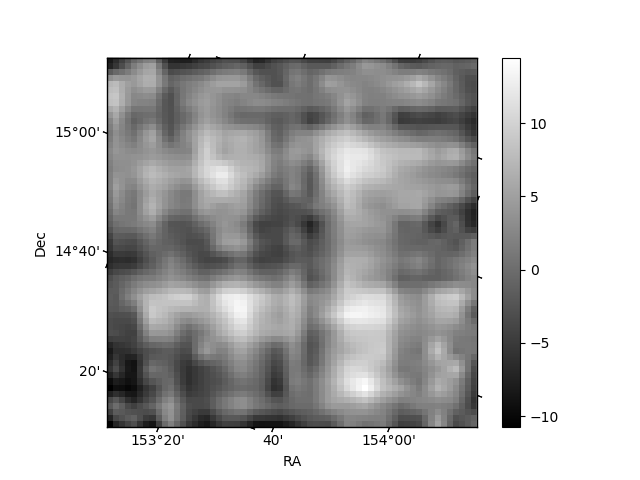
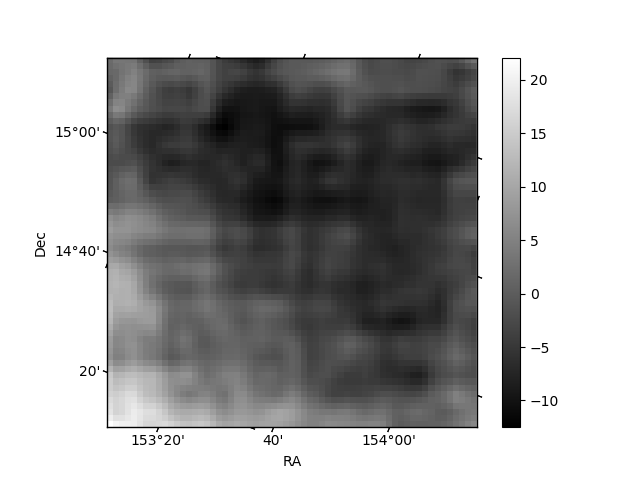
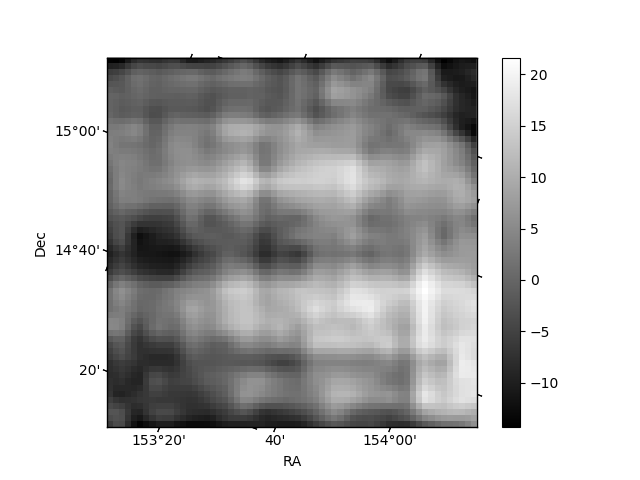
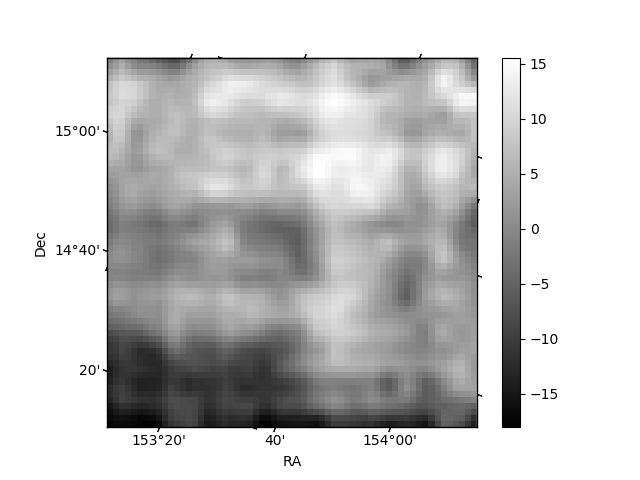
Histogram calculated using DETX and DETY for each event in the final _common_clean file
| Quadrant A | 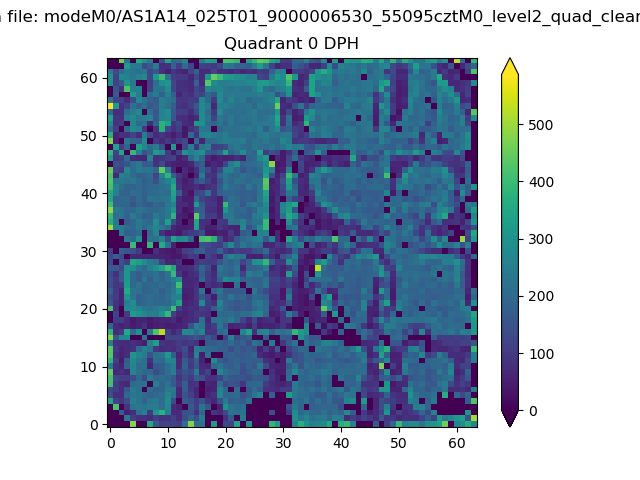 |
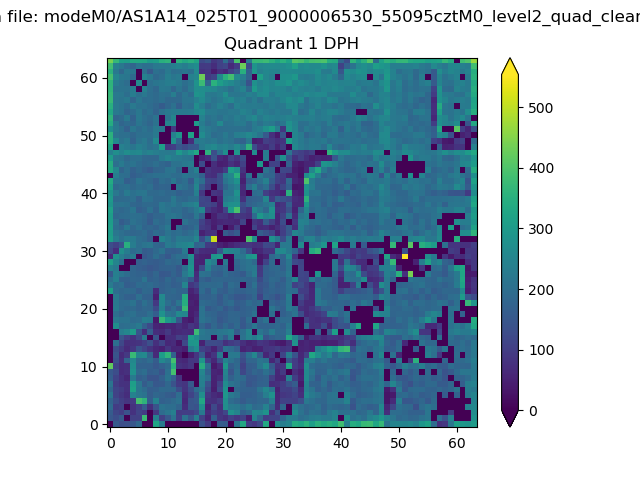 |
Quadrant B |
|---|---|---|---|
| Quadrant D | 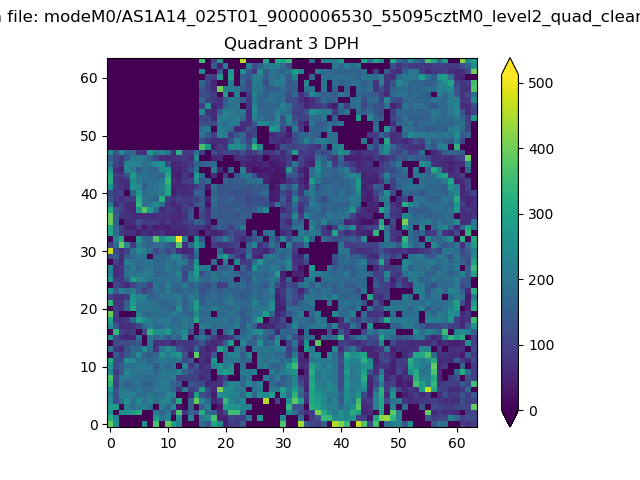 |
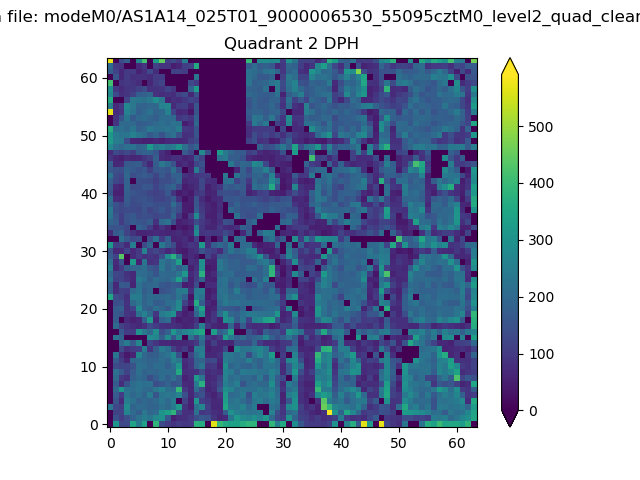 |
Quadrant C |
| Plot type | Count rate plots | Images |
|---|---|---|
| Comparison with Poisson distribution Blue bars denote a histogram of data divided into 1 sec bins. Red curve is a Poisson curve with rate = median count rate of data. |
 |
 |
| Quadrant-wise count rates Data is divided into 100 sec bins |
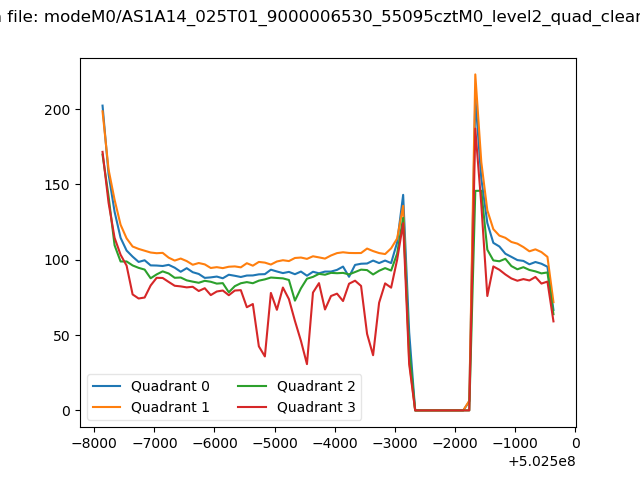 |
|
| Module-wise count rates for Quadrant A Data is divided into 100 sec bins |
 |
 |
| Module-wise count rates for Quadrant B Data is divided into 100 sec bins |
 |
 |
| Module-wise count rates for Quadrant C Data is divided into 100 sec bins |
 |
 |
| Module-wise count rates for Quadrant D Data is divided into 100 sec bins |
 |
 |
| Parameter | Plot |
|---|---|
| CZT HV Monitor |  |
| D_VDD |  |
| Temperature 1 | 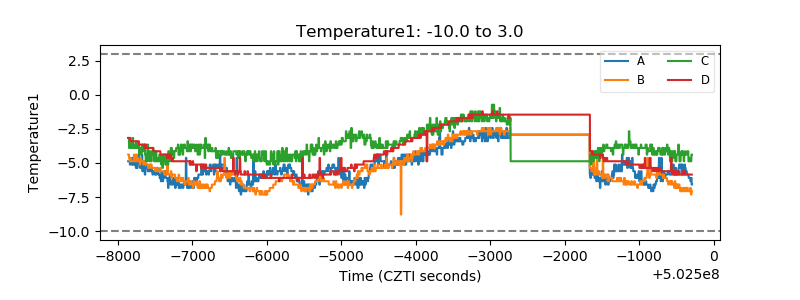 |
| Veto HV Monitor | 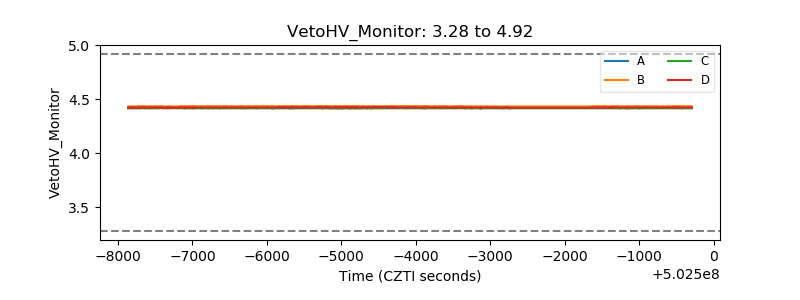 |
| Veto LLD |  |
| Alpha Counter | 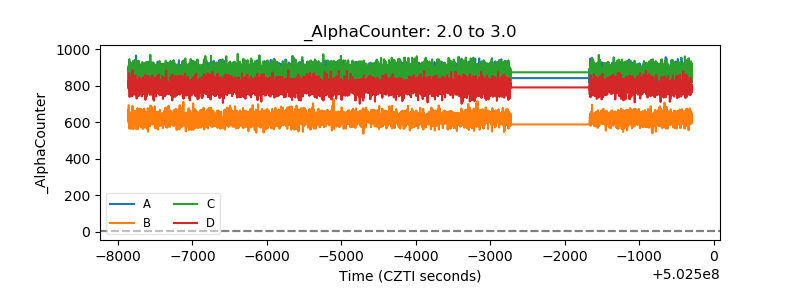 |
| _CPM_Rate | 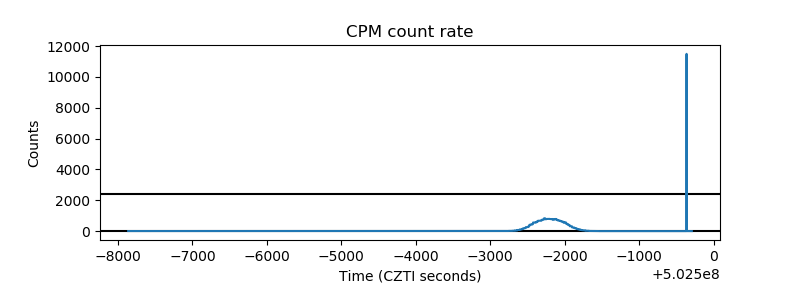 |
| CZT Counter | 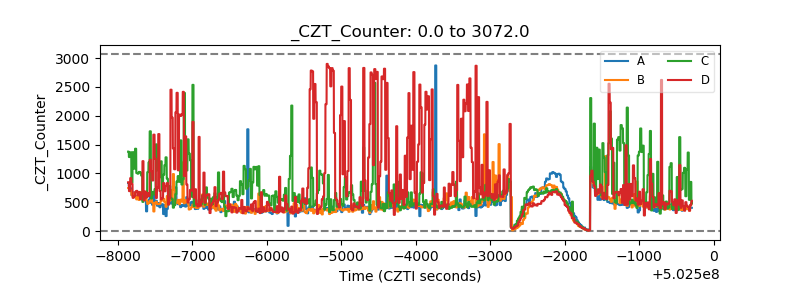 |
| +2.5 Volts monitor |  |
| +5 Volts monitor | 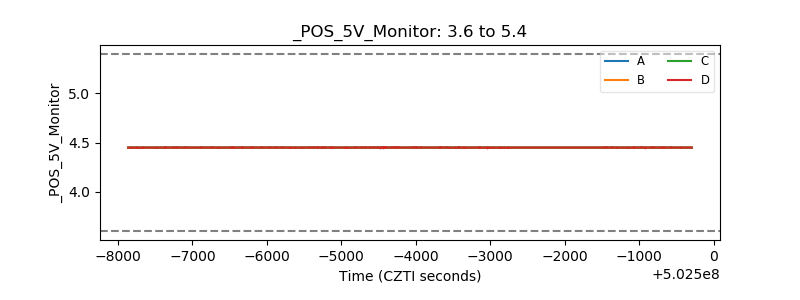 |
| _ROLL_ROT |  |
| _Roll_DEC | 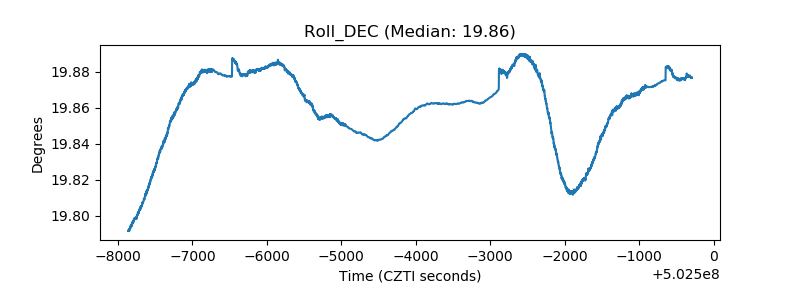 |
| _Roll_RA | 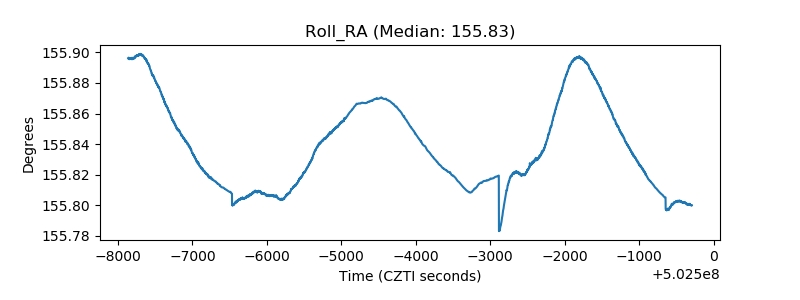 |
| Veto Counter |  |