| Param | Original file | Final file |
|---|---|---|
| Filename | modeM0/AS1A14_025T01_9000006530_55096cztM0_level2.fits | modeM0/AS1A14_025T01_9000006530_55096cztM0_level2_quad_clean.evt |
| Size (bytes) | 446,869,440 | 105,039,360 |
| Size | 426.2 MB | 100.2 MB |
| Events in quadrant A | 3,015,481 | 698,958 |
| Events in quadrant B | 3,239,882 | 751,932 |
| Events in quadrant C | 4,751,617 | 654,849 |
| Events in quadrant D | 5,013,661 | 607,295 |
| Mode M0 | |||
|---|---|---|---|
| Quadrant | BADHDUFLAG | Total packets | Discarded packets |
| A | 0 | 14065 | 2 |
| B | 0 | 14513 | 2 |
| C | 0 | 18941 | 2 |
| D | 0 | 19618 | 2 |
| Mode SS | |||
|---|---|---|---|
| Quadrant | BADHDUFLAG | Total packets | Discarded packets |
| A | 0 | 138 | 0 |
| B | 0 | 138 | 0 |
| C | 0 | 138 | 0 |
| D | 0 | 138 | 0 |
| Mode M9 | |||
|---|---|---|---|
| Quadrant | BADHDUFLAG | Total packets | Discarded packets |
| A | 0 | 13 | 0 |
| B | 0 | 13 | 0 |
| C | 0 | 13 | 0 |
| D | 0 | 14 | 0 |
| Quadrant | Total seconds | Saturated seconds | Saturation percentage |
|---|---|---|---|
| A | 6705 | 33 | 0.492170% |
| B | 6705 | 70 | 1.043997% |
| C | 6705 | 228 | 3.400447% |
| D | 6705 | 287 | 4.280388% |
Noise dominated data is calculated using 1-second bins in cleaned event files. If a bin has >2000 counts, and if more than 50% of those come from <1% of pixels, then it is considered to be noise-dominated and hence unusable.
| Quadrant | # 1 sec bins | Bins with >0 counts | Bins with >2000 counts | High rate bins dominated by noise | Noise dominated (total time) | Noise dominated (detector-on time) | Marked lightcurve |
|---|---|---|---|---|---|---|---|
| A | 7850 | 6706 | 6 | 6 | 0.08% | 0.09% | 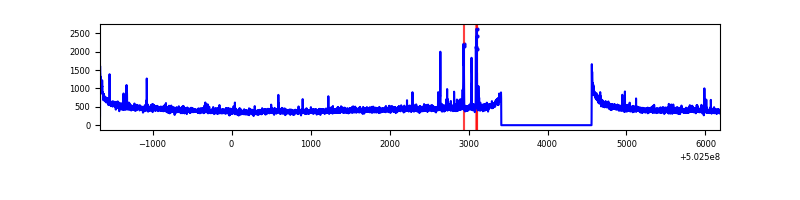 |
| B | 7850 | 6706 | 14 | 14 | 0.18% | 0.21% | 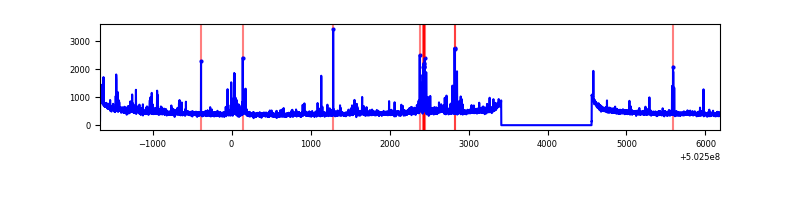 |
| C | 7850 | 6706 | 188 | 188 | 2.39% | 2.80% | 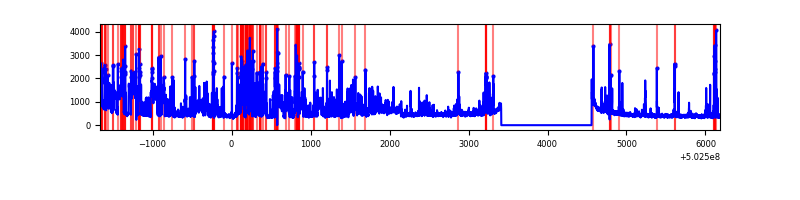 |
| D | 7850 | 6706 | 296 | 296 | 3.77% | 4.41% | 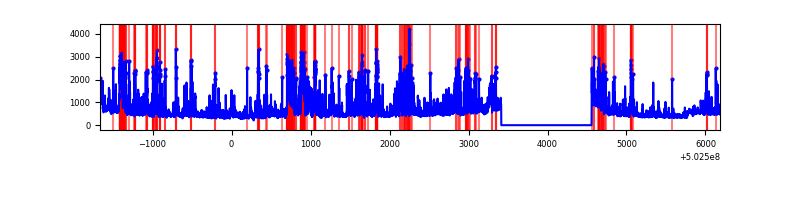 |
Top three noisy pixels from each quadrant. If the there are fewer than three noisy pixels in the level2.evt file, extra rows are filled as -1
| Pixel properties | Quadrant properties | ||||||
|---|---|---|---|---|---|---|---|
| Quadrant | DetID | PixID | Counts | Sigma | Mean | Median | Sigma |
| A | 0 | 8 | 47237 | 251.88 | 742 | 725 | 184.7 |
| A | 4 | 3 | 43614 | 232.26 | 742 | 725 | 184.7 |
| A | 3 | 61 | 39700 | 211.07 | 742 | 725 | 184.7 |
| B | 4 | 21 | 262297 | 1651.29 | 738 | 713 | 158.4 |
| B | 10 | 247 | 19737 | 120.09 | 738 | 713 | 158.4 |
| B | 12 | 111 | 19201 | 116.71 | 738 | 713 | 158.4 |
| C | 3 | 242 | 814131 | 4084.05 | 716 | 709 | 199.2 |
| C | 13 | 3 | 417541 | 2092.84 | 716 | 709 | 199.2 |
| C | 6 | 223 | 380028 | 1904.49 | 716 | 709 | 199.2 |
| D | 15 | 94 | 671262 | 3300.66 | 703 | 670 | 203.2 |
| D | 2 | 249 | 500566 | 2460.49 | 703 | 670 | 203.2 |
| D | 6 | 239 | 331641 | 1629.04 | 703 | 670 | 203.2 |
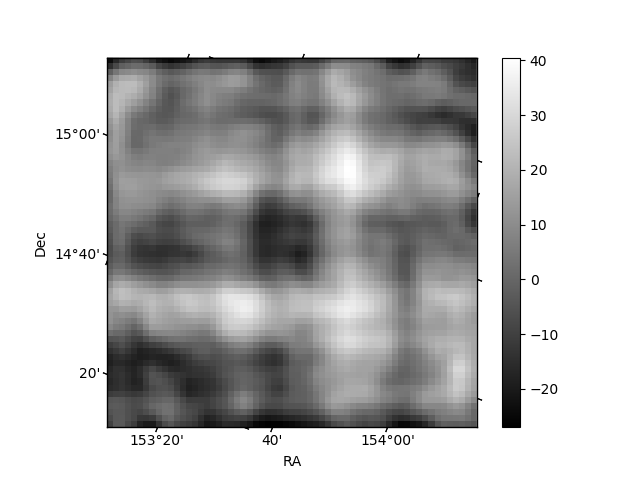
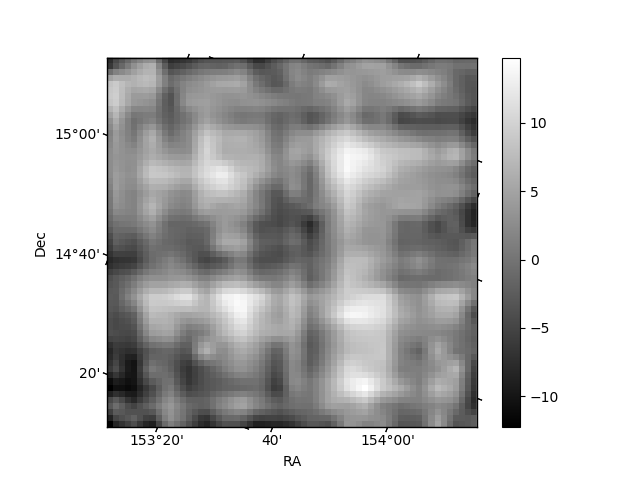
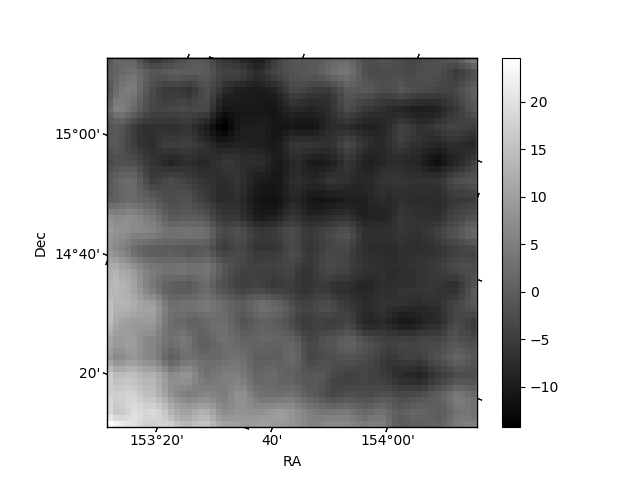
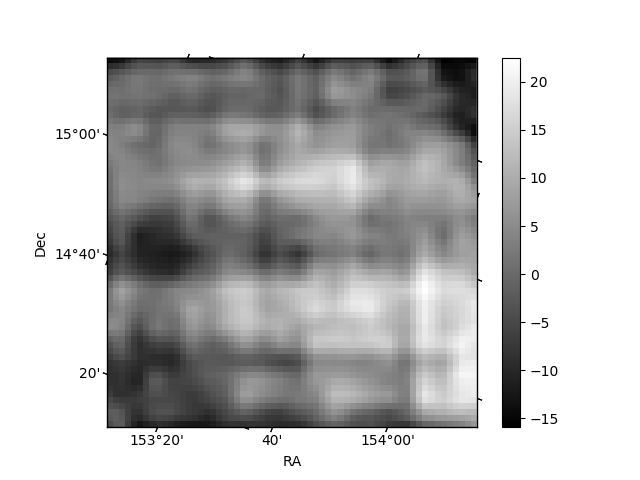
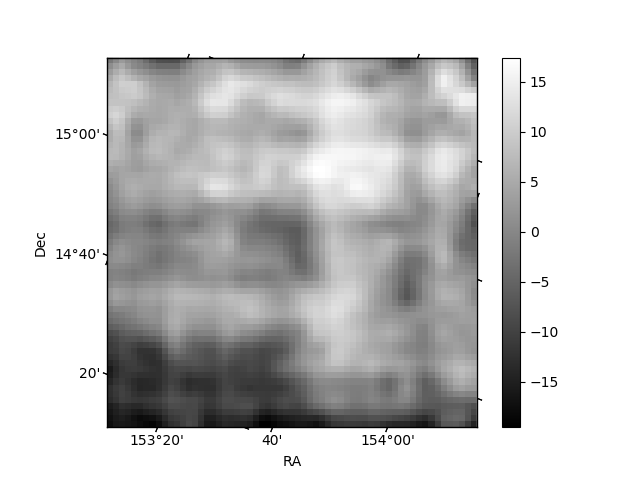
Histogram calculated using DETX and DETY for each event in the final _common_clean file
| Quadrant A | 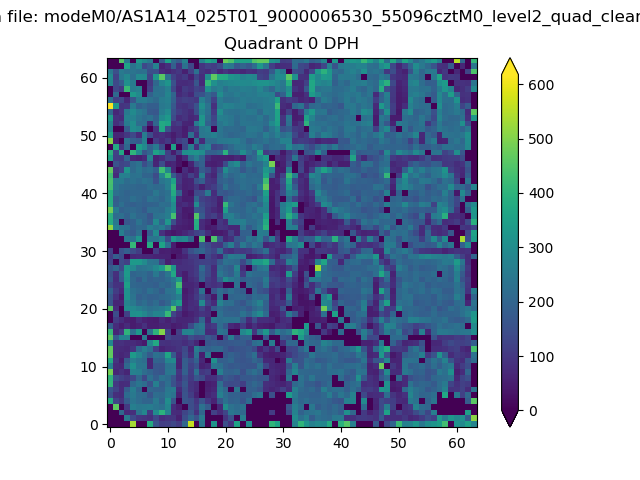 |
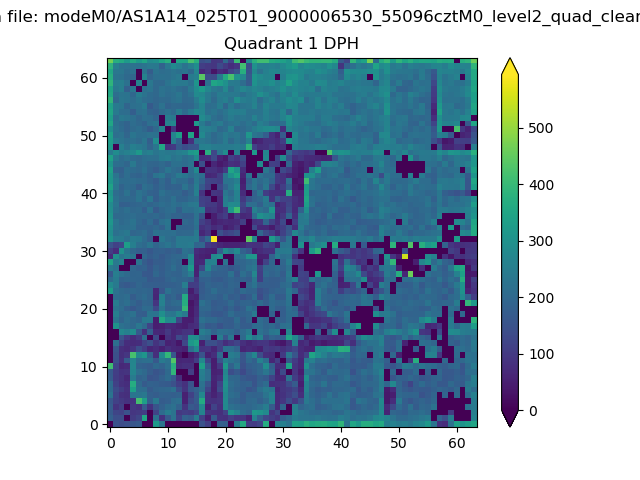 |
Quadrant B |
|---|---|---|---|
| Quadrant D |  |
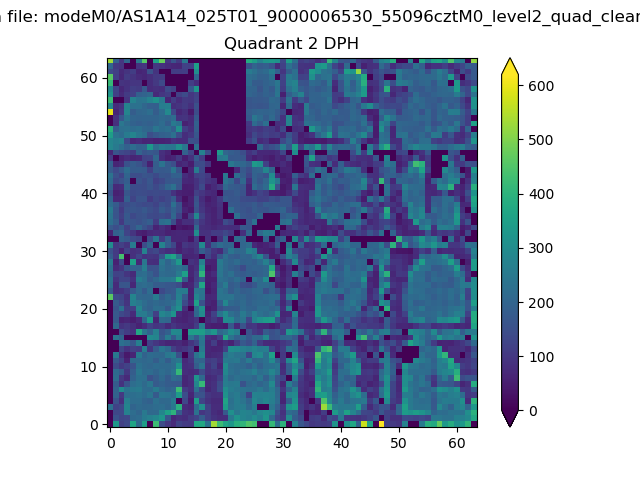 |
Quadrant C |
| Plot type | Count rate plots | Images |
|---|---|---|
| Comparison with Poisson distribution Blue bars denote a histogram of data divided into 1 sec bins. Red curve is a Poisson curve with rate = median count rate of data. |
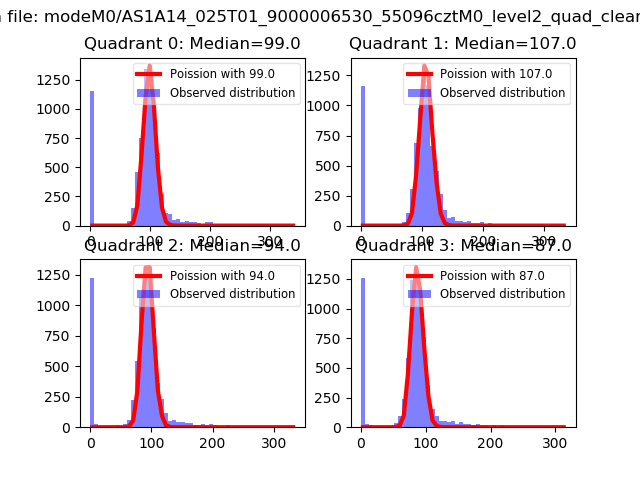 |
 |
| Quadrant-wise count rates Data is divided into 100 sec bins |
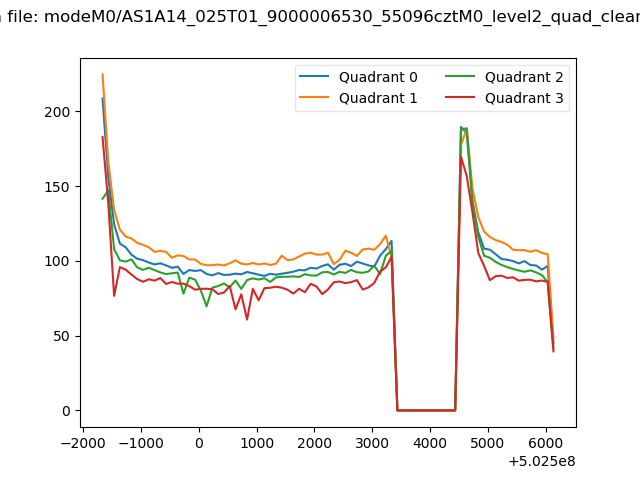 |
|
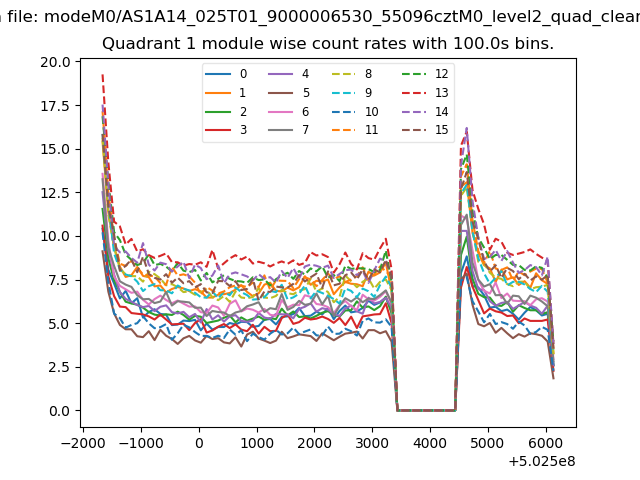
| Module-wise count rates for Quadrant A Data is divided into 100 sec bins |
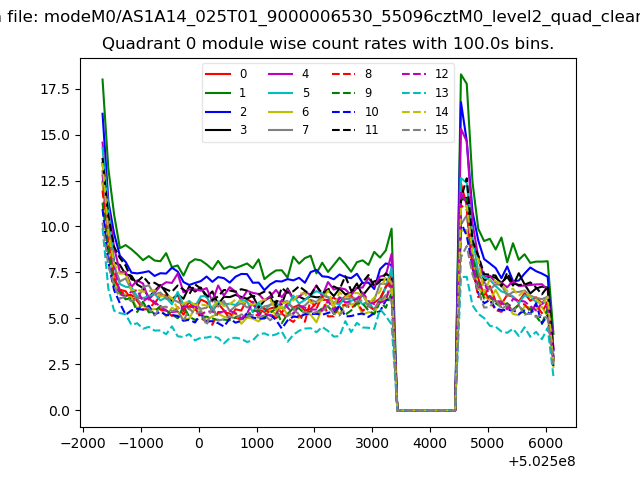 |
 |
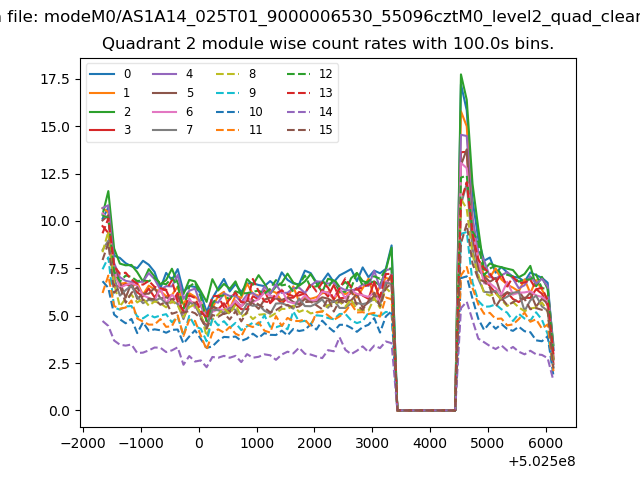
| Module-wise count rates for Quadrant B Data is divided into 100 sec bins |
 |
 |
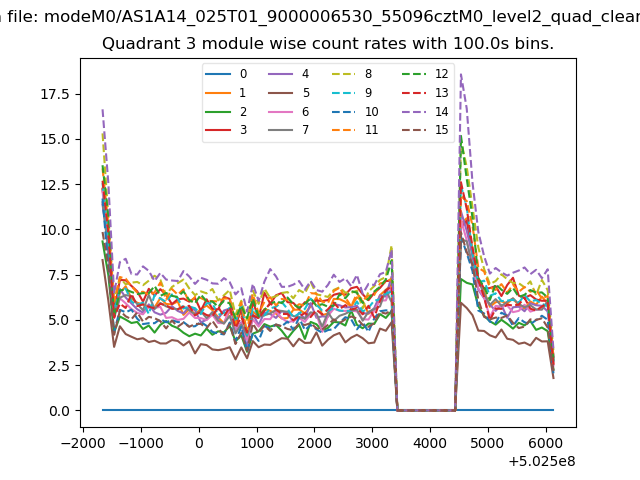
| Module-wise count rates for Quadrant C Data is divided into 100 sec bins |
 |
 |
| Module-wise count rates for Quadrant D Data is divided into 100 sec bins |
 |
 |
| Parameter | Plot |
|---|---|
| CZT HV Monitor | 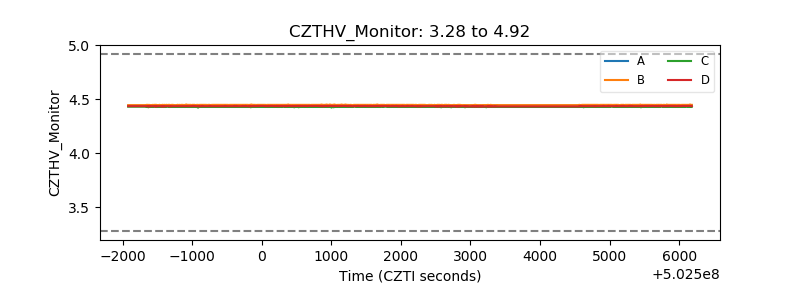 |
| D_VDD | 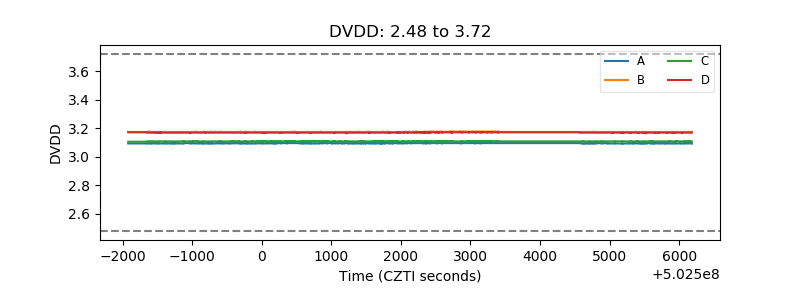 |
| Temperature 1 | 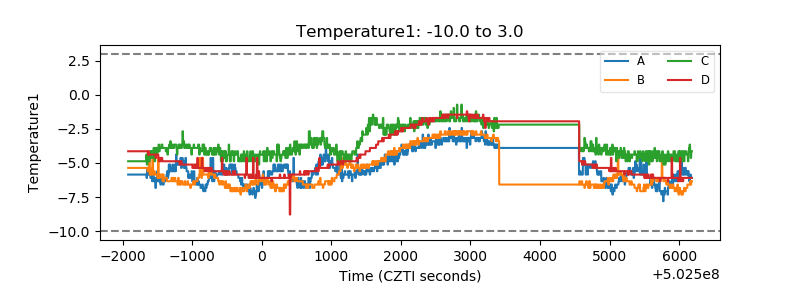 |
| Veto HV Monitor | 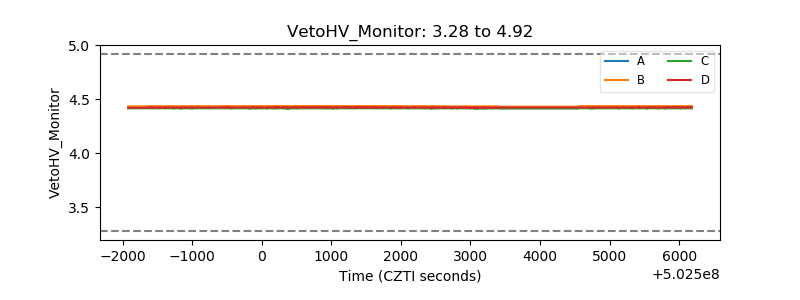 |
| Veto LLD | 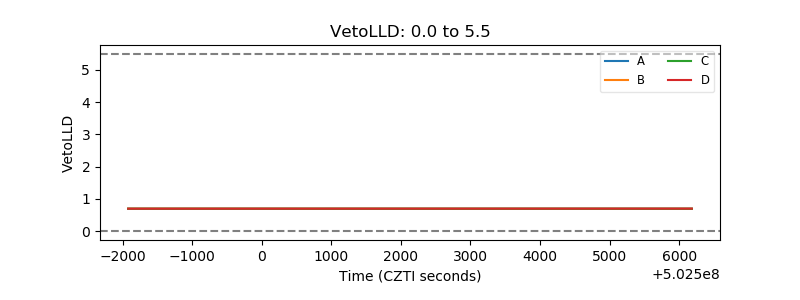 |
| Alpha Counter | 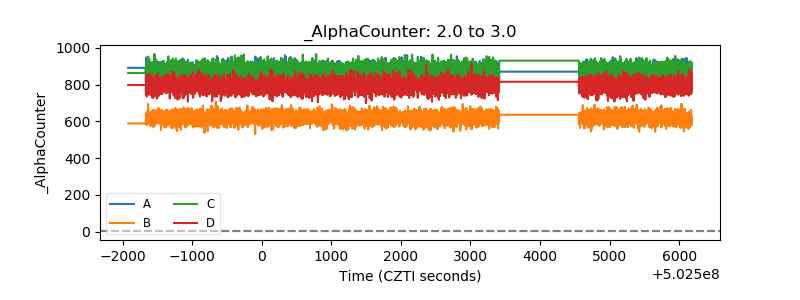 |
| _CPM_Rate | 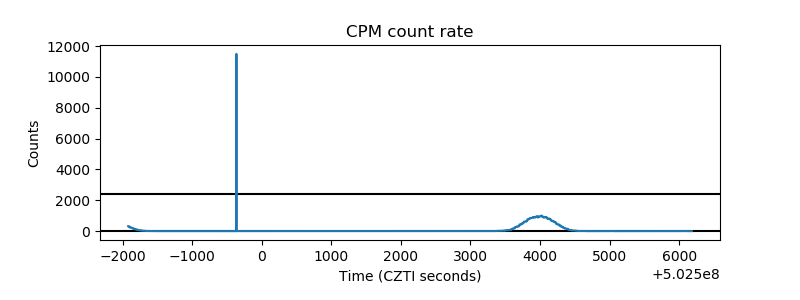 |
| CZT Counter | 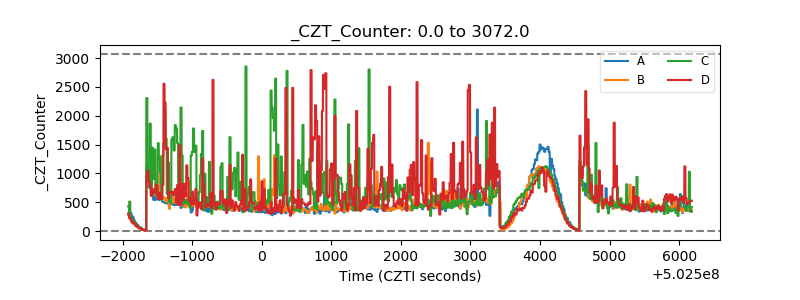 |
| +2.5 Volts monitor |  |
| +5 Volts monitor |  |
| _ROLL_ROT | 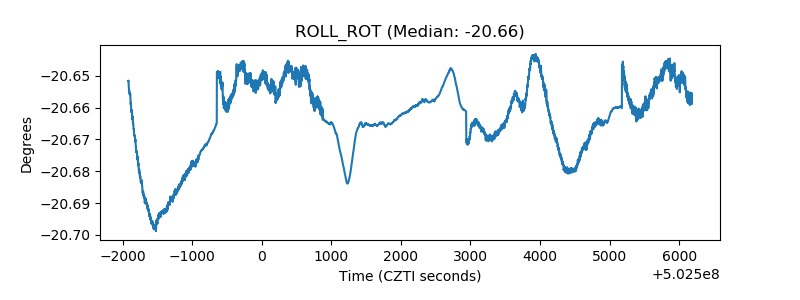 |
| _Roll_DEC | 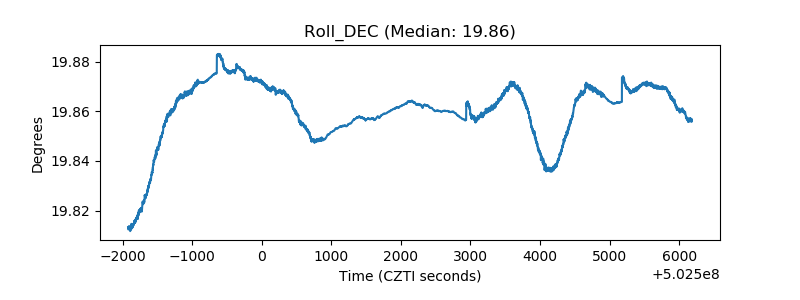 |
| _Roll_RA | 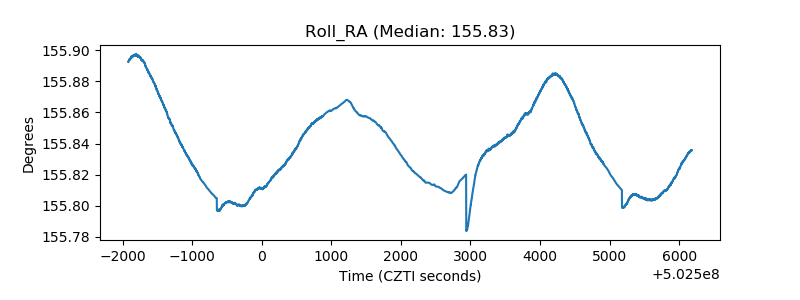 |
| Veto Counter | 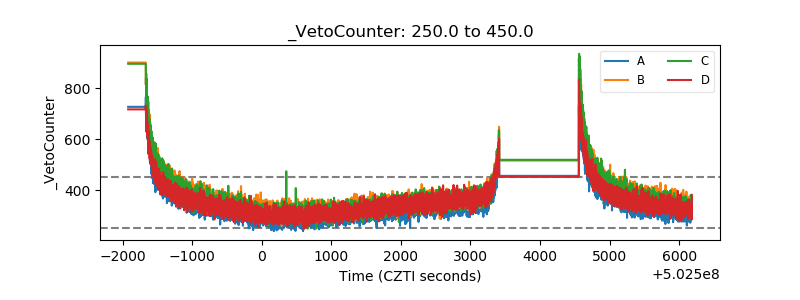 |