| Param | Original file | Final file |
|---|---|---|
| Filename | modeM0/AS1A14_025T01_9000006530_55097cztM0_level2.fits | modeM0/AS1A14_025T01_9000006530_55097cztM0_level2_quad_clean.evt |
| Size (bytes) | 1,660,985,280 | 376,266,240 |
| Size | 1.5 GB | 358.8 MB |
| Events in quadrant A | 11,975,767 | 2,484,352 |
| Events in quadrant B | 12,114,283 | 2,684,416 |
| Events in quadrant C | 16,331,715 | 2,343,291 |
| Events in quadrant D | 19,062,964 | 2,103,186 |
| Mode M0 | |||
|---|---|---|---|
| Quadrant | BADHDUFLAG | Total packets | Discarded packets |
| A | 0 | 58050 | 3123 |
| B | 0 | 57422 | 2882 |
| C | 0 | 70409 | 3326 |
| D | 0 | 78725 | 3909 |
| Mode SS | |||
|---|---|---|---|
| Quadrant | BADHDUFLAG | Total packets | Discarded packets |
| A | 0 | 548 | 24 |
| B | 0 | 550 | 30 |
| C | 0 | 549 | 31 |
| D | 0 | 549 | 31 |
| Mode M9 | |||
|---|---|---|---|
| Quadrant | BADHDUFLAG | Total packets | Discarded packets |
| A | 0 | 21 | 0 |
| B | 0 | 21 | 0 |
| C | 0 | 21 | 0 |
| D | 0 | 23 | 1 |
| Quadrant | Total seconds | Saturated seconds | Saturation percentage |
|---|---|---|---|
| A | 25854 | 217 | 0.839329% |
| B | 25882 | 224 | 0.865466% |
| C | 25825 | 586 | 2.269119% |
| D | 25802 | 1695 | 6.569258% |
Noise dominated data is calculated using 1-second bins in cleaned event files. If a bin has >2000 counts, and if more than 50% of those come from <1% of pixels, then it is considered to be noise-dominated and hence unusable.
| Quadrant | # 1 sec bins | Bins with >0 counts | Bins with >2000 counts | High rate bins dominated by noise | Noise dominated (total time) | Noise dominated (detector-on time) | Marked lightcurve |
|---|---|---|---|---|---|---|---|
| A | 57184 | 26064 | 118 | 118 | 0.21% | 0.45% | 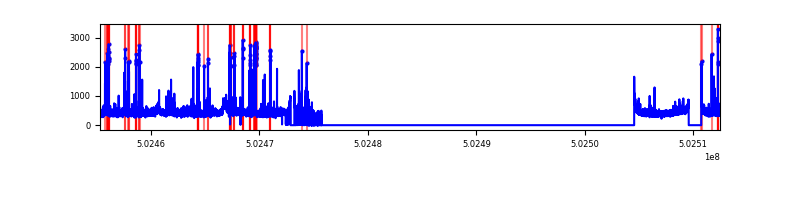 |
| B | 57184 | 26082 | 39 | 39 | 0.07% | 0.15% | 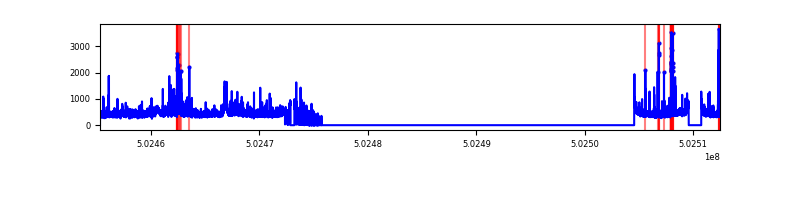 |
| C | 57184 | 26070 | 592 | 592 | 1.04% | 2.27% | 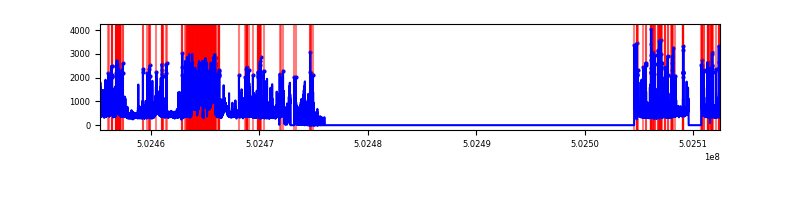 |
| D | 57184 | 26040 | 1646 | 1646 | 2.88% | 6.32% | 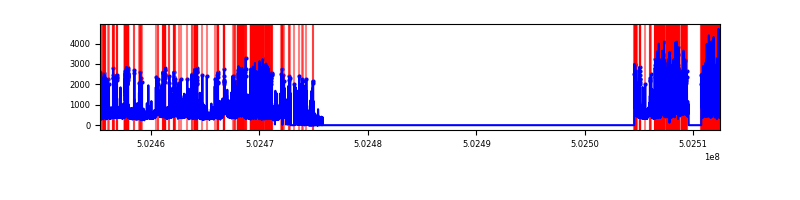 |
Top three noisy pixels from each quadrant. If the there are fewer than three noisy pixels in the level2.evt file, extra rows are filled as -1
| Pixel properties | Quadrant properties | ||||||
|---|---|---|---|---|---|---|---|
| Quadrant | DetID | PixID | Counts | Sigma | Mean | Median | Sigma |
| A | 3 | 61 | 433883 | 623.21 | 2829 | 2762 | 691.8 |
| A | 0 | 8 | 300759 | 430.77 | 2829 | 2762 | 691.8 |
| A | 4 | 3 | 143895 | 204.02 | 2829 | 2762 | 691.8 |
| B | 7 | 0 | 451687 | 749.41 | 2796 | 2694 | 599.1 |
| B | 5 | 185 | 263616 | 435.5 | 2796 | 2694 | 599.1 |
| B | 0 | 182 | 99885 | 162.22 | 2796 | 2694 | 599.1 |
| C | 9 | 38 | 3158416 | 4232.9 | 2739 | 2718 | 745.5 |
| C | 6 | 223 | 658225 | 879.26 | 2739 | 2718 | 745.5 |
| C | 13 | 3 | 646749 | 863.87 | 2739 | 2718 | 745.5 |
| D | 2 | 249 | 2965657 | 3934.19 | 2667 | 2554 | 753.2 |
| D | 9 | 1 | 882595 | 1168.45 | 2667 | 2554 | 753.2 |
| D | 6 | 239 | 665679 | 880.45 | 2667 | 2554 | 753.2 |
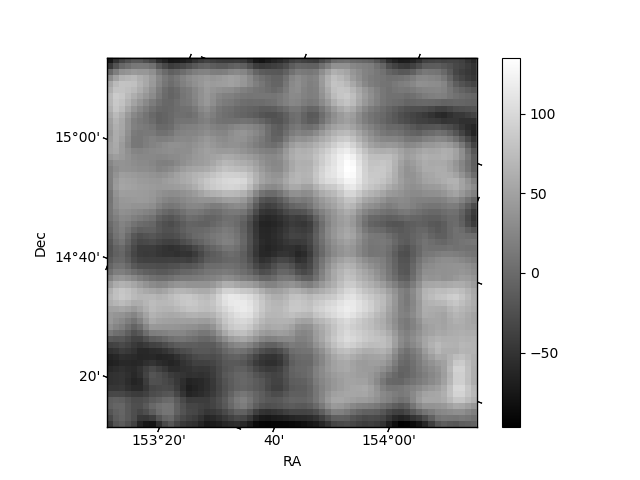
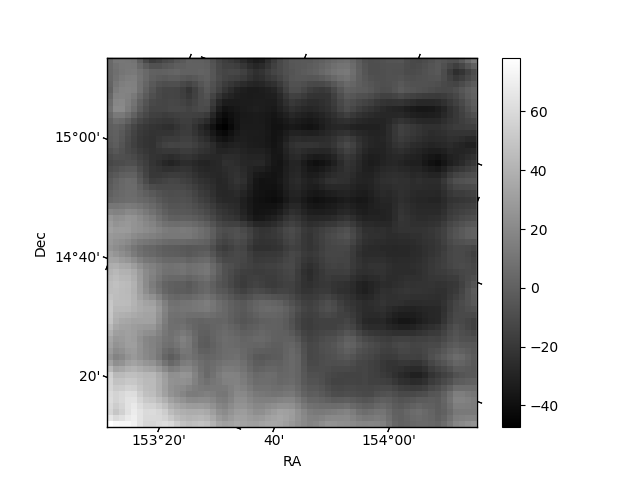
Histogram calculated using DETX and DETY for each event in the final _common_clean file
| Quadrant A | 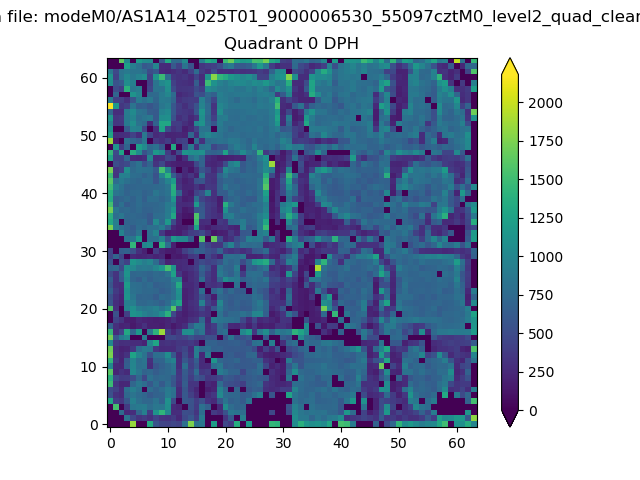 |
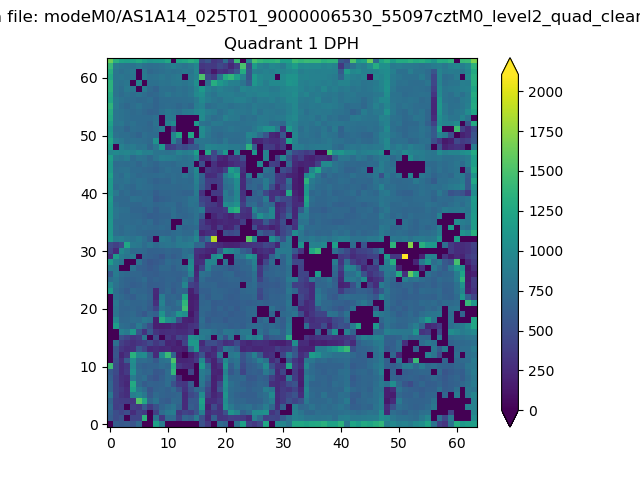 |
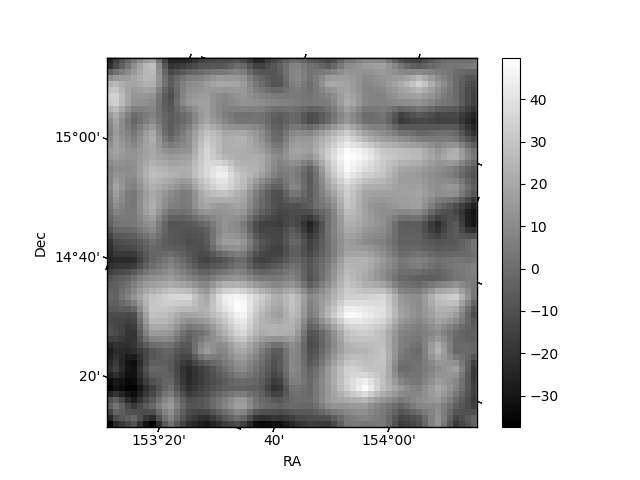
Quadrant B |
|---|---|---|---|
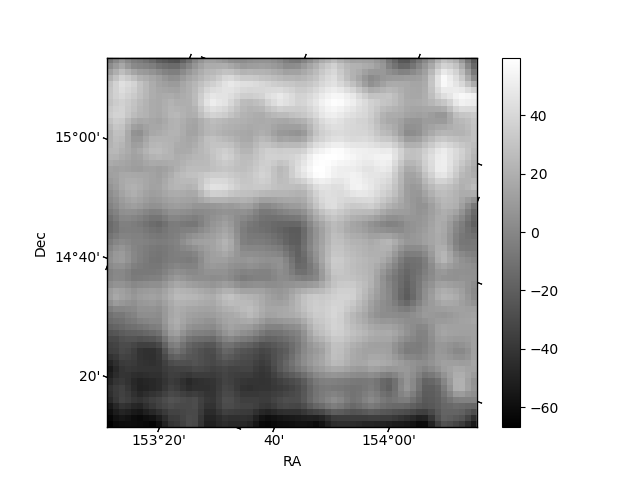
| Quadrant D | 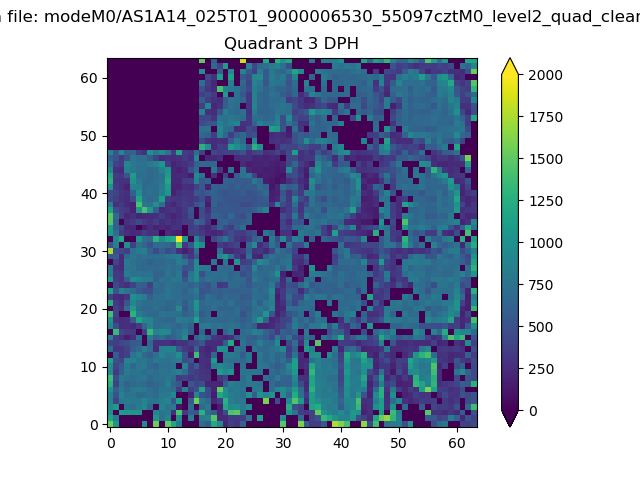 |
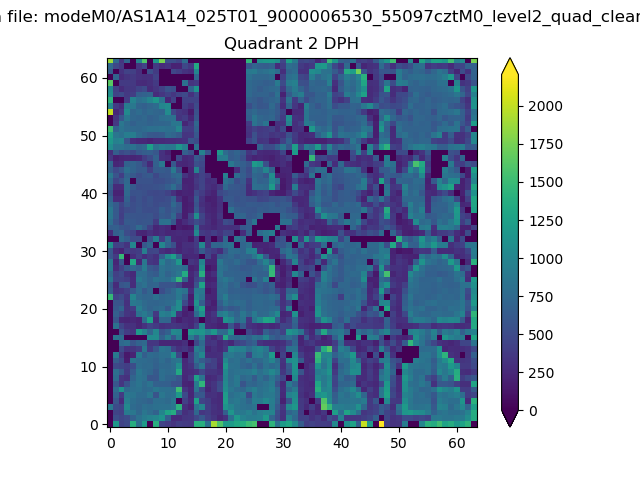 |
Quadrant C |
| Plot type | Count rate plots | Images |
|---|---|---|
| Comparison with Poisson distribution Blue bars denote a histogram of data divided into 1 sec bins. Red curve is a Poisson curve with rate = median count rate of data. |
 |
 |
| Quadrant-wise count rates Data is divided into 100 sec bins |
 |
|
| Module-wise count rates for Quadrant A Data is divided into 100 sec bins |
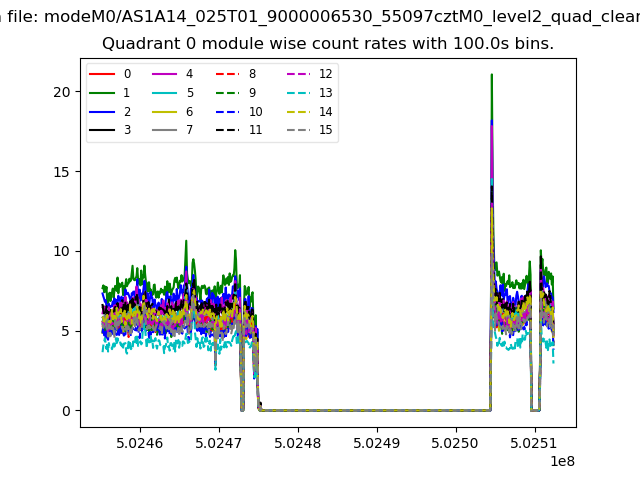 |
 |
| Module-wise count rates for Quadrant B Data is divided into 100 sec bins |
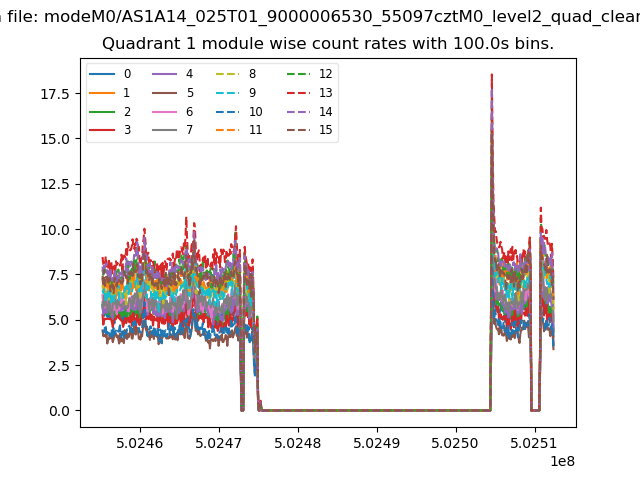 |
 |
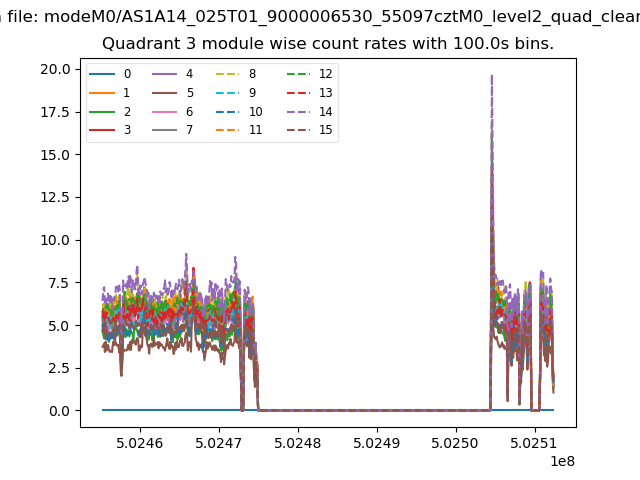
| Module-wise count rates for Quadrant C Data is divided into 100 sec bins |
 |
 |
| Module-wise count rates for Quadrant D Data is divided into 100 sec bins |
 |
 |
| Parameter | Plot |
|---|---|
| CZT HV Monitor | 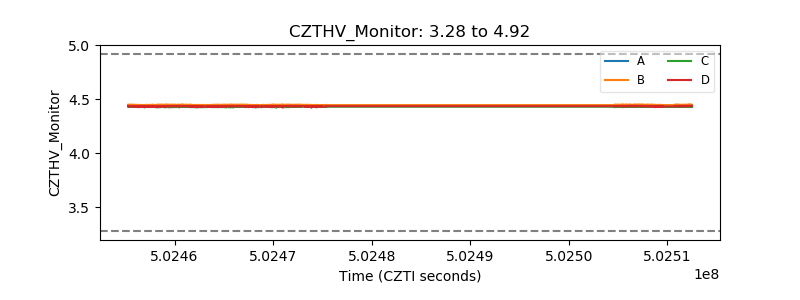 |
| D_VDD | 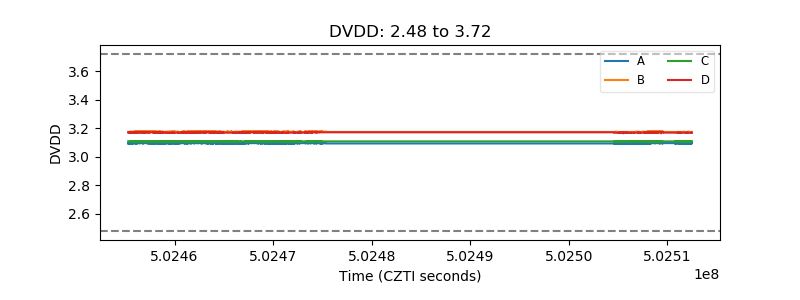 |
| Temperature 1 | 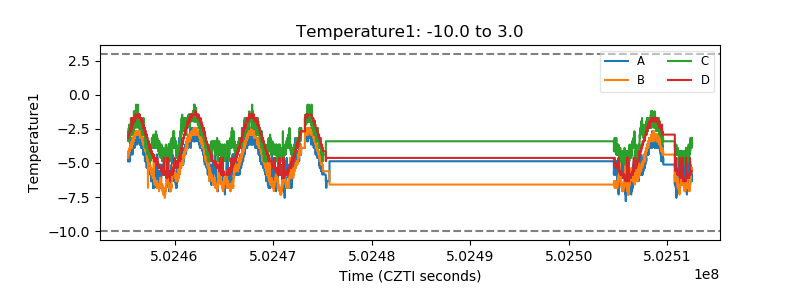 |
| Veto HV Monitor | 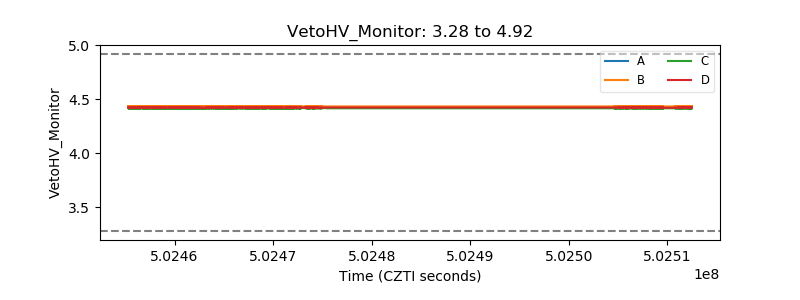 |
| Veto LLD | 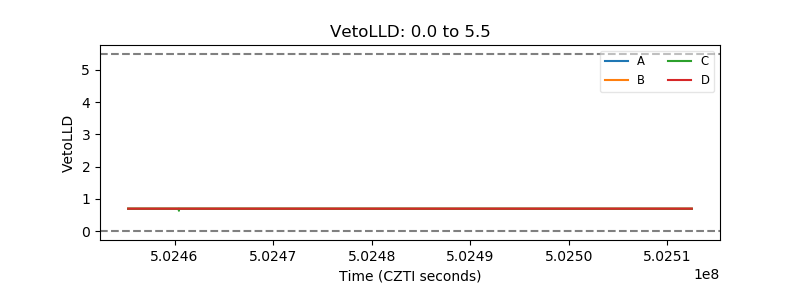 |
| Alpha Counter |  |
| _CPM_Rate | 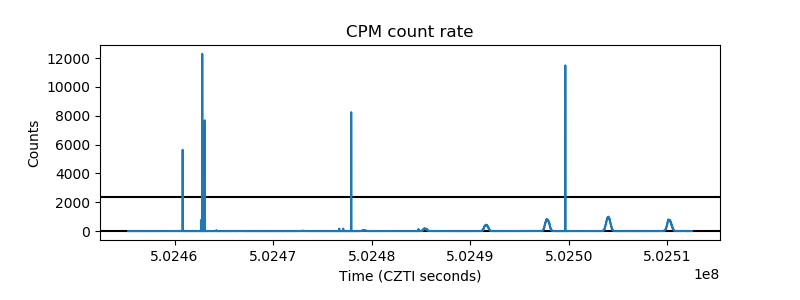 |
| CZT Counter | 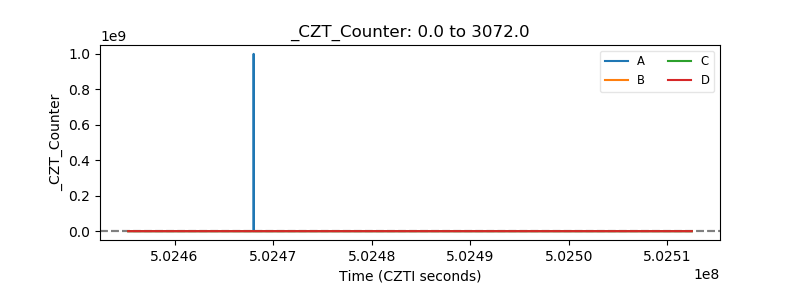 |
| +2.5 Volts monitor |  |
| +5 Volts monitor |  |
| _ROLL_ROT | 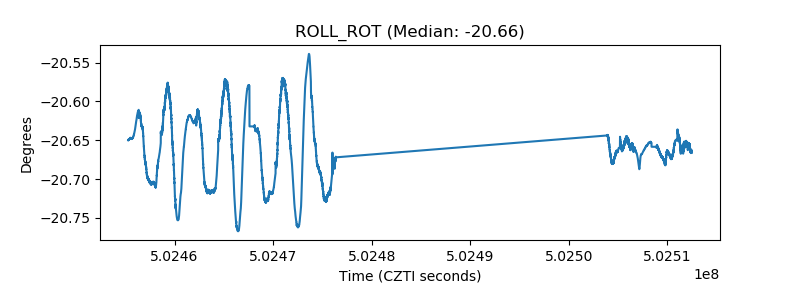 |
| _Roll_DEC | 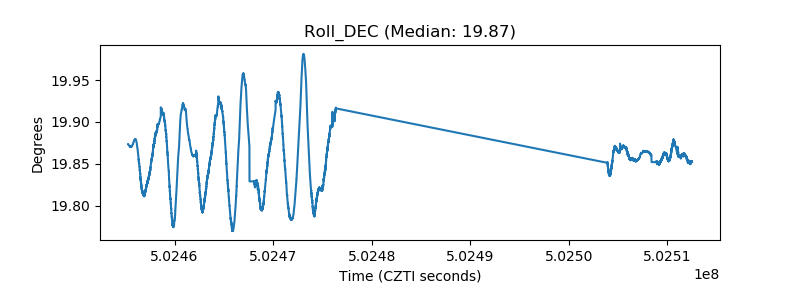 |
| _Roll_RA | 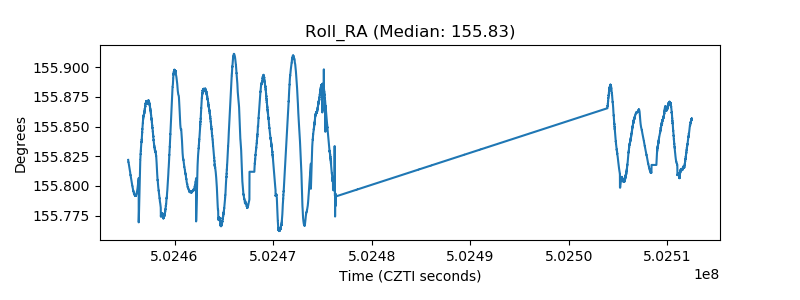 |
| Veto Counter | 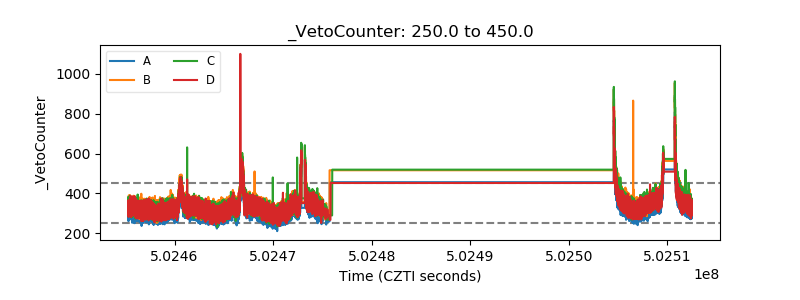 |