| Param | Original file | Final file |
|---|---|---|
| Filename | modeM0/AS1A14_025T01_9000006530_55098cztM0_level2.fits | modeM0/AS1A14_025T01_9000006530_55098cztM0_level2_quad_clean.evt |
| Size (bytes) | 2,147,400,000 | 470,059,200 |
| Size | 2.0 GB | 448.3 MB |
| Events in quadrant A | 14,282,312 | 3,151,218 |
| Events in quadrant B | 14,498,029 | 3,383,295 |
| Events in quadrant C | 19,452,822 | 2,939,953 |
| Events in quadrant D | 28,808,059 | 2,582,628 |
| Mode M0 | |||
|---|---|---|---|
| Quadrant | BADHDUFLAG | Total packets | Discarded packets |
| A | 0 | 66521 | 151 |
| B | 0 | 67118 | 117 |
| C | 0 | 80513 | 121 |
| D | 0 | 108122 | 163 |
| Mode SS | |||
|---|---|---|---|
| Quadrant | BADHDUFLAG | Total packets | Discarded packets |
| A | 0 | 644 | 0 |
| B | 0 | 644 | 2 |
| C | 0 | 644 | 0 |
| D | 0 | 644 | 0 |
| Mode M9 | |||
|---|---|---|---|
| Quadrant | BADHDUFLAG | Total packets | Discarded packets |
| A | 0 | 63 | 0 |
| B | 0 | 63 | 0 |
| C | 0 | 63 | 0 |
| D | 0 | 63 | 0 |
| Quadrant | Total seconds | Saturated seconds | Saturation percentage |
|---|---|---|---|
| A | 31664 | 231 | 0.729535% |
| B | 31668 | 366 | 1.155741% |
| C | 31668 | 904 | 2.854617% |
| D | 31669 | 3556 | 11.228646% |
Noise dominated data is calculated using 1-second bins in cleaned event files. If a bin has >2000 counts, and if more than 50% of those come from <1% of pixels, then it is considered to be noise-dominated and hence unusable.
| Quadrant | # 1 sec bins | Bins with >0 counts | Bins with >2000 counts | High rate bins dominated by noise | Noise dominated (total time) | Noise dominated (detector-on time) | Marked lightcurve |
|---|---|---|---|---|---|---|---|
| A | 37852 | 31684 | 63 | 63 | 0.17% | 0.20% | 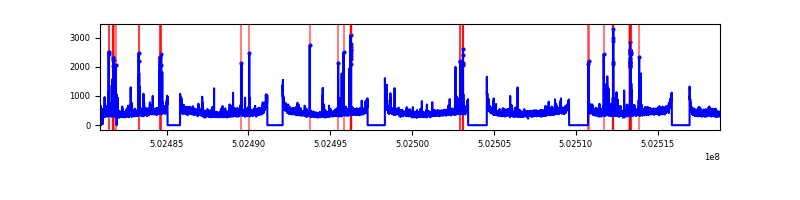 |
| B | 37870 | 31690 | 55 | 55 | 0.15% | 0.17% | 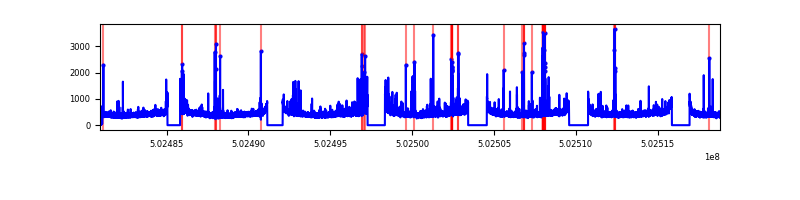 |
| C | 37857 | 31684 | 658 | 658 | 1.74% | 2.08% |  |
| D | 37864 | 31684 | 3373 | 3373 | 8.91% | 10.65% | 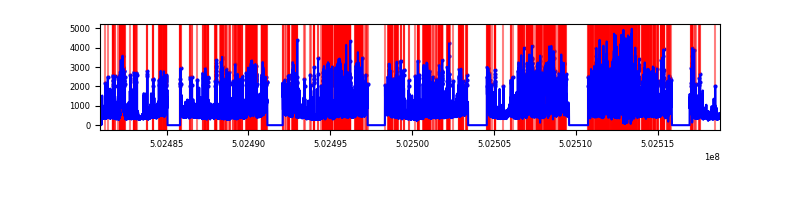 |
Top three noisy pixels from each quadrant. If the there are fewer than three noisy pixels in the level2.evt file, extra rows are filled as -1
| Pixel properties | Quadrant properties | ||||||
|---|---|---|---|---|---|---|---|
| Quadrant | DetID | PixID | Counts | Sigma | Mean | Median | Sigma |
| A | 3 | 61 | 259794 | 303.08 | 3447 | 3375 | 846.0 |
| A | 4 | 3 | 248165 | 289.34 | 3447 | 3375 | 846.0 |
| A | 0 | 8 | 154684 | 178.84 | 3447 | 3375 | 846.0 |
| B | 4 | 21 | 530854 | 721.75 | 3408 | 3285 | 731.0 |
| B | 5 | 185 | 233400 | 314.81 | 3408 | 3285 | 731.0 |
| B | 5 | 172 | 105976 | 140.49 | 3408 | 3285 | 731.0 |
| C | 3 | 242 | 2610232 | 2860.01 | 3312 | 3277 | 911.5 |
| C | 13 | 3 | 1321850 | 1446.56 | 3312 | 3277 | 911.5 |
| C | 6 | 223 | 1086778 | 1188.67 | 3312 | 3277 | 911.5 |
| D | 2 | 249 | 5304744 | 5820.57 | 3186 | 3047 | 910.9 |
| D | 15 | 94 | 4199491 | 4607.15 | 3186 | 3047 | 910.9 |
| D | 6 | 239 | 2317771 | 2541.26 | 3186 | 3047 | 910.9 |
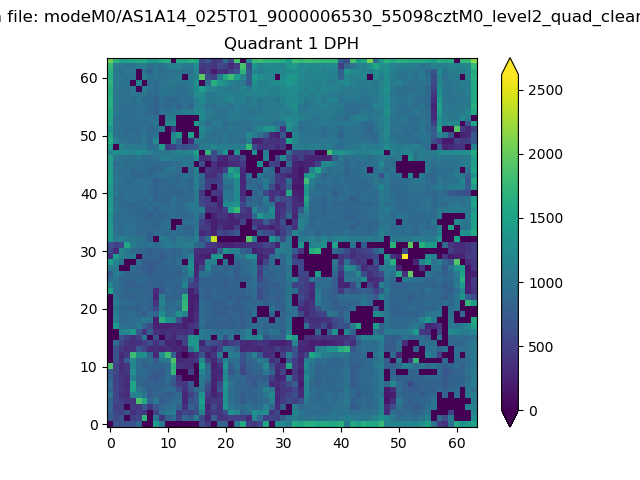
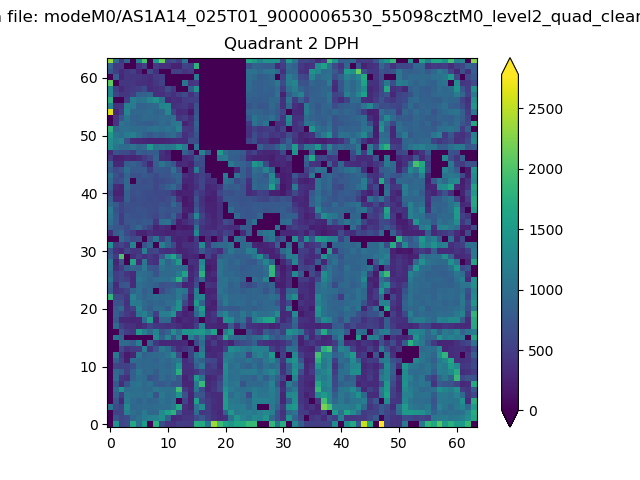
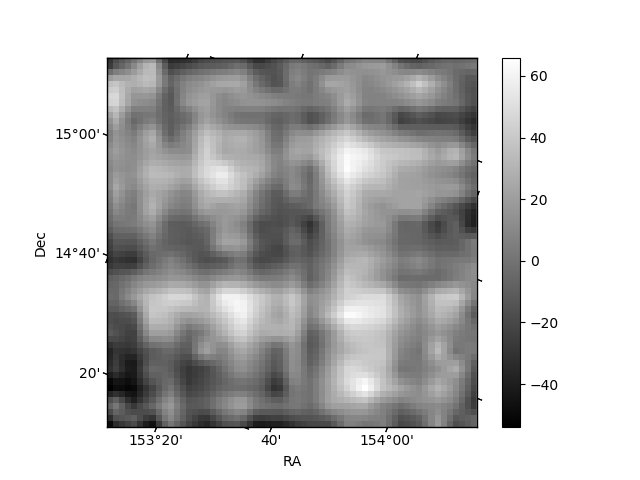
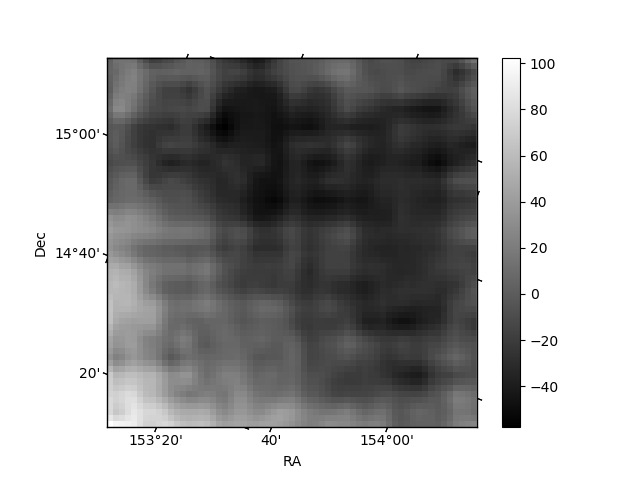
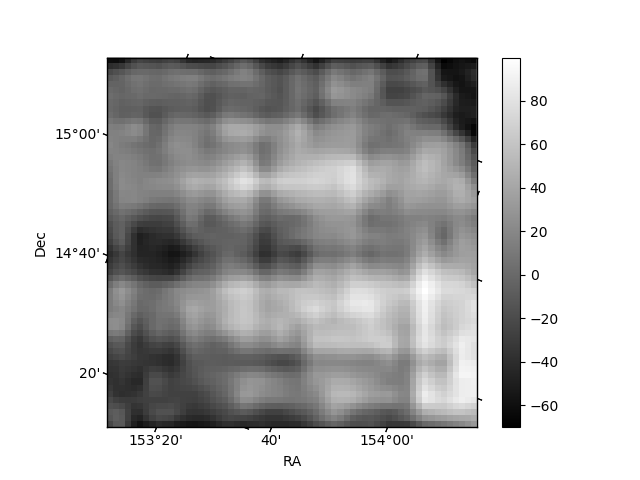
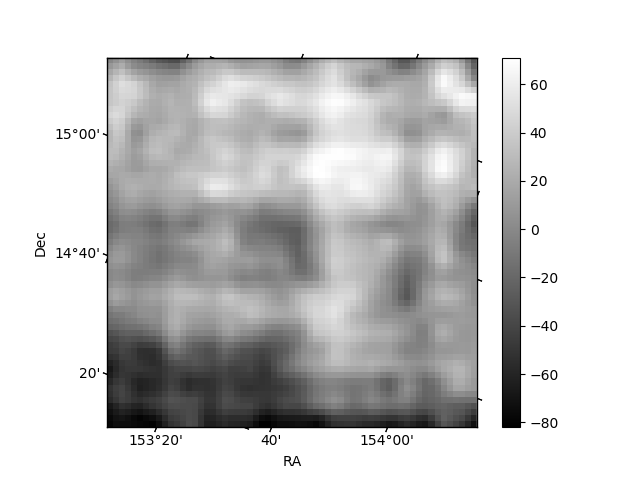
Histogram calculated using DETX and DETY for each event in the final _common_clean file
| Quadrant A | 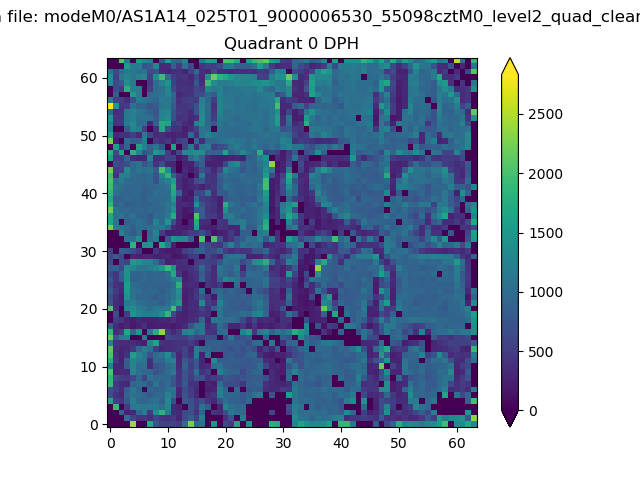 |
 |
Quadrant B |
|---|---|---|---|
| Quadrant D | 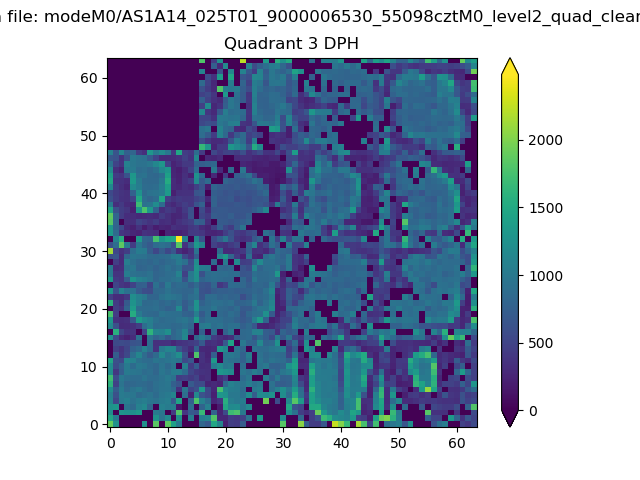 |
 |
Quadrant C |
| Plot type | Count rate plots | Images |
|---|---|---|
| Comparison with Poisson distribution Blue bars denote a histogram of data divided into 1 sec bins. Red curve is a Poisson curve with rate = median count rate of data. |
 |
 |
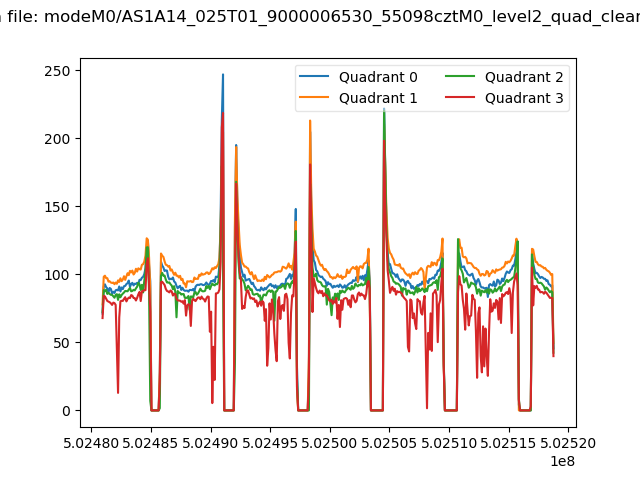
| Quadrant-wise count rates Data is divided into 100 sec bins |
 |
|
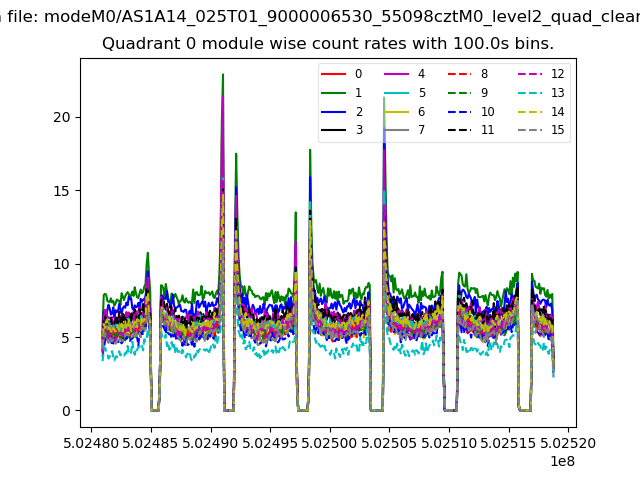
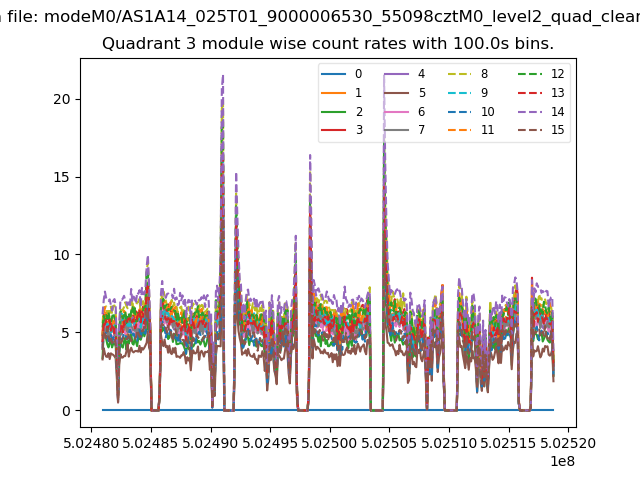
| Module-wise count rates for Quadrant A Data is divided into 100 sec bins |
 |
 |
| Module-wise count rates for Quadrant B Data is divided into 100 sec bins |
 |
 |
| Module-wise count rates for Quadrant C Data is divided into 100 sec bins |
 |
 |
| Module-wise count rates for Quadrant D Data is divided into 100 sec bins |
 |
 |
| Parameter | Plot |
|---|---|
| CZT HV Monitor |  |
| D_VDD | 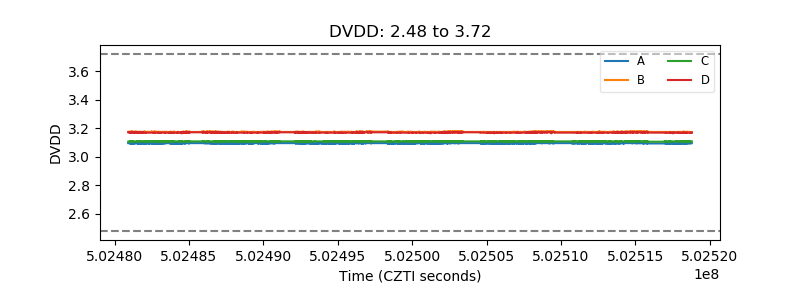 |
| Temperature 1 | 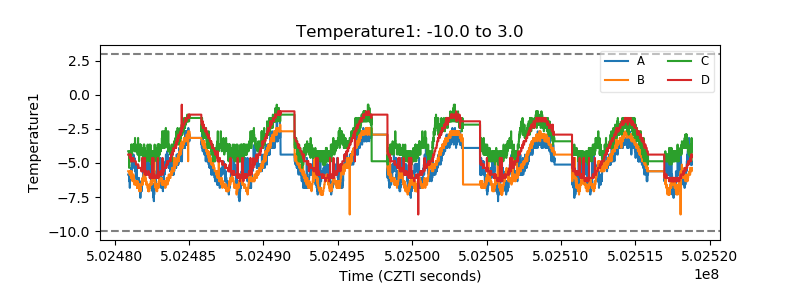 |
| Veto HV Monitor | 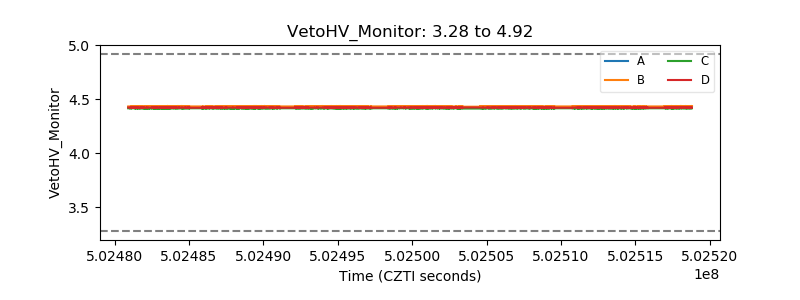 |
| Veto LLD | 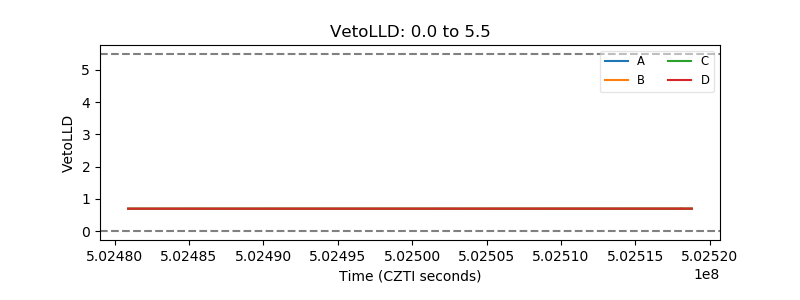 |
| Alpha Counter | 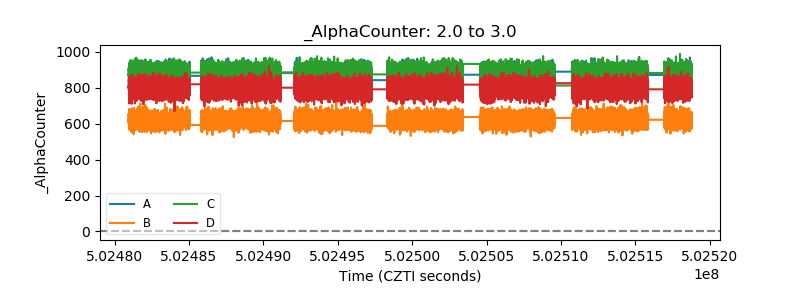 |
| _CPM_Rate | 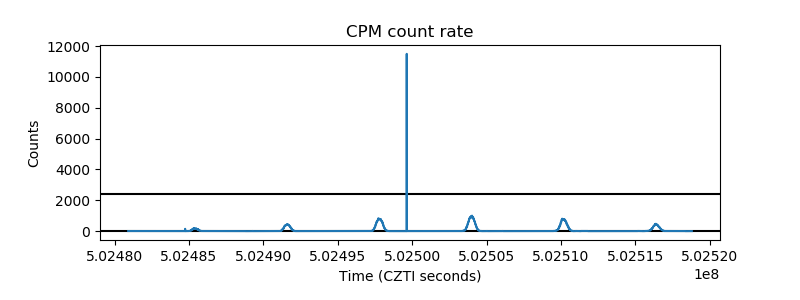 |
| CZT Counter | 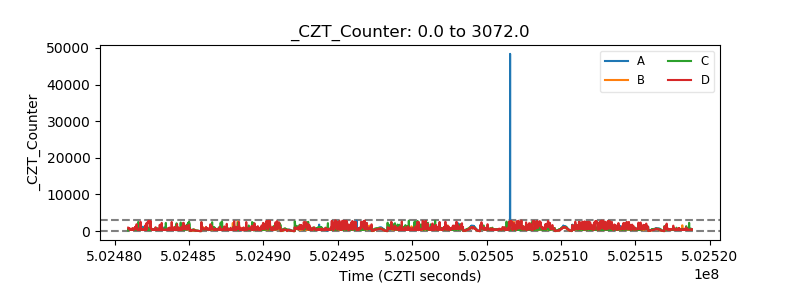 |
| +2.5 Volts monitor | 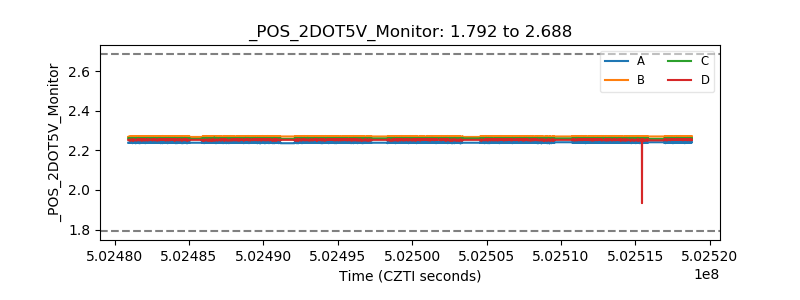 |
| +5 Volts monitor |  |
| _ROLL_ROT | 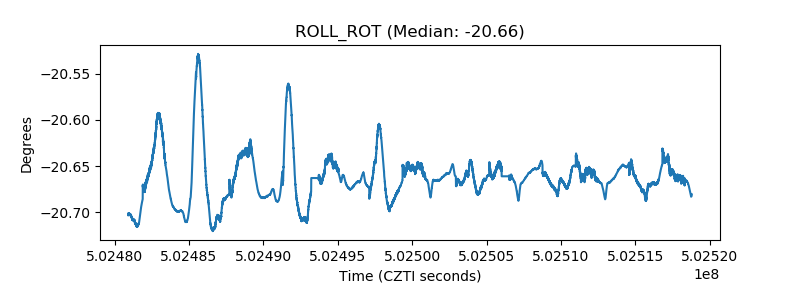 |
| _Roll_DEC | 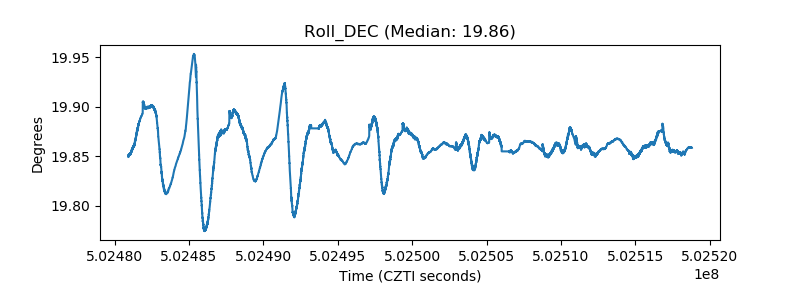 |
| _Roll_RA | 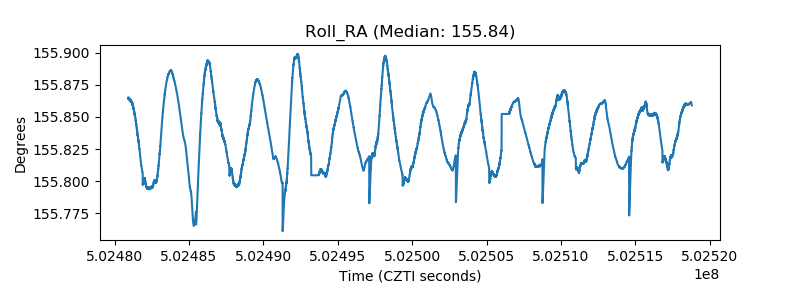 |
| Veto Counter | 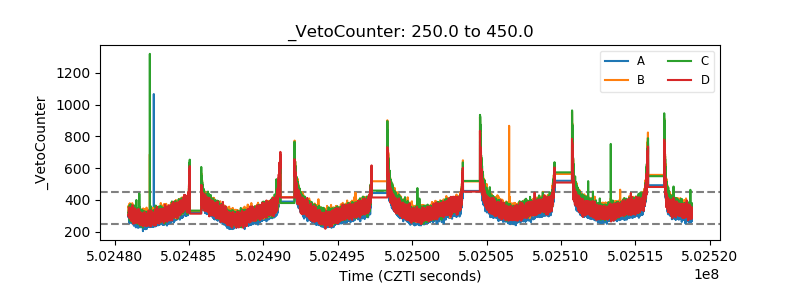 |