| Param | Original file | Final file |
|---|---|---|
| Filename | modeM0/AS1A14_025T01_9000006530_55100cztM0_level2.fits | modeM0/AS1A14_025T01_9000006530_55100cztM0_level2_quad_clean.evt |
| Size (bytes) | 1,645,925,760 | 361,440,000 |
| Size | 1.5 GB | 344.7 MB |
| Events in quadrant A | 11,207,226 | 2,416,058 |
| Events in quadrant B | 11,321,298 | 2,598,186 |
| Events in quadrant C | 13,379,280 | 2,301,584 |
| Events in quadrant D | 23,127,397 | 1,947,108 |
| Mode M0 | |||
|---|---|---|---|
| Quadrant | BADHDUFLAG | Total packets | Discarded packets |
| A | 0 | 51677 | 5 |
| B | 0 | 51698 | 5 |
| C | 0 | 57062 | 5 |
| D | 0 | 86148 | 5 |
| Mode SS | |||
|---|---|---|---|
| Quadrant | BADHDUFLAG | Total packets | Discarded packets |
| A | 0 | 498 | 0 |
| B | 0 | 498 | 0 |
| C | 0 | 498 | 0 |
| D | 0 | 498 | 0 |
| Mode M9 | |||
|---|---|---|---|
| Quadrant | BADHDUFLAG | Total packets | Discarded packets |
| A | 0 | 49 | 0 |
| B | 0 | 49 | 0 |
| C | 0 | 49 | 0 |
| D | 0 | 49 | 0 |
| Quadrant | Total seconds | Saturated seconds | Saturation percentage |
|---|---|---|---|
| A | 24441 | 385 | 1.575222% |
| B | 24442 | 490 | 2.004746% |
| C | 24442 | 513 | 2.098846% |
| D | 24442 | 3264 | 13.354063% |
Noise dominated data is calculated using 1-second bins in cleaned event files. If a bin has >2000 counts, and if more than 50% of those come from <1% of pixels, then it is considered to be noise-dominated and hence unusable.
| Quadrant | # 1 sec bins | Bins with >0 counts | Bins with >2000 counts | High rate bins dominated by noise | Noise dominated (total time) | Noise dominated (detector-on time) | Marked lightcurve |
|---|---|---|---|---|---|---|---|
| A | 29346 | 24447 | 38 | 38 | 0.13% | 0.16% | 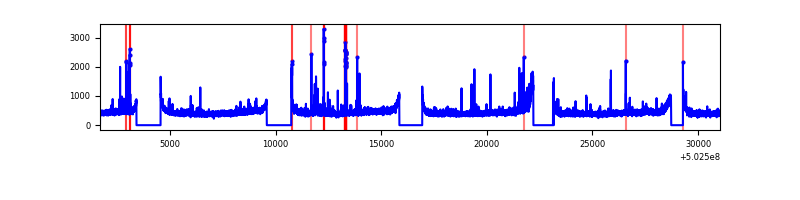 |
| B | 29347 | 24448 | 42 | 42 | 0.14% | 0.17% | 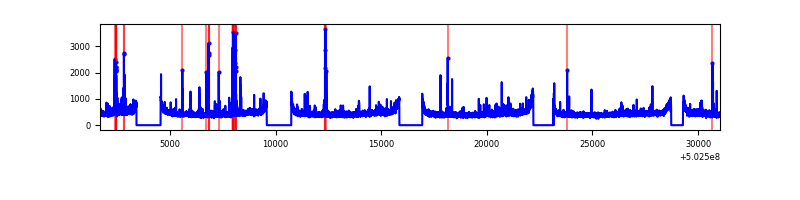 |
| C | 29347 | 24448 | 260 | 260 | 0.89% | 1.06% | 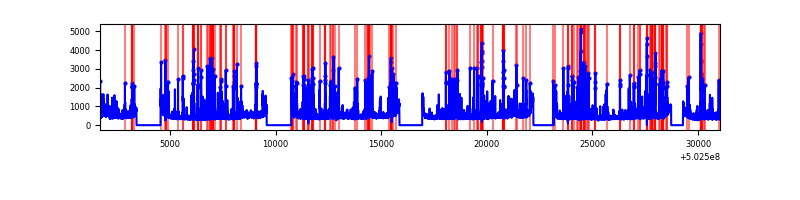 |
| D | 29347 | 24447 | 2758 | 2758 | 9.40% | 11.28% | 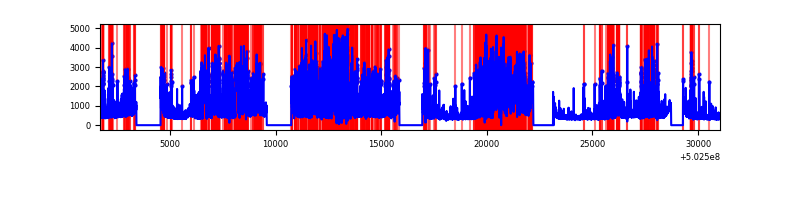 |
Top three noisy pixels from each quadrant. If the there are fewer than three noisy pixels in the level2.evt file, extra rows are filled as -1
| Pixel properties | Quadrant properties | ||||||
|---|---|---|---|---|---|---|---|
| Quadrant | DetID | PixID | Counts | Sigma | Mean | Median | Sigma |
| A | 4 | 3 | 192211 | 281.41 | 2733 | 2670 | 673.5 |
| A | 0 | 8 | 108044 | 156.45 | 2733 | 2670 | 673.5 |
| A | 7 | 237 | 104655 | 151.42 | 2733 | 2670 | 673.5 |
| B | 4 | 21 | 286088 | 491.3 | 2687 | 2585 | 577.0 |
| B | 5 | 185 | 158186 | 269.65 | 2687 | 2585 | 577.0 |
| B | 5 | 172 | 71008 | 118.57 | 2687 | 2585 | 577.0 |
| C | 13 | 3 | 982855 | 1355.72 | 2639 | 2614 | 723.0 |
| C | 6 | 223 | 595521 | 820.02 | 2639 | 2614 | 723.0 |
| C | 14 | 254 | 368842 | 506.51 | 2639 | 2614 | 723.0 |
| D | 2 | 249 | 5748078 | 8074.58 | 2510 | 2397 | 711.6 |
| D | 6 | 239 | 2794084 | 3923.24 | 2510 | 2397 | 711.6 |
| D | 15 | 94 | 1708550 | 2397.71 | 2510 | 2397 | 711.6 |
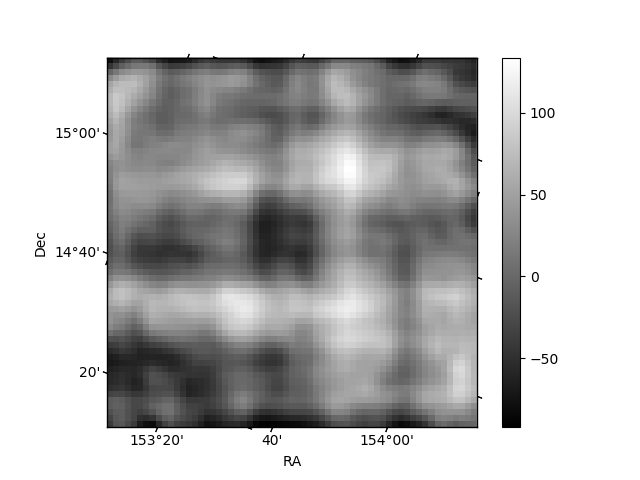
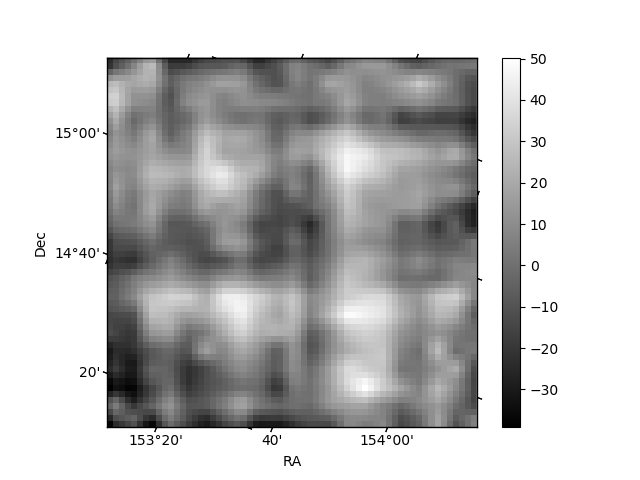
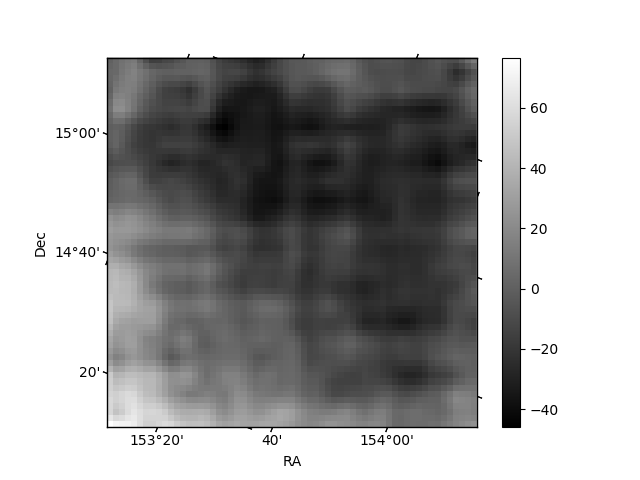
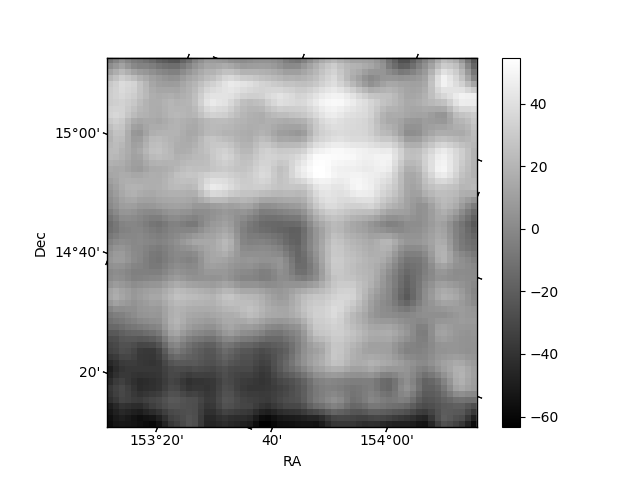
Histogram calculated using DETX and DETY for each event in the final _common_clean file
| Quadrant A | 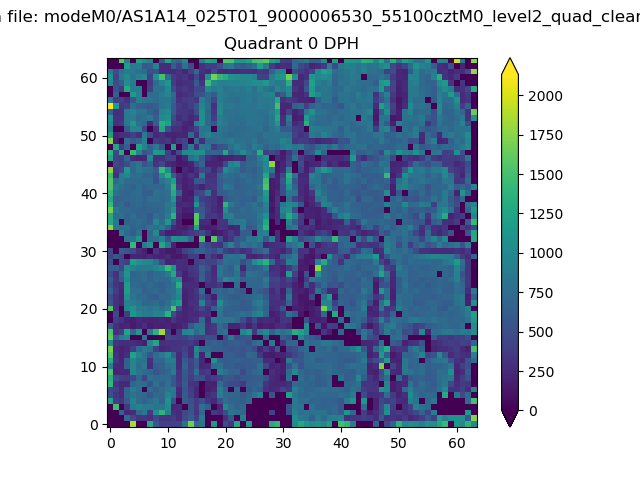 |
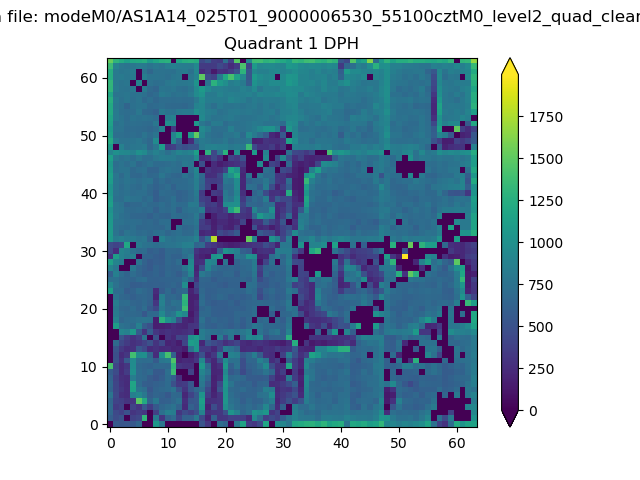 |
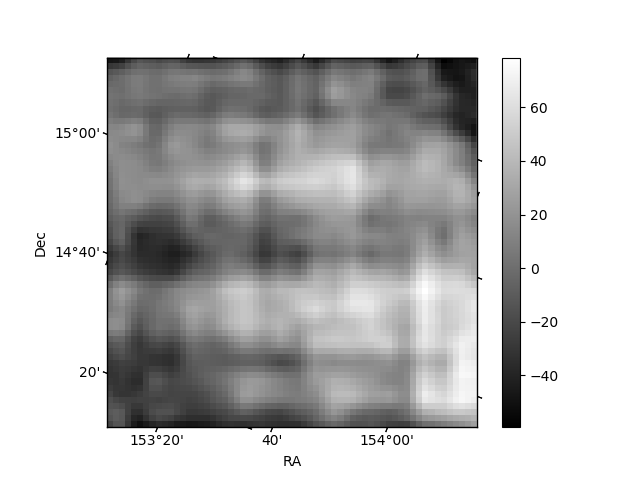
Quadrant B |
|---|---|---|---|
| Quadrant D |  |
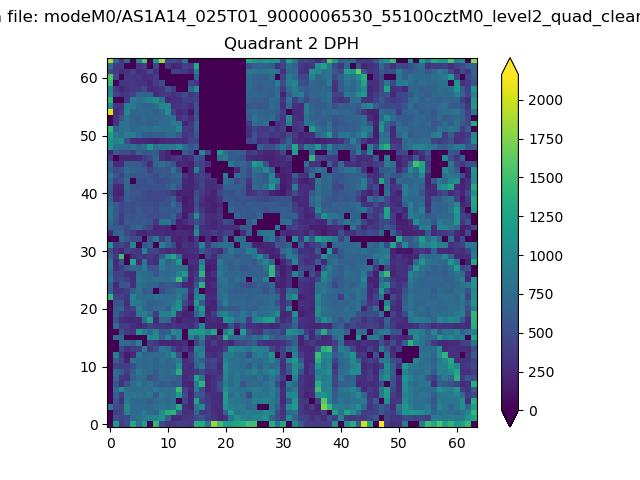 |
Quadrant C |
| Plot type | Count rate plots | Images |
|---|---|---|
| Comparison with Poisson distribution Blue bars denote a histogram of data divided into 1 sec bins. Red curve is a Poisson curve with rate = median count rate of data. |
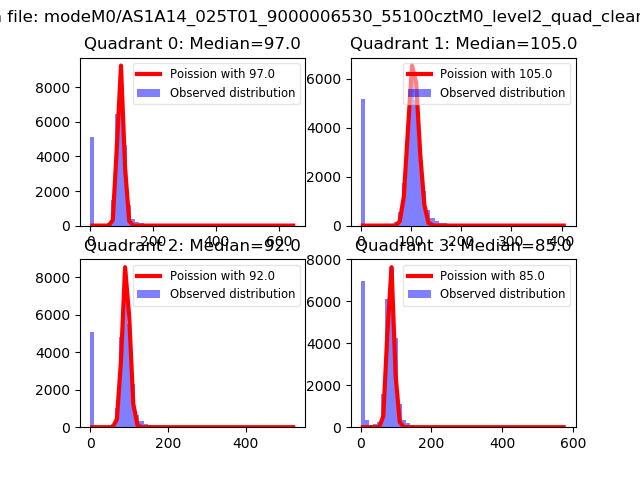 |
 |
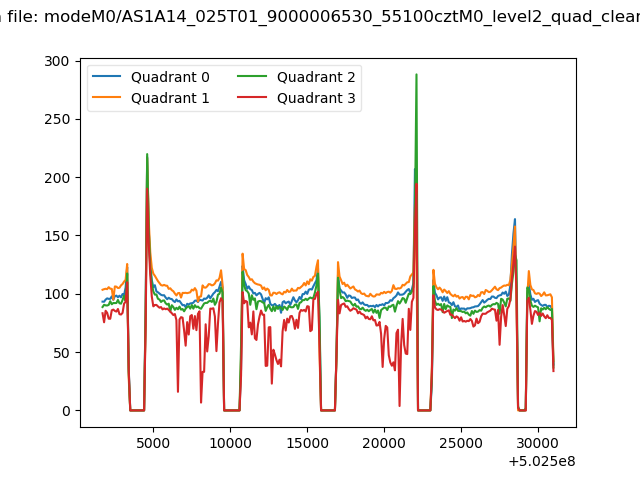
| Quadrant-wise count rates Data is divided into 100 sec bins |
 |
|
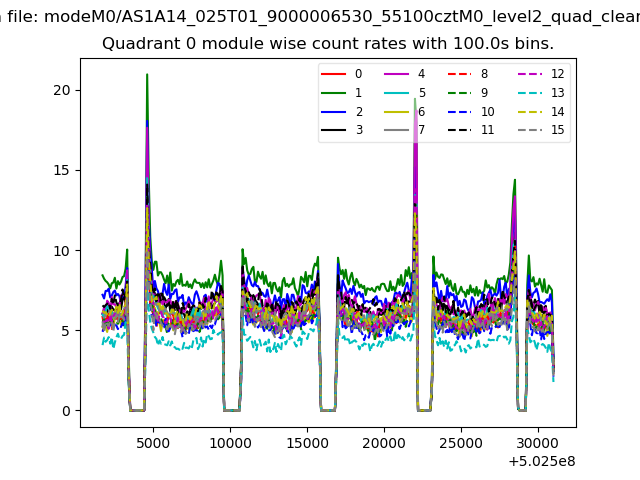
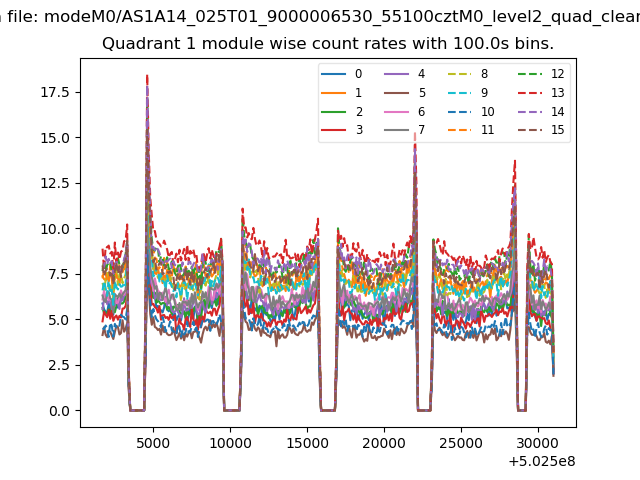
| Module-wise count rates for Quadrant A Data is divided into 100 sec bins |
 |
 |
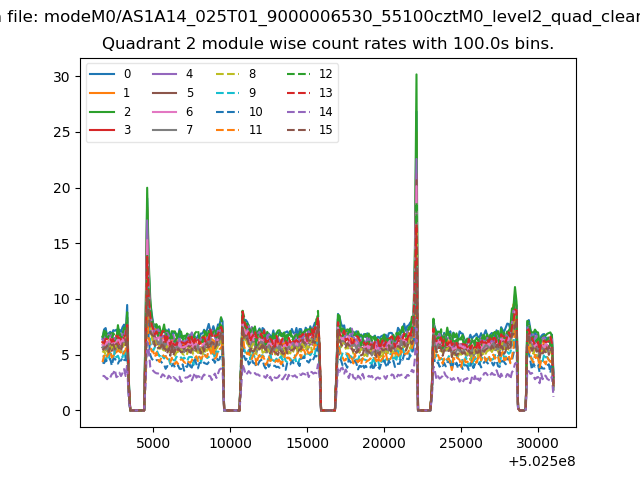
| Module-wise count rates for Quadrant B Data is divided into 100 sec bins |
 |
 |
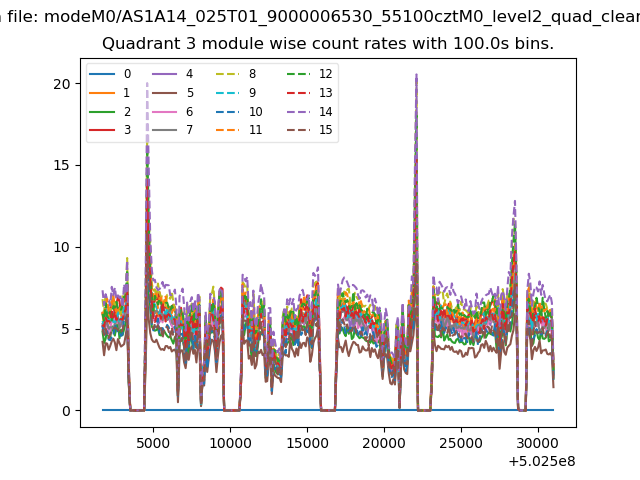
| Module-wise count rates for Quadrant C Data is divided into 100 sec bins |
 |
 |
| Module-wise count rates for Quadrant D Data is divided into 100 sec bins |
 |
 |
| Parameter | Plot |
|---|---|
| CZT HV Monitor |  |
| D_VDD | 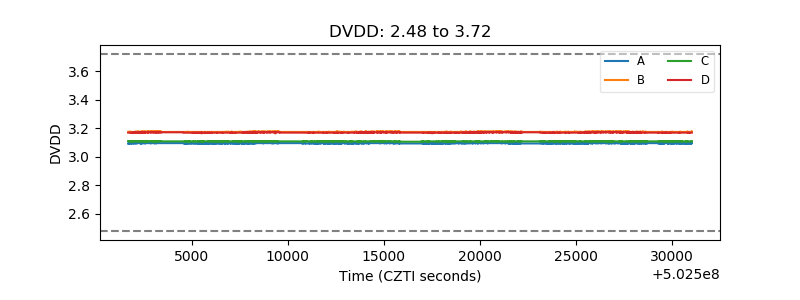 |
| Temperature 1 | 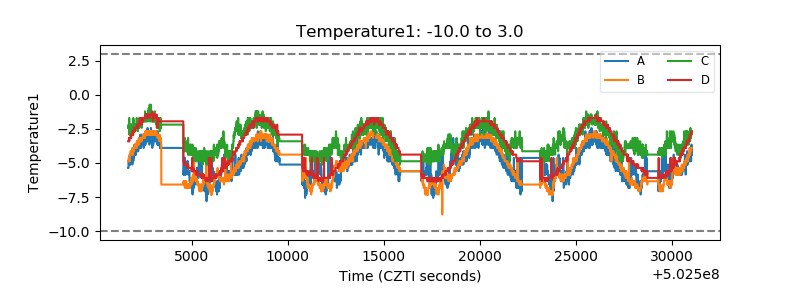 |
| Veto HV Monitor | 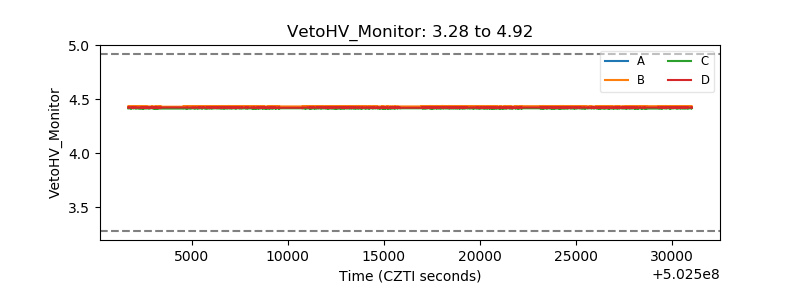 |
| Veto LLD | 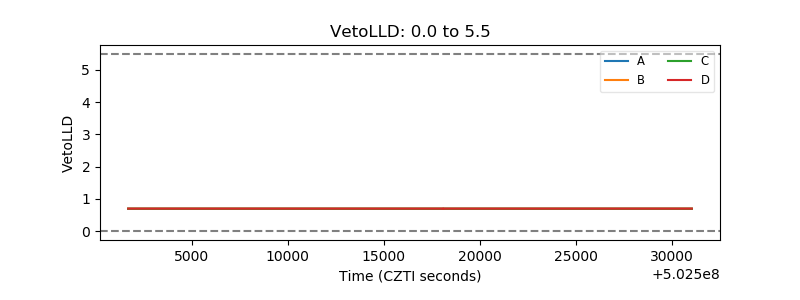 |
| Alpha Counter | 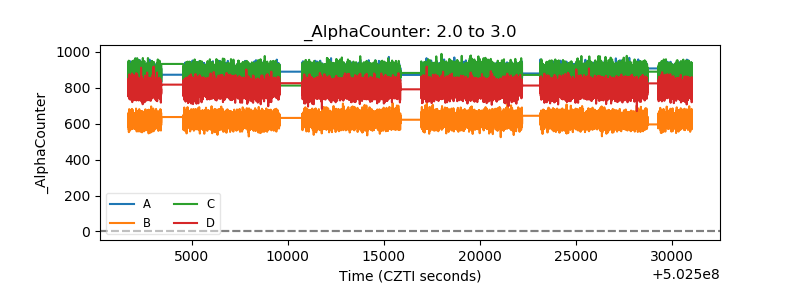 |
| _CPM_Rate | 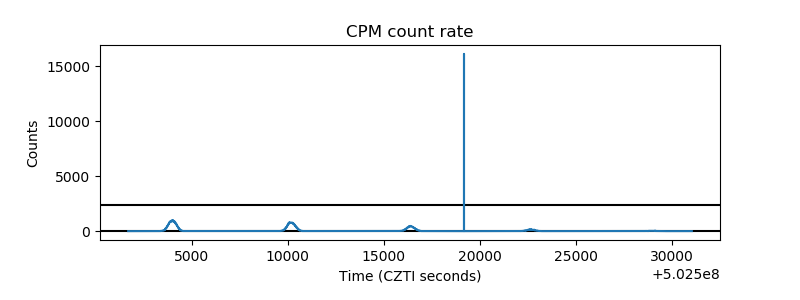 |
| CZT Counter | 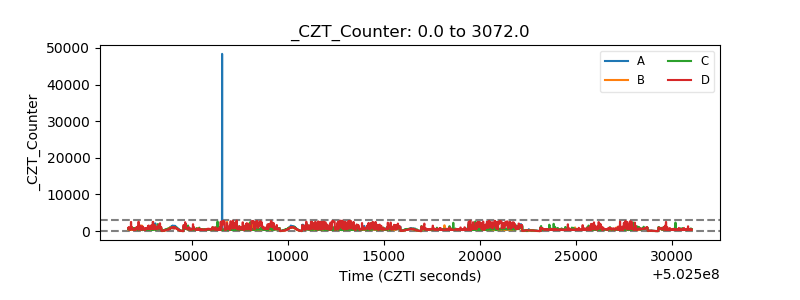 |
| +2.5 Volts monitor |  |
| +5 Volts monitor | 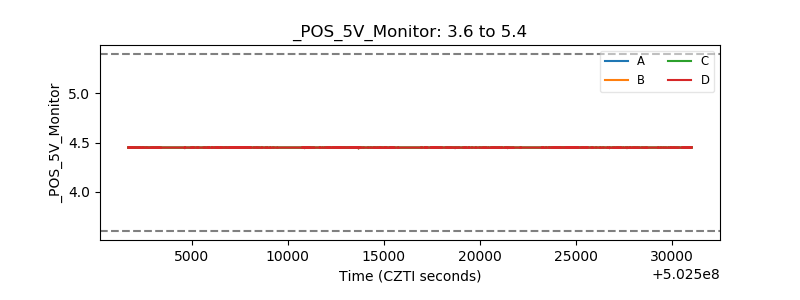 |
| _ROLL_ROT | 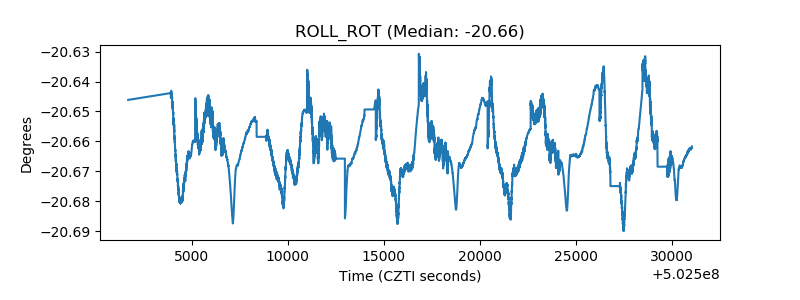 |
| _Roll_DEC | 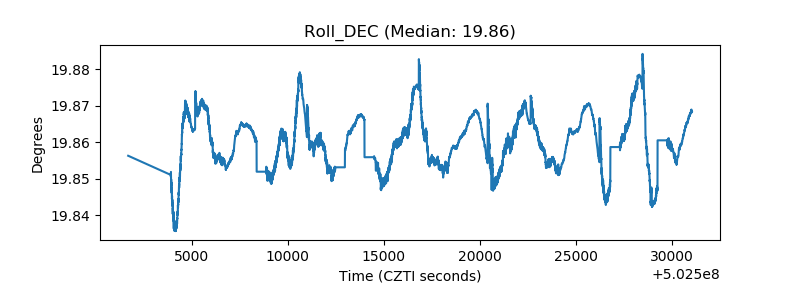 |
| _Roll_RA | 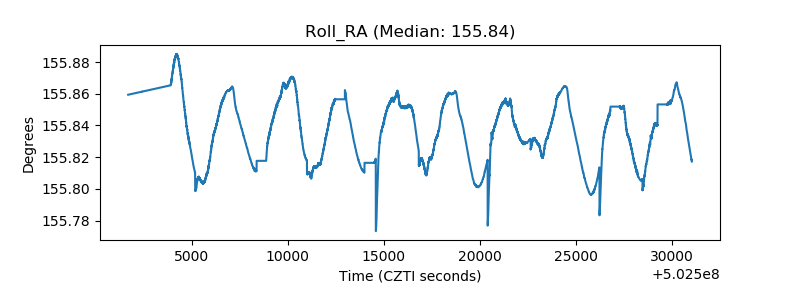 |
| Veto Counter | 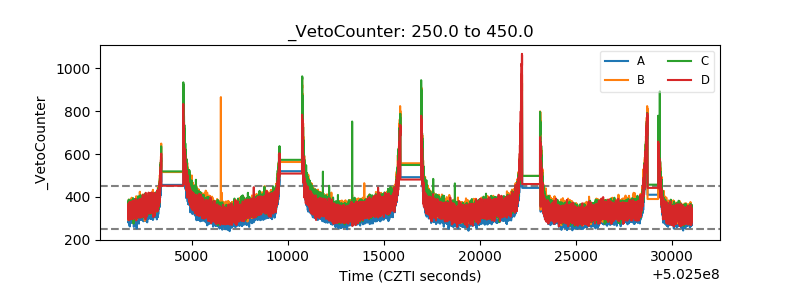 |