| Param | Original file | Final file |
|---|---|---|
| Filename | modeM0/AS1A14_025T01_9000006530_55102cztM0_level2.fits | modeM0/AS1A14_025T01_9000006530_55102cztM0_level2_quad_clean.evt |
| Size (bytes) | 442,252,800 | 112,124,160 |
| Size | 421.8 MB | 106.9 MB |
| Events in quadrant A | 3,306,206 | 730,907 |
| Events in quadrant B | 3,477,395 | 789,978 |
| Events in quadrant C | 3,912,962 | 688,116 |
| Events in quadrant D | 5,060,420 | 637,834 |
| Mode M0 | |||
|---|---|---|---|
| Quadrant | BADHDUFLAG | Total packets | Discarded packets |
| A | 0 | 15927 | 0 |
| B | 0 | 16170 | 0 |
| C | 0 | 17585 | 0 |
| D | 0 | 20519 | 1 |
| Mode SS | |||
|---|---|---|---|
| Quadrant | BADHDUFLAG | Total packets | Discarded packets |
| A | 0 | 158 | 0 |
| B | 0 | 158 | 0 |
| C | 0 | 158 | 0 |
| D | 0 | 158 | 0 |
| Quadrant | Total seconds | Saturated seconds | Saturation percentage |
|---|---|---|---|
| A | 7888 | 5 | 0.063387% |
| B | 7888 | 11 | 0.139452% |
| C | 7888 | 111 | 1.407201% |
| D | 7887 | 285 | 3.613541% |
Noise dominated data is calculated using 1-second bins in cleaned event files. If a bin has >2000 counts, and if more than 50% of those come from <1% of pixels, then it is considered to be noise-dominated and hence unusable.
| Quadrant | # 1 sec bins | Bins with >0 counts | Bins with >2000 counts | High rate bins dominated by noise | Noise dominated (total time) | Noise dominated (detector-on time) | Marked lightcurve |
|---|---|---|---|---|---|---|---|
| A | 7888 | 7888 | 2 | 2 | 0.03% | 0.03% | 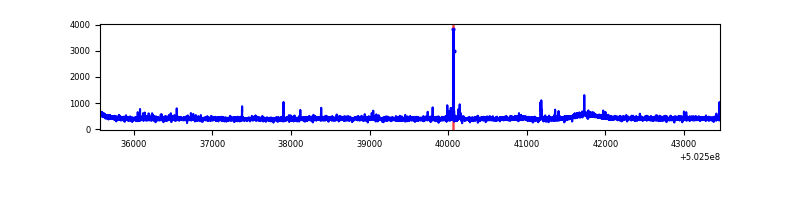 |
| B | 7888 | 7888 | 5 | 5 | 0.06% | 0.06% | 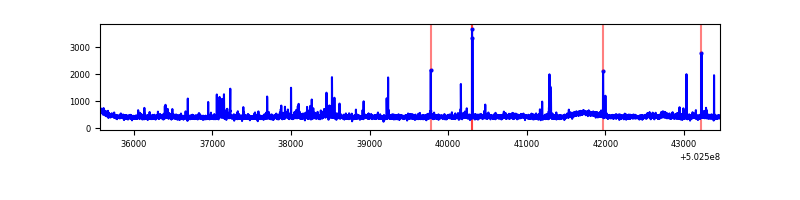 |
| C | 7888 | 7888 | 88 | 88 | 1.12% | 1.12% | 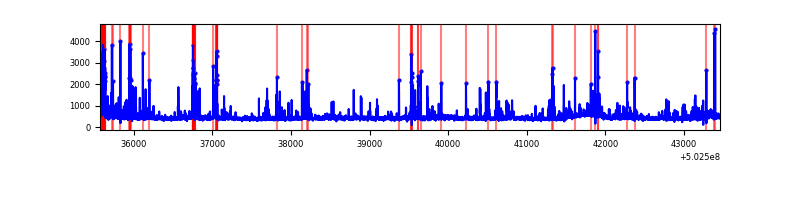 |
| D | 7887 | 7887 | 255 | 255 | 3.23% | 3.23% | 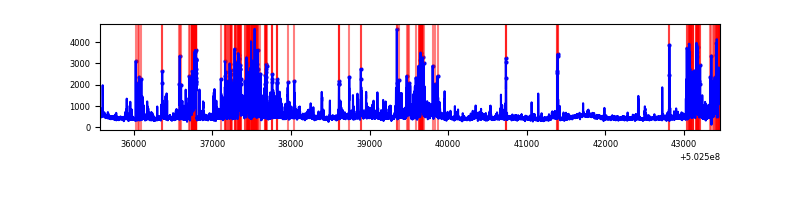 |
Top three noisy pixels from each quadrant. If the there are fewer than three noisy pixels in the level2.evt file, extra rows are filled as -1
| Pixel properties | Quadrant properties | ||||||
|---|---|---|---|---|---|---|---|
| Quadrant | DetID | PixID | Counts | Sigma | Mean | Median | Sigma |
| A | 7 | 190 | 30288 | 142.98 | 831 | 809 | 206.2 |
| A | 4 | 3 | 28112 | 132.42 | 831 | 809 | 206.2 |
| A | 13 | 254 | 15727 | 72.35 | 831 | 809 | 206.2 |
| B | 4 | 21 | 59542 | 330.27 | 819 | 789 | 177.9 |
| B | 10 | 245 | 42659 | 235.36 | 819 | 789 | 177.9 |
| B | 5 | 185 | 40869 | 225.3 | 819 | 789 | 177.9 |
| C | 13 | 3 | 453993 | 2069.23 | 798 | 791 | 219.0 |
| C | 12 | 250 | 109246 | 495.18 | 798 | 791 | 219.0 |
| C | 6 | 223 | 104715 | 474.5 | 798 | 791 | 219.0 |
| D | 6 | 239 | 881059 | 3966.04 | 791 | 759 | 222.0 |
| D | 2 | 249 | 249311 | 1119.81 | 791 | 759 | 222.0 |
| D | 7 | 96 | 237253 | 1065.48 | 791 | 759 | 222.0 |
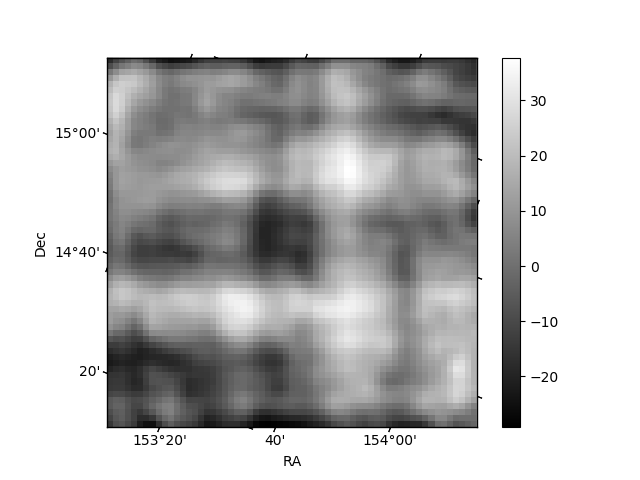
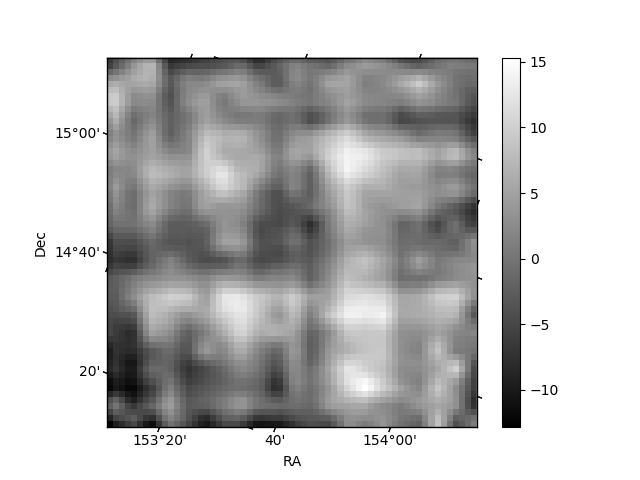
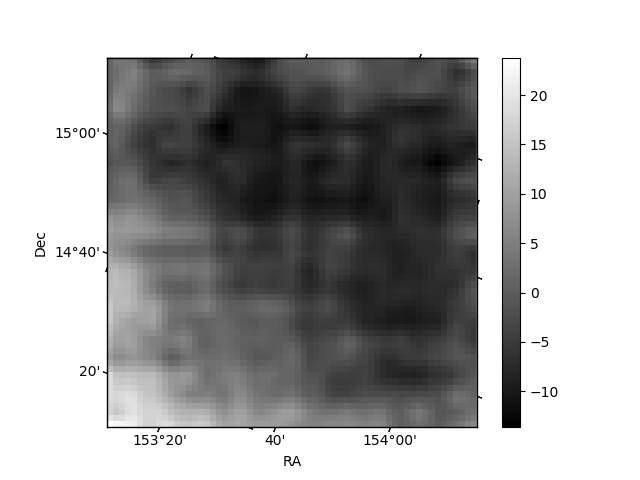
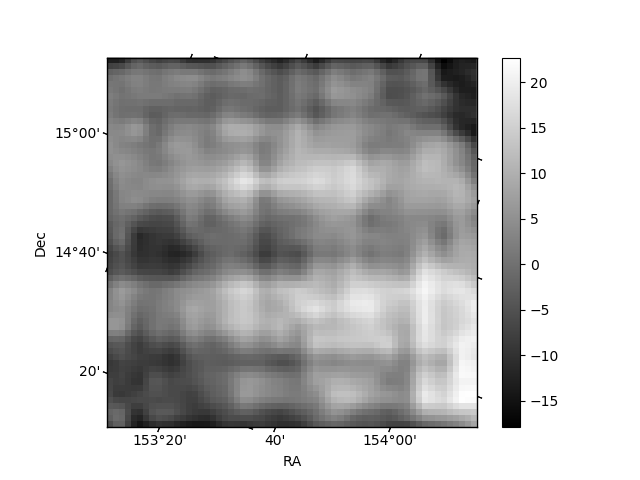
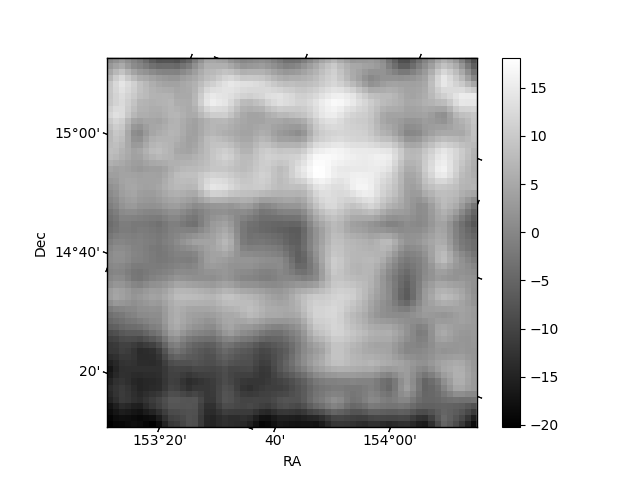
Histogram calculated using DETX and DETY for each event in the final _common_clean file
| Quadrant A | 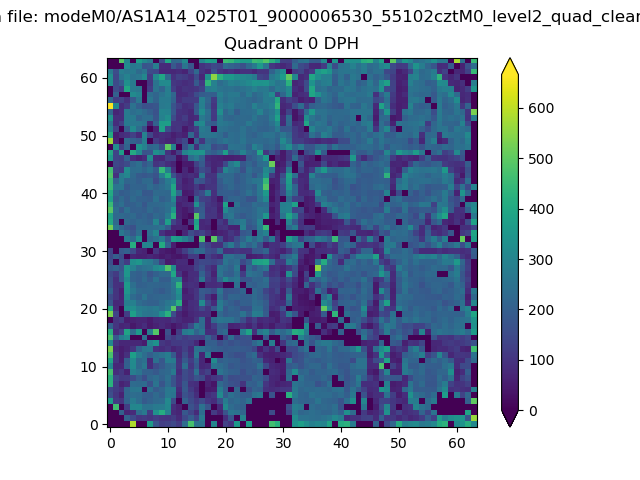 |
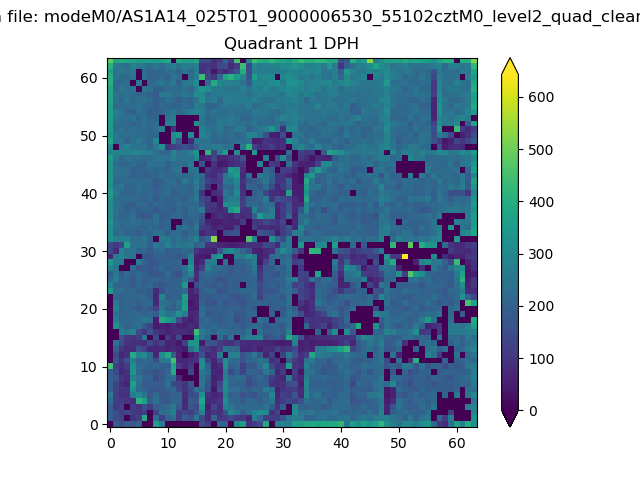 |
Quadrant B |
|---|---|---|---|
| Quadrant D | 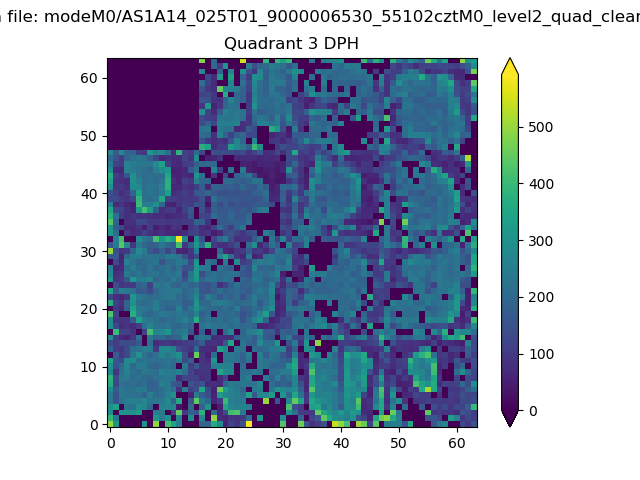 |
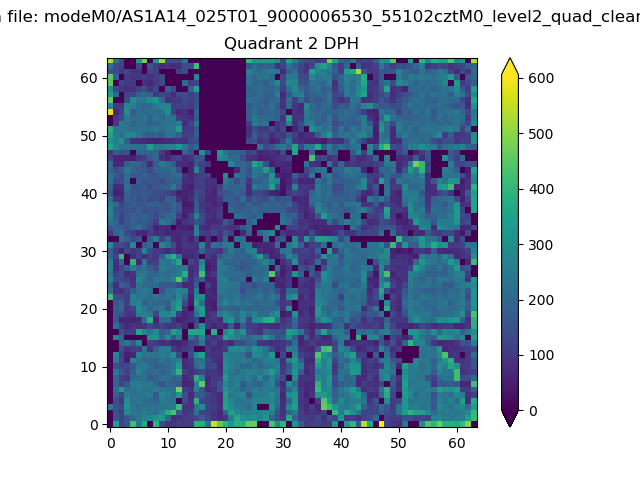 |
Quadrant C |
| Plot type | Count rate plots | Images |
|---|---|---|
| Comparison with Poisson distribution Blue bars denote a histogram of data divided into 1 sec bins. Red curve is a Poisson curve with rate = median count rate of data. |
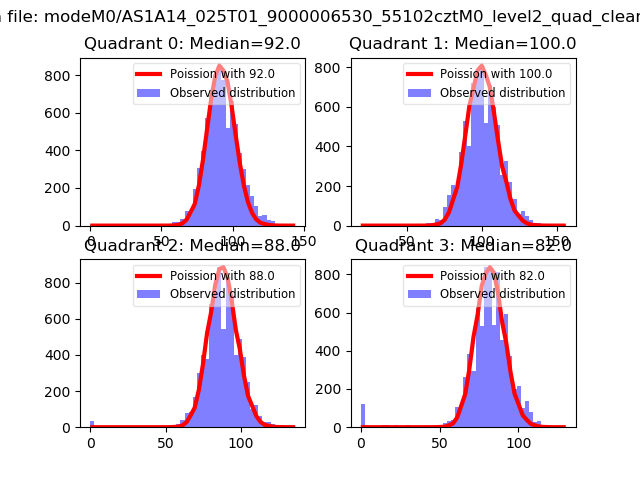 |
 |
| Quadrant-wise count rates Data is divided into 100 sec bins |
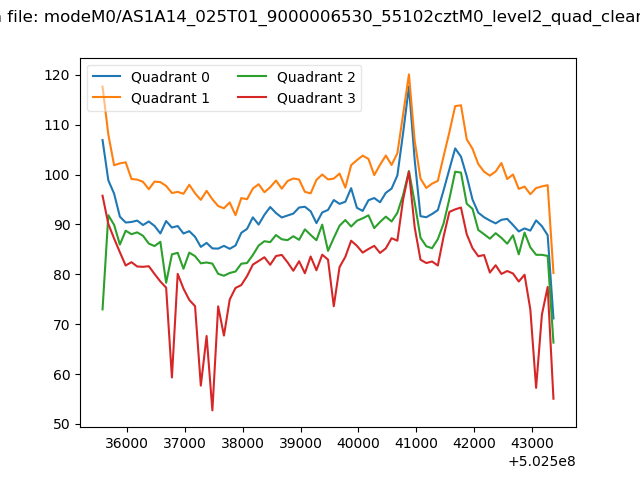 |
|
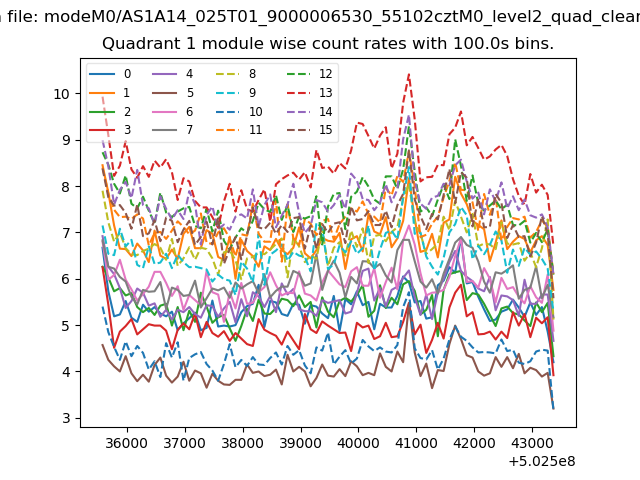
| Module-wise count rates for Quadrant A Data is divided into 100 sec bins |
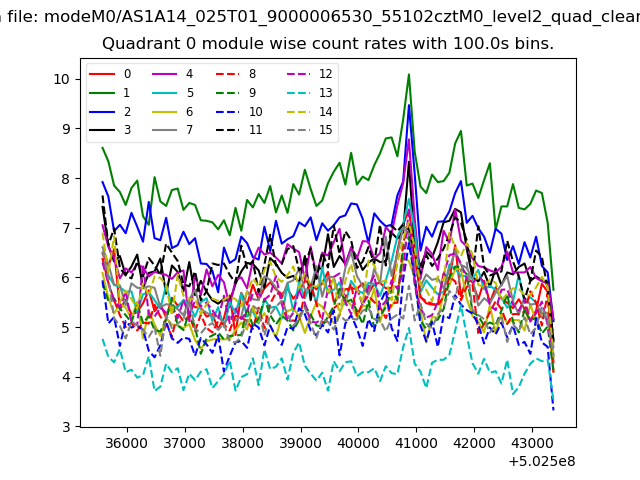 |
 |
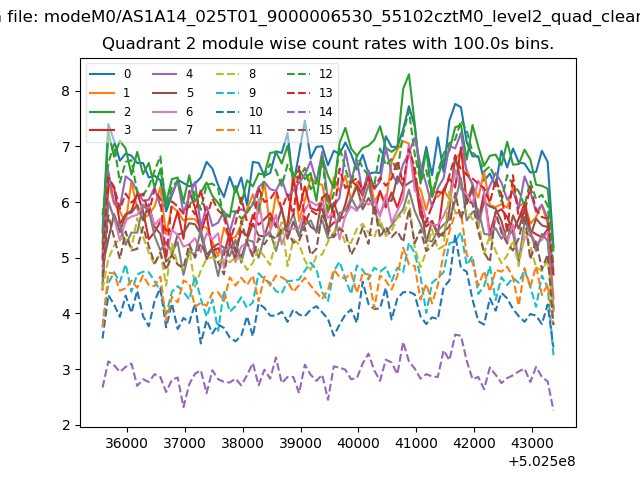
| Module-wise count rates for Quadrant B Data is divided into 100 sec bins |
 |
 |
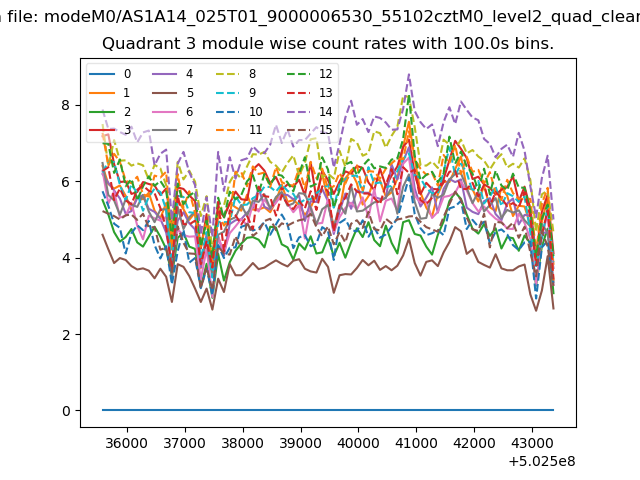
| Module-wise count rates for Quadrant C Data is divided into 100 sec bins |
 |
 |
| Module-wise count rates for Quadrant D Data is divided into 100 sec bins |
 |
 |
| Parameter | Plot |
|---|---|
| CZT HV Monitor | 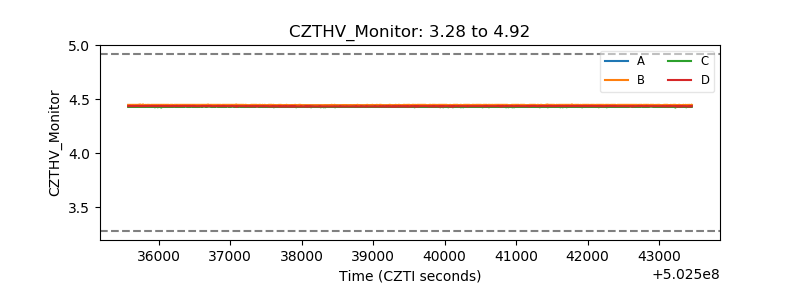 |
| D_VDD | 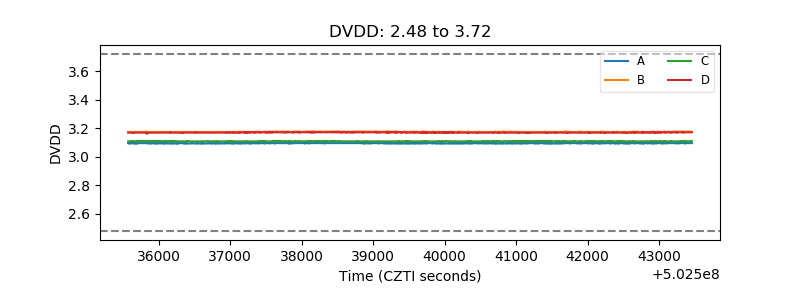 |
| Temperature 1 | 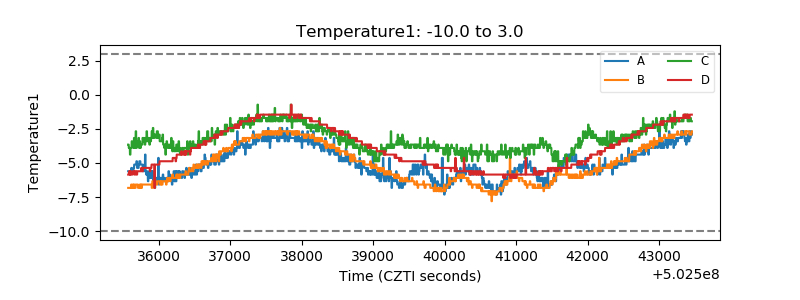 |
| Veto HV Monitor | 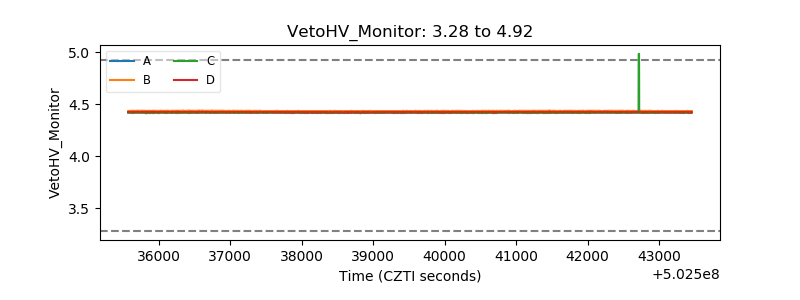 |
| Veto LLD | 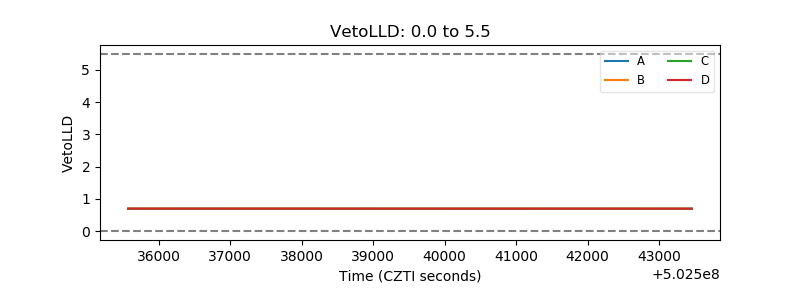 |
| Alpha Counter | 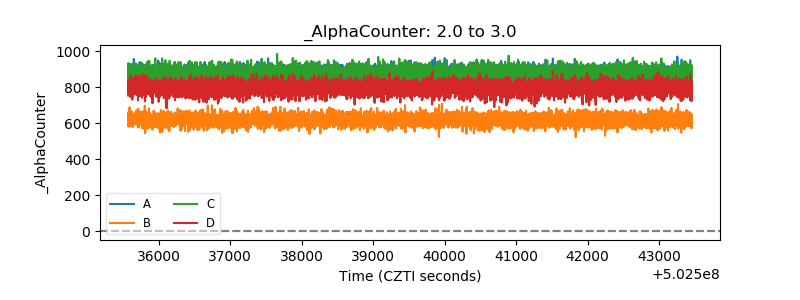 |
| _CPM_Rate | 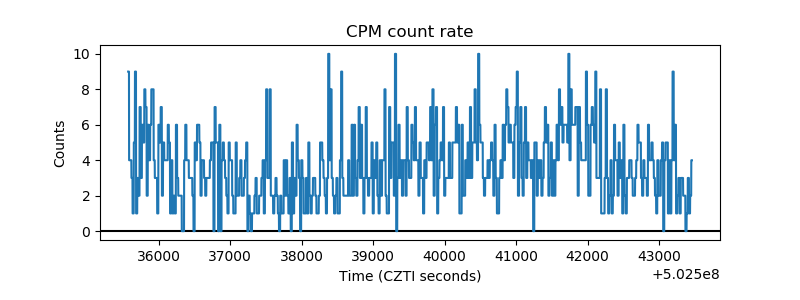 |
| CZT Counter | 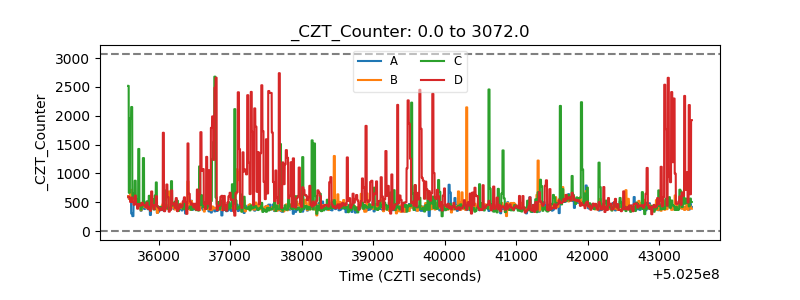 |
| +2.5 Volts monitor | 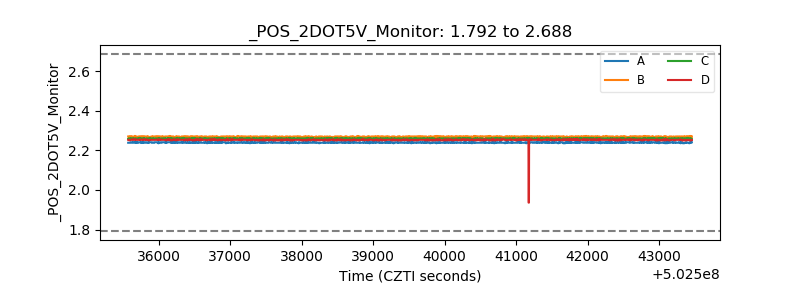 |
| +5 Volts monitor |  |
| _ROLL_ROT | 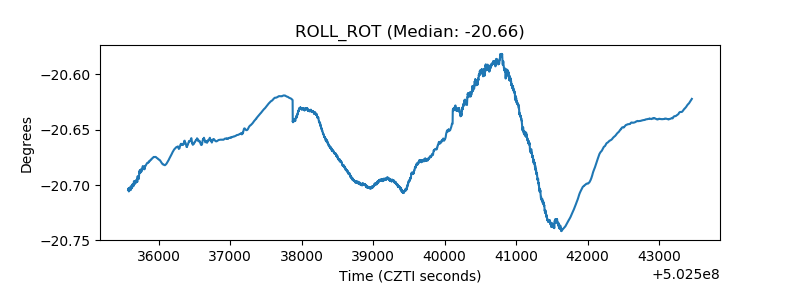 |
| _Roll_DEC | 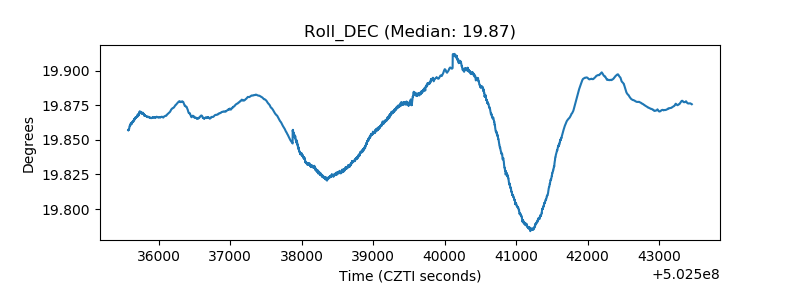 |
| _Roll_RA | 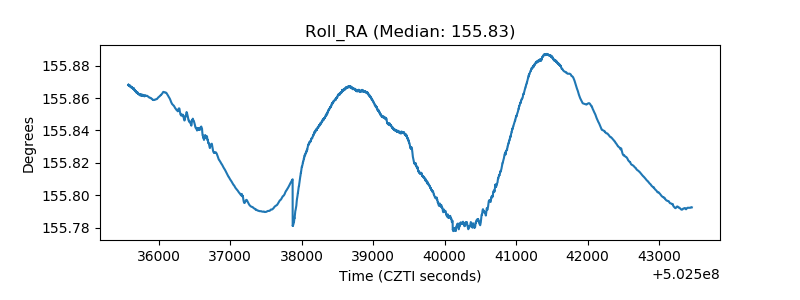 |
| Veto Counter | 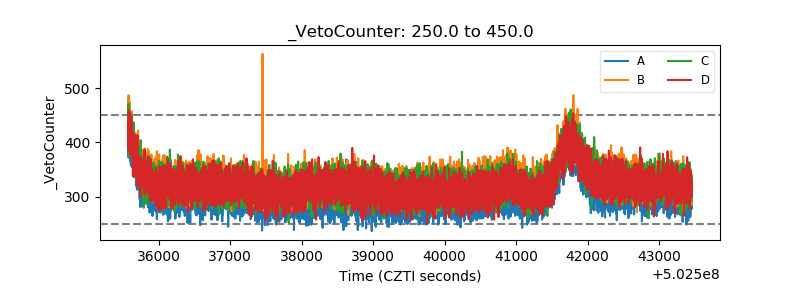 |