| Param | Original file | Final file |
|---|---|---|
| Filename | modeM0/AS1A14_025T01_9000006530_55103cztM0_level2.fits | modeM0/AS1A14_025T01_9000006530_55103cztM0_level2_quad_clean.evt |
| Size (bytes) | 470,105,280 | 115,171,200 |
| Size | 448.3 MB | 109.8 MB |
| Events in quadrant A | 3,686,843 | 750,844 |
| Events in quadrant B | 3,599,361 | 814,122 |
| Events in quadrant C | 4,001,002 | 713,823 |
| Events in quadrant D | 5,484,540 | 645,331 |
| Mode M0 | |||
|---|---|---|---|
| Quadrant | BADHDUFLAG | Total packets | Discarded packets |
| A | 0 | 17143 | 3 |
| B | 0 | 16778 | 0 |
| C | 0 | 17999 | 3 |
| D | 0 | 22064 | 1 |
| Mode SS | |||
|---|---|---|---|
| Quadrant | BADHDUFLAG | Total packets | Discarded packets |
| A | 0 | 162 | 0 |
| B | 0 | 162 | 0 |
| C | 0 | 162 | 0 |
| D | 0 | 162 | 0 |
| Quadrant | Total seconds | Saturated seconds | Saturation percentage |
|---|---|---|---|
| A | 8100 | 51 | 0.629630% |
| B | 8103 | 15 | 0.185117% |
| C | 8101 | 58 | 0.715961% |
| D | 8102 | 451 | 5.566527% |
Noise dominated data is calculated using 1-second bins in cleaned event files. If a bin has >2000 counts, and if more than 50% of those come from <1% of pixels, then it is considered to be noise-dominated and hence unusable.
| Quadrant | # 1 sec bins | Bins with >0 counts | Bins with >2000 counts | High rate bins dominated by noise | Noise dominated (total time) | Noise dominated (detector-on time) | Marked lightcurve |
|---|---|---|---|---|---|---|---|
| A | 8102 | 8101 | 43 | 43 | 0.53% | 0.53% | 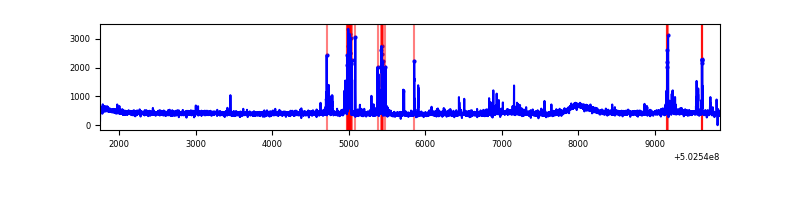 |
| B | 8103 | 8103 | 7 | 7 | 0.09% | 0.09% | 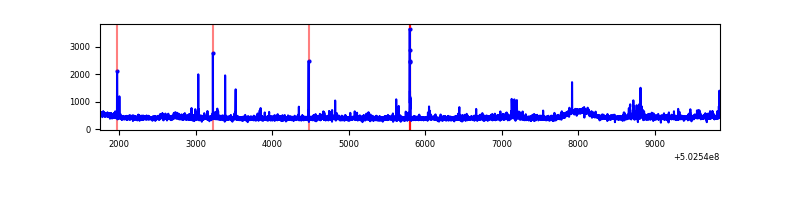 |
| C | 8103 | 8102 | 46 | 46 | 0.57% | 0.57% | 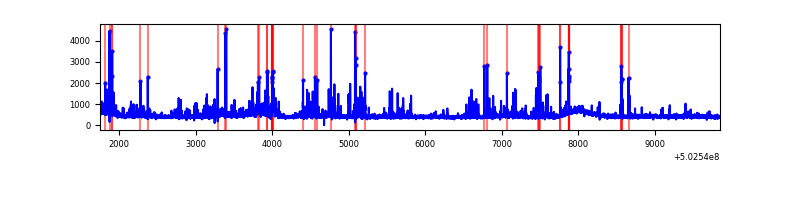 |
| D | 8103 | 8103 | 383 | 383 | 4.73% | 4.73% | 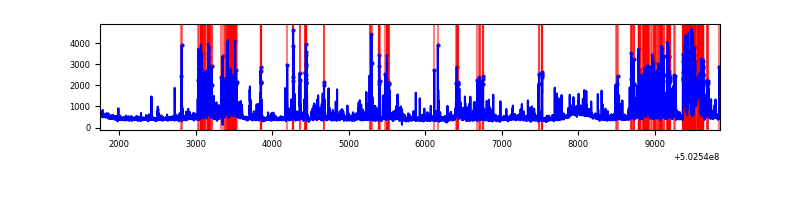 |
Top three noisy pixels from each quadrant. If the there are fewer than three noisy pixels in the level2.evt file, extra rows are filled as -1
| Pixel properties | Quadrant properties | ||||||
|---|---|---|---|---|---|---|---|
| Quadrant | DetID | PixID | Counts | Sigma | Mean | Median | Sigma |
| A | 0 | 8 | 222152 | 1033.25 | 867 | 845 | 214.2 |
| A | 7 | 14 | 73911 | 341.13 | 867 | 845 | 214.2 |
| A | 4 | 3 | 29834 | 135.35 | 867 | 845 | 214.2 |
| B | 5 | 185 | 55717 | 297.81 | 852 | 819 | 184.3 |
| B | 10 | 245 | 41829 | 222.47 | 852 | 819 | 184.3 |
| B | 5 | 172 | 33269 | 176.04 | 852 | 819 | 184.3 |
| C | 13 | 3 | 373743 | 1645.0 | 837 | 834 | 226.7 |
| C | 9 | 38 | 132755 | 581.94 | 837 | 834 | 226.7 |
| C | 6 | 223 | 97653 | 427.09 | 837 | 834 | 226.7 |
| D | 6 | 239 | 1221246 | 5312.59 | 819 | 786 | 229.7 |
| D | 12 | 6 | 178419 | 773.23 | 819 | 786 | 229.7 |
| D | 10 | 181 | 165010 | 714.86 | 819 | 786 | 229.7 |
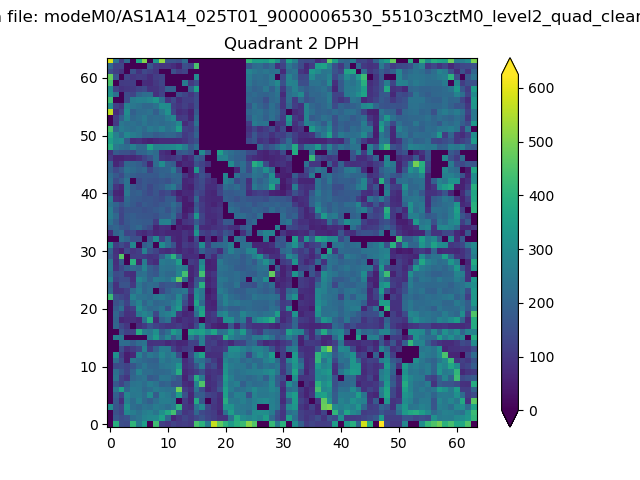
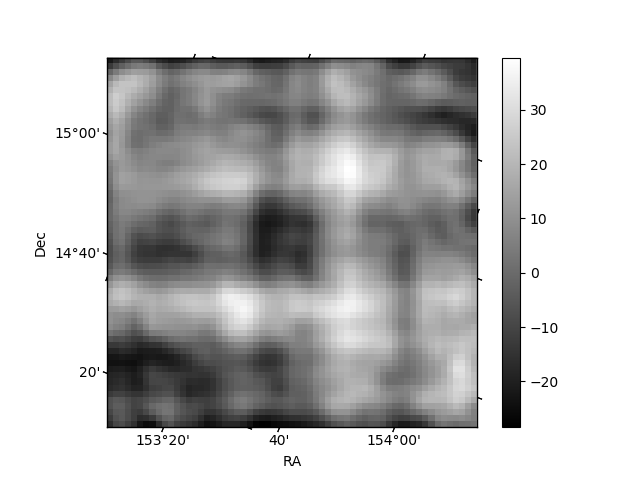
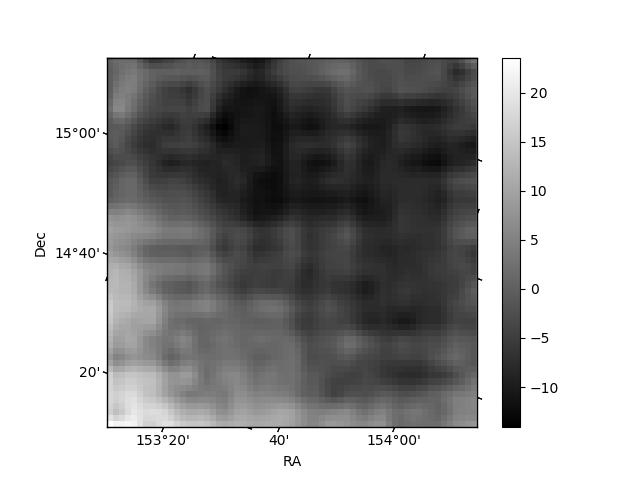
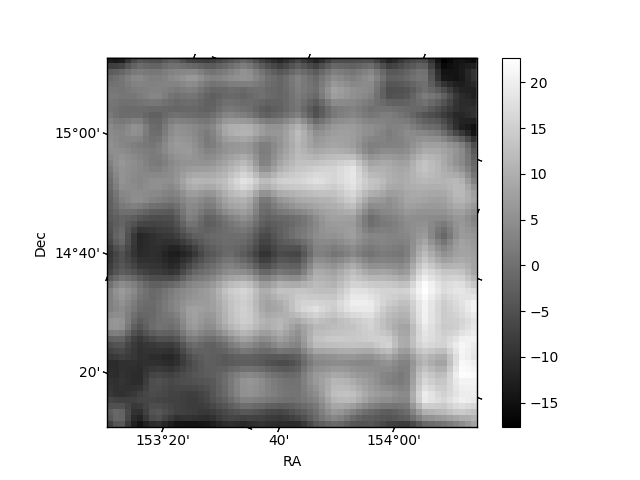
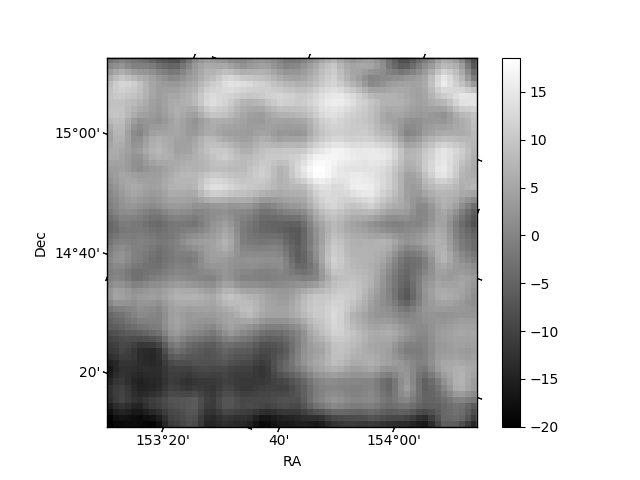
Histogram calculated using DETX and DETY for each event in the final _common_clean file
| Quadrant A | 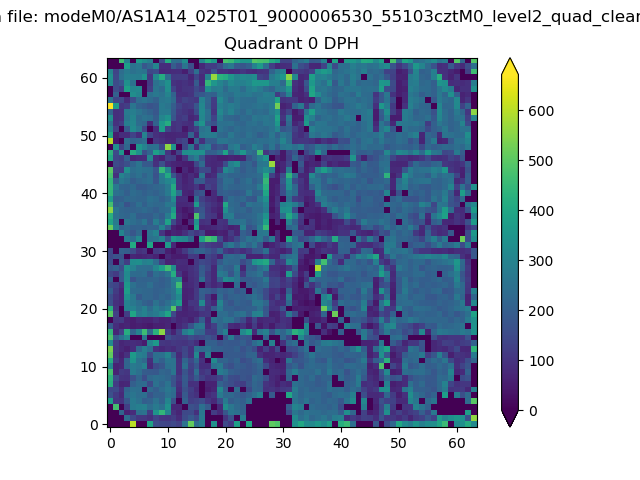 |
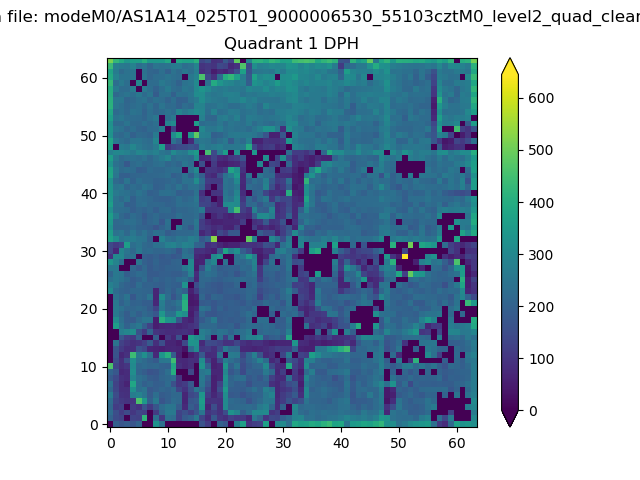 |
Quadrant B |
|---|---|---|---|
| Quadrant D | 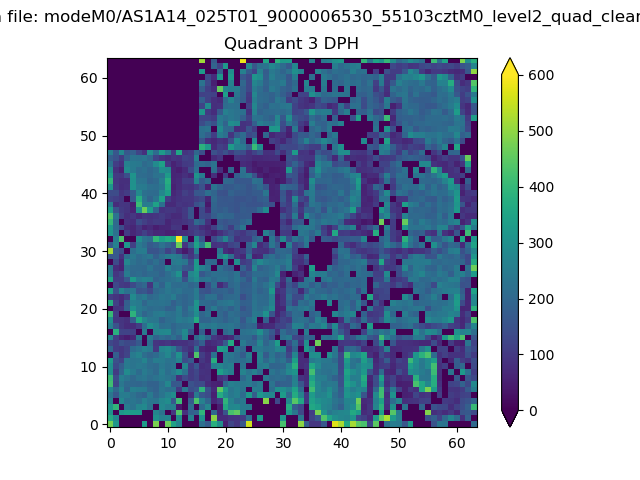 |
 |
Quadrant C |
| Plot type | Count rate plots | Images |
|---|---|---|
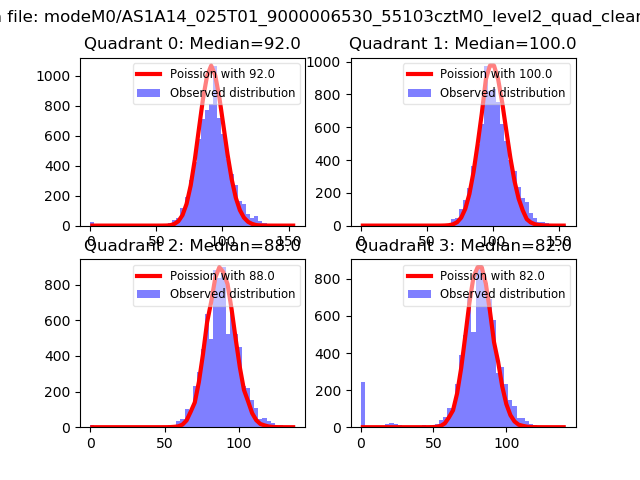
| Comparison with Poisson distribution Blue bars denote a histogram of data divided into 1 sec bins. Red curve is a Poisson curve with rate = median count rate of data. |
 |
 |
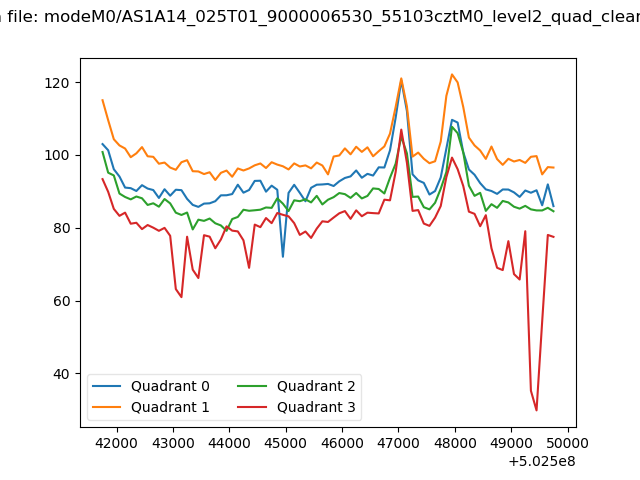
| Quadrant-wise count rates Data is divided into 100 sec bins |
 |
|
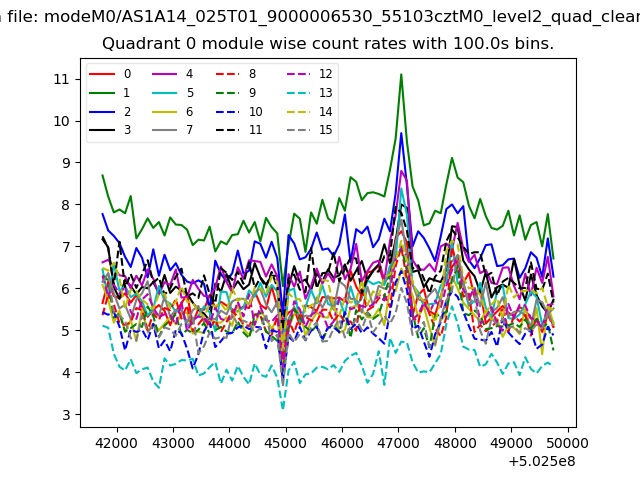
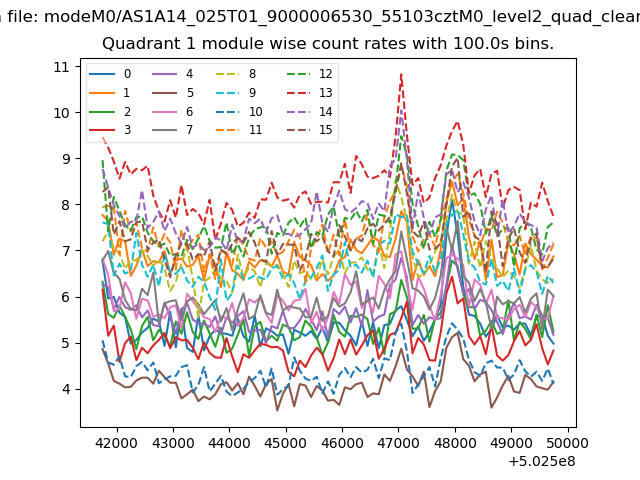
| Module-wise count rates for Quadrant A Data is divided into 100 sec bins |
 |
 |
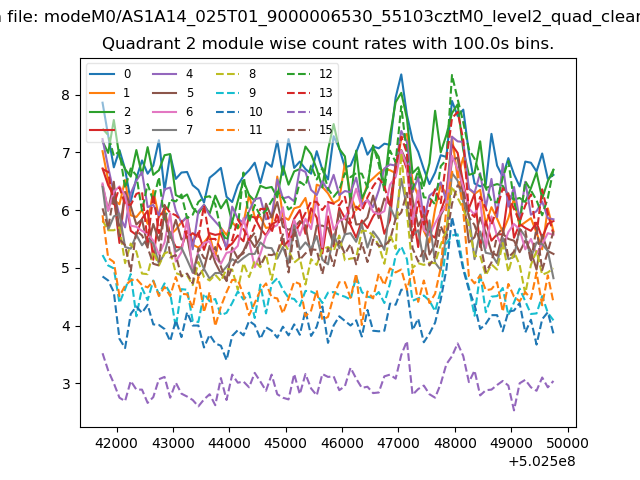
| Module-wise count rates for Quadrant B Data is divided into 100 sec bins |
 |
 |
| Module-wise count rates for Quadrant C Data is divided into 100 sec bins |
 |
 |
| Module-wise count rates for Quadrant D Data is divided into 100 sec bins |
 |
 |
| Parameter | Plot |
|---|---|
| CZT HV Monitor | 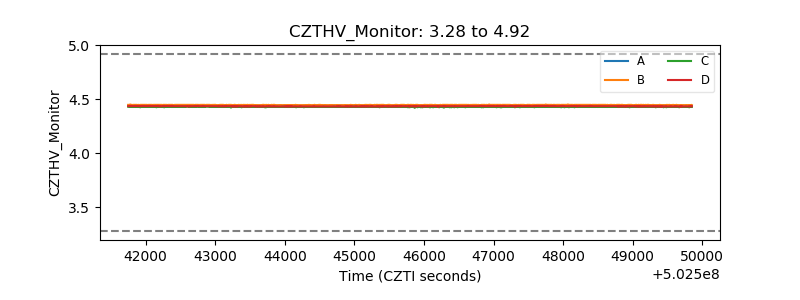 |
| D_VDD |  |
| Temperature 1 |  |
| Veto HV Monitor | 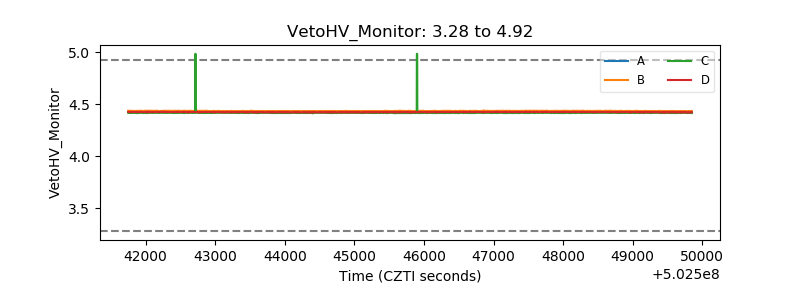 |
| Veto LLD |  |
| Alpha Counter | 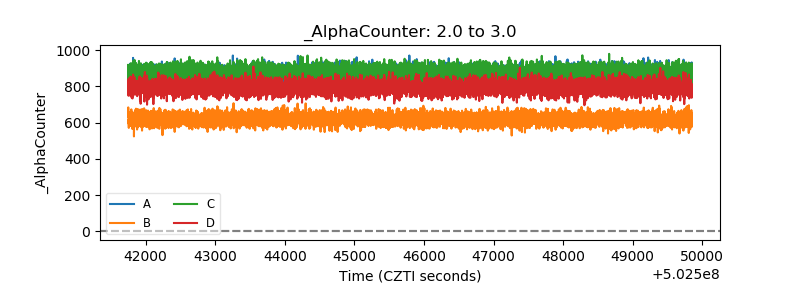 |
| _CPM_Rate | 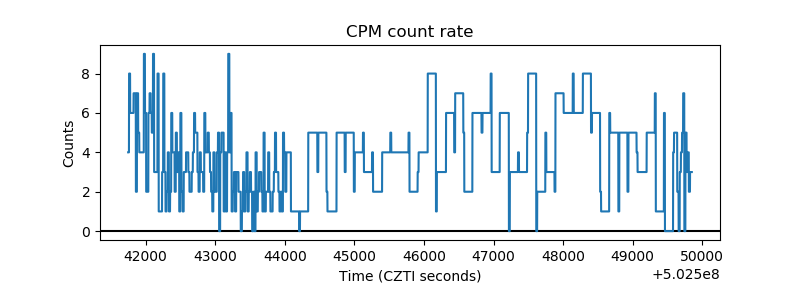 |
| CZT Counter | 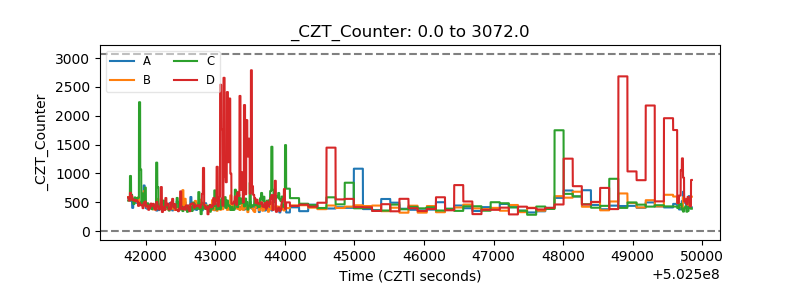 |
| +2.5 Volts monitor |  |
| +5 Volts monitor | 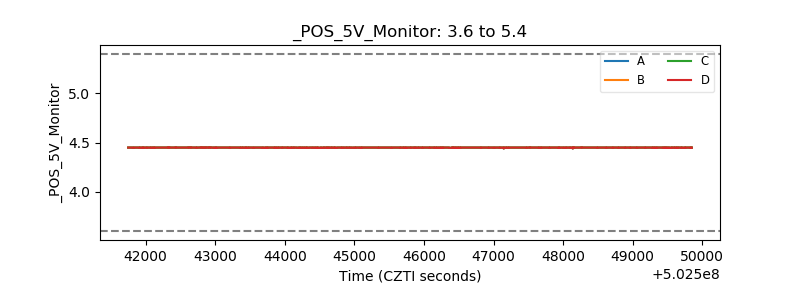 |
| _ROLL_ROT | 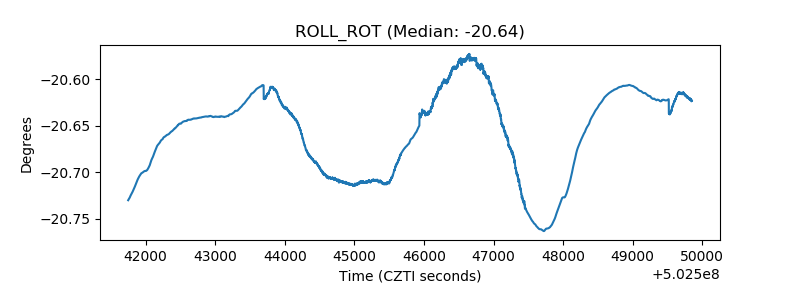 |
| _Roll_DEC | 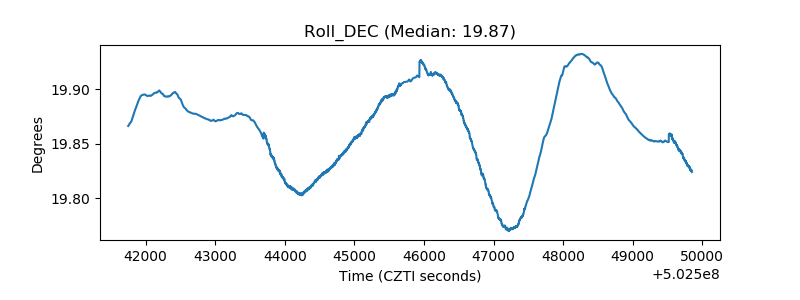 |
| _Roll_RA | 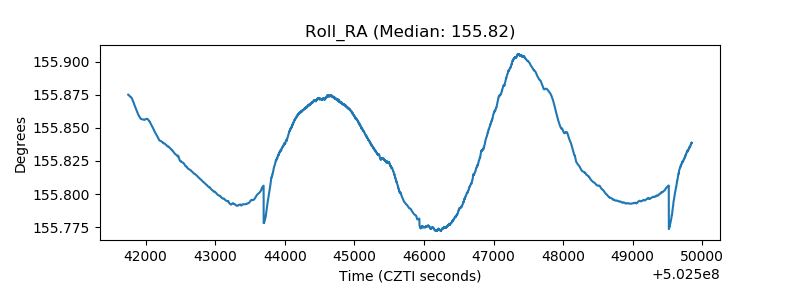 |
| Veto Counter | 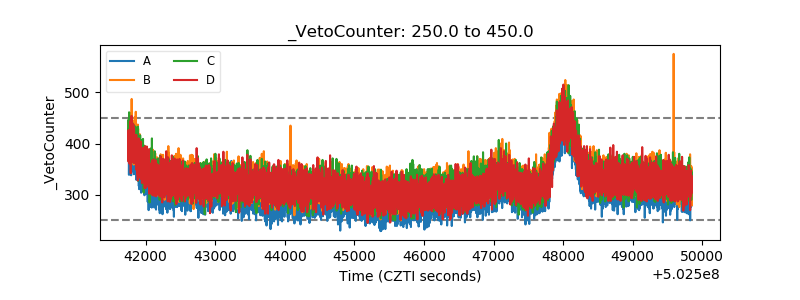 |