| Param | Original file | Final file |
|---|---|---|
| Filename | modeM0/AS1A14_025T01_9000006530_55109cztM0_level2.fits | modeM0/AS1A14_025T01_9000006530_55109cztM0_level2_quad_clean.evt |
| Size (bytes) | 12,957,120 | 4,711,680 |
| Size | 12.4 MB | 4.5 MB |
| Events in quadrant A | 146,368 | 34,391 |
| Events in quadrant B | 140,341 | 33,025 |
| Events in quadrant C | 123,254 | 34,128 |
| Events in quadrant D | 46,283 | 9,302 |
| Mode M0 | |||
|---|---|---|---|
| Quadrant | BADHDUFLAG | Total packets | Discarded packets |
| A | 0 | 641 | 0 |
| B | 0 | 577 | 0 |
| C | 0 | 538 | 0 |
| D | 0 | 195 | 0 |
| Mode SS | |||
|---|---|---|---|
| Quadrant | BADHDUFLAG | Total packets | Discarded packets |
| A | 0 | 51 | 0 |
| B | 0 | 58 | 0 |
| C | 0 | 57 | 0 |
| D | 0 | 57 | 0 |
| Mode M9 | |||
|---|---|---|---|
| Quadrant | BADHDUFLAG | Total packets | Discarded packets |
| A | 0 | 2 | 0 |
| B | 0 | 10 | 0 |
| C | 0 | 3 | 0 |
| D | 0 | 10 | 0 |
| Quadrant | Total seconds | Saturated seconds | Saturation percentage |
|---|---|---|---|
| A | 323 | 2 | 0.619195% |
| B | 289 | 1 | 0.346021% |
| C | 273 | 3 | 1.098901% |
| D | 102 | 1 | 0.980392% |
Noise dominated data is calculated using 1-second bins in cleaned event files. If a bin has >2000 counts, and if more than 50% of those come from <1% of pixels, then it is considered to be noise-dominated and hence unusable.
| Quadrant | # 1 sec bins | Bins with >0 counts | Bins with >2000 counts | High rate bins dominated by noise | Noise dominated (total time) | Noise dominated (detector-on time) | Marked lightcurve |
|---|---|---|---|---|---|---|---|
| A | 7644 | 643 | 0 | 0 | 0.00% | 0.00% | 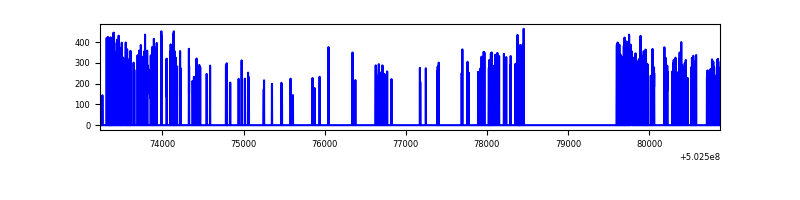 |
| B | 7561 | 576 | 0 | 0 | 0.00% | 0.00% | 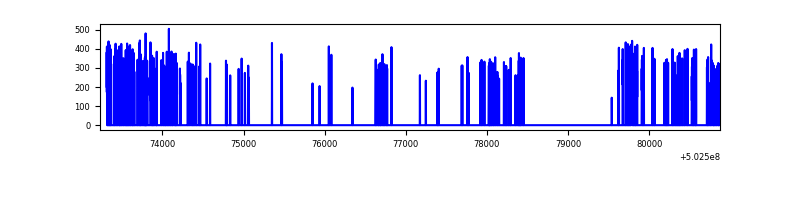 |
| C | 7644 | 543 | 0 | 0 | 0.00% | 0.00% | 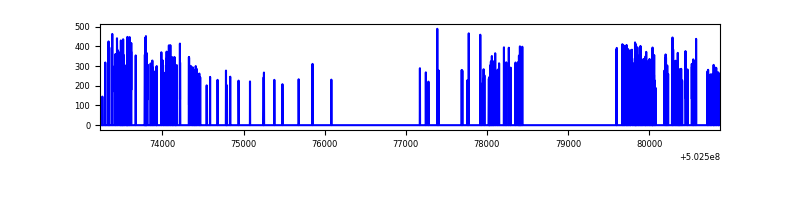 |
| D | 7432 | 202 | 0 | 0 | 0.00% | 0.00% | 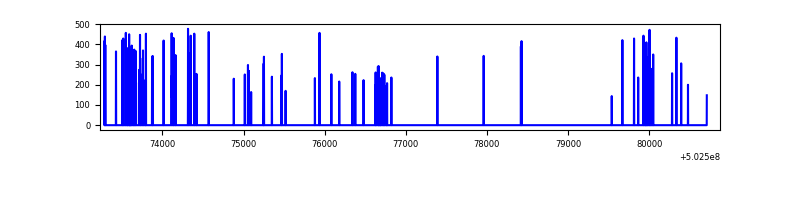 |
Top three noisy pixels from each quadrant. If the there are fewer than three noisy pixels in the level2.evt file, extra rows are filled as -1
| Pixel properties | Quadrant properties | ||||||
|---|---|---|---|---|---|---|---|
| Quadrant | DetID | PixID | Counts | Sigma | Mean | Median | Sigma |
| A | 0 | 8 | 2246 | 206.82 | 36 | 35 | 10.7 |
| A | 5 | 241 | 1857 | 170.43 | 36 | 35 | 10.7 |
| A | 13 | 254 | 614 | 54.16 | 36 | 35 | 10.7 |
| B | 0 | 63 | 9761 | 1113.2 | 31 | 30 | 8.7 |
| B | 4 | 156 | 1557 | 174.69 | 31 | 30 | 8.7 |
| B | 4 | 21 | 936 | 103.64 | 31 | 30 | 8.7 |
| C | 7 | 2 | 2034 | 206.3 | 29 | 29 | 9.7 |
| C | 1 | 16 | 1215 | 122.03 | 29 | 29 | 9.7 |
| C | 12 | 250 | 1028 | 102.79 | 29 | 29 | 9.7 |
| D | 6 | 239 | 2540 | 585.72 | 10 | 9 | 4.3 |
| D | 2 | 31 | 827 | 189.3 | 10 | 9 | 4.3 |
| D | 5 | 173 | 778 | 177.96 | 10 | 9 | 4.3 |
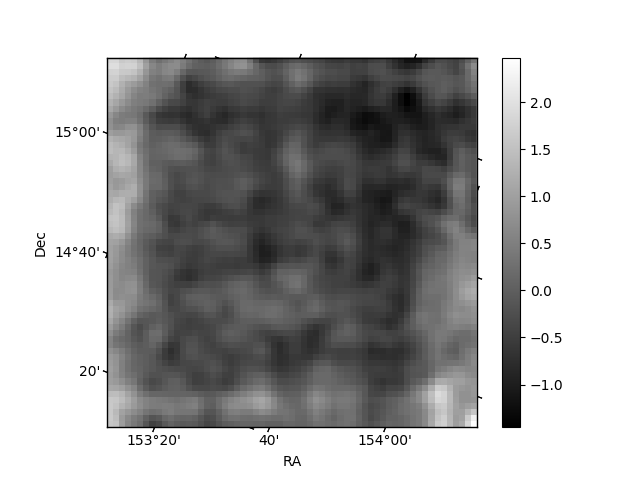
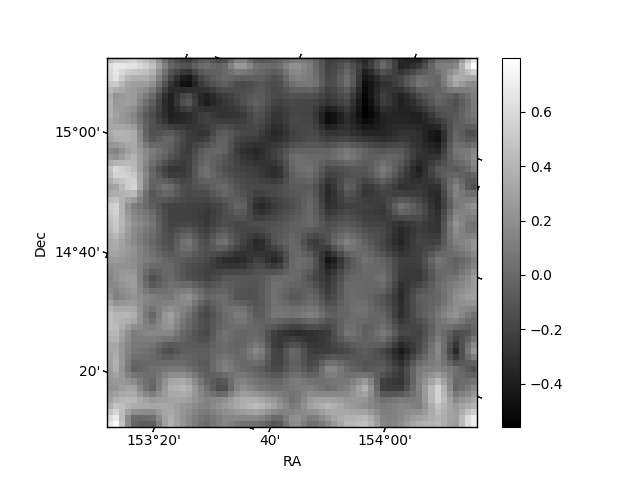
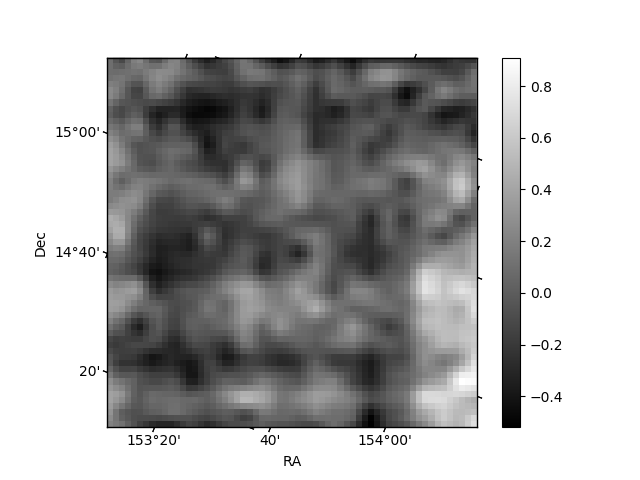
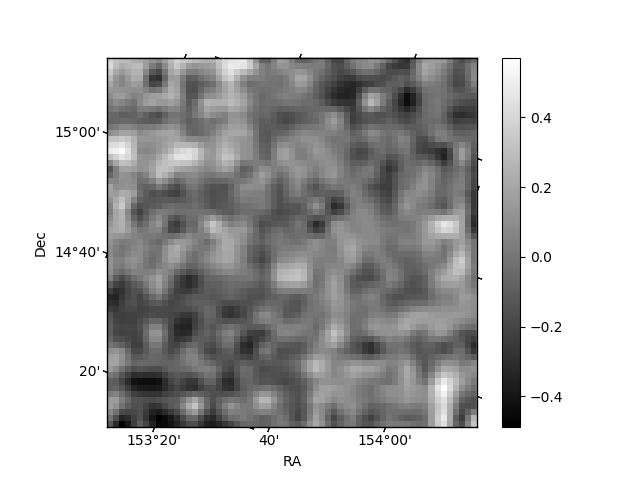
Histogram calculated using DETX and DETY for each event in the final _common_clean file
| Quadrant A | 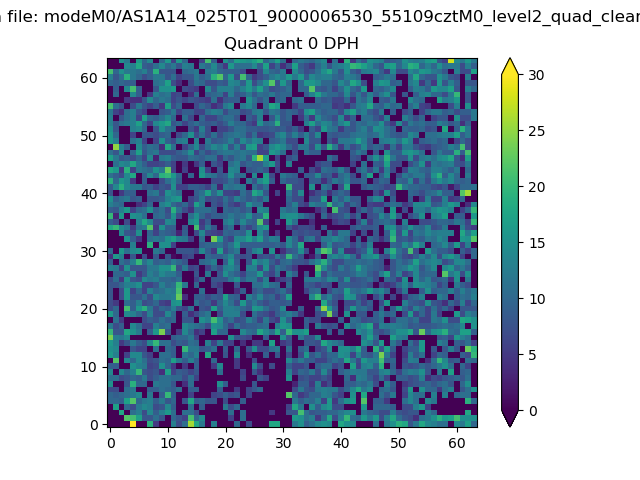 |
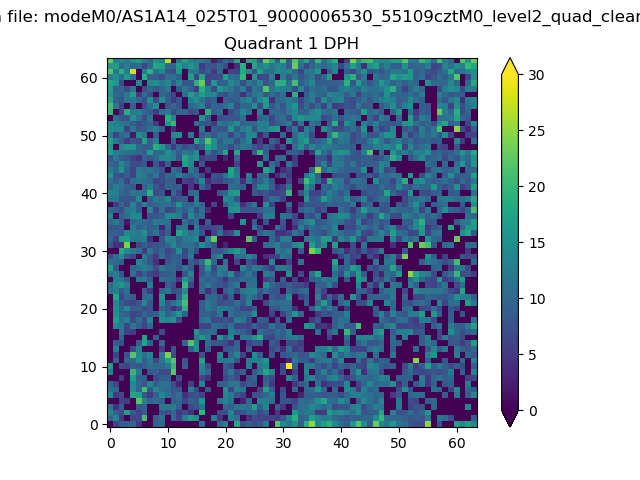 |
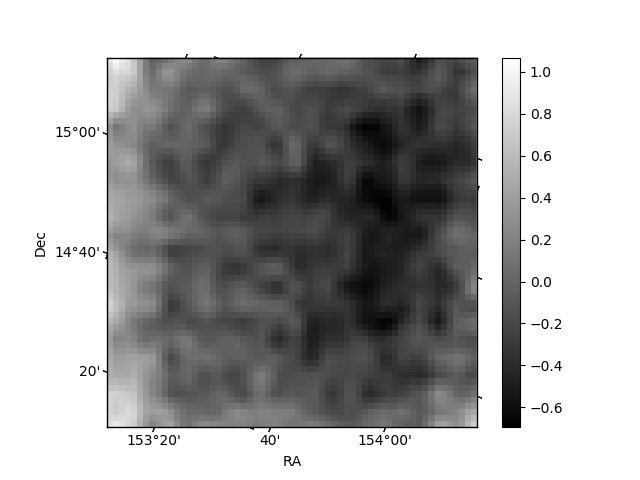
Quadrant B |
|---|---|---|---|
| Quadrant D | 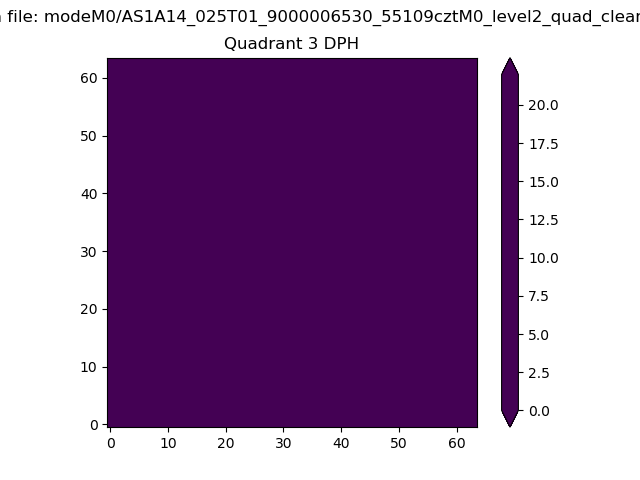 |
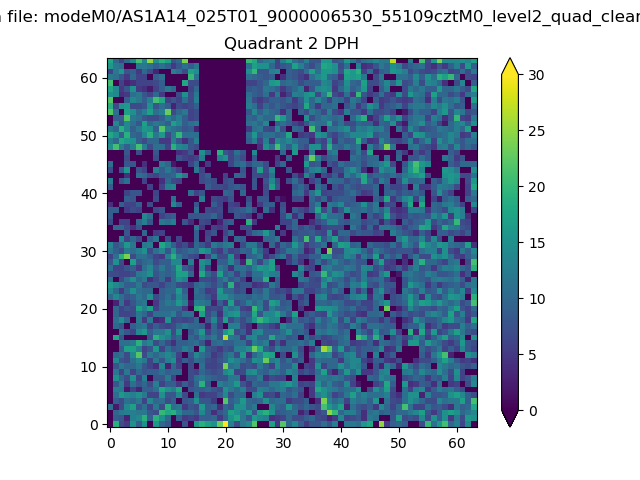 |
Quadrant C |
| Plot type | Count rate plots | Images |
|---|---|---|
| Comparison with Poisson distribution Blue bars denote a histogram of data divided into 1 sec bins. Red curve is a Poisson curve with rate = median count rate of data. |
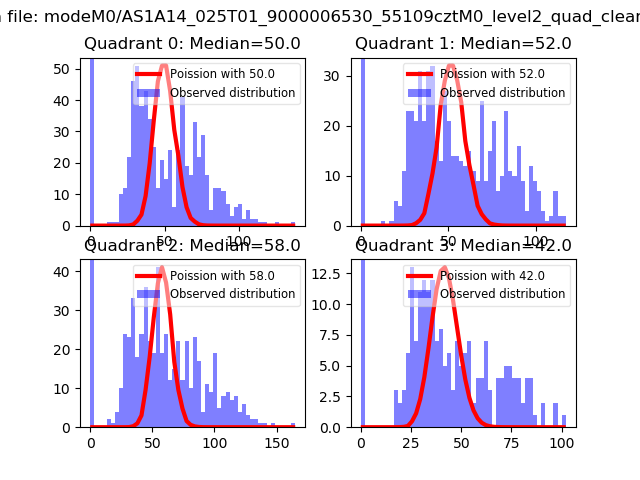 |
 |
| Quadrant-wise count rates Data is divided into 100 sec bins |
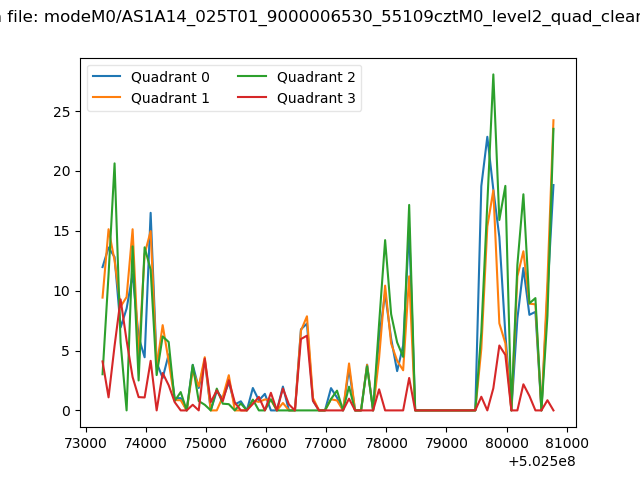 |
|
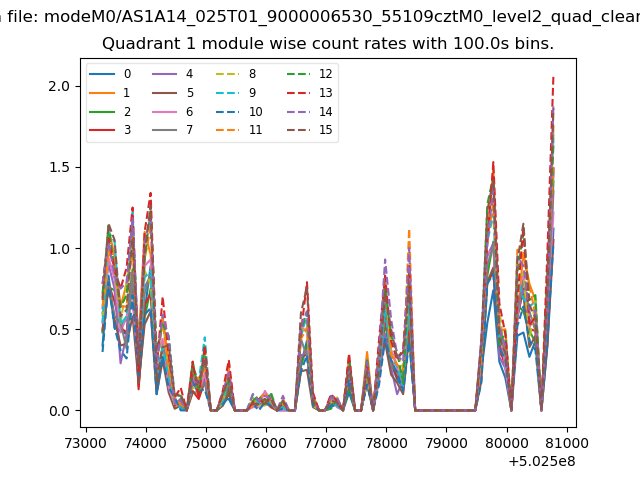
| Module-wise count rates for Quadrant A Data is divided into 100 sec bins |
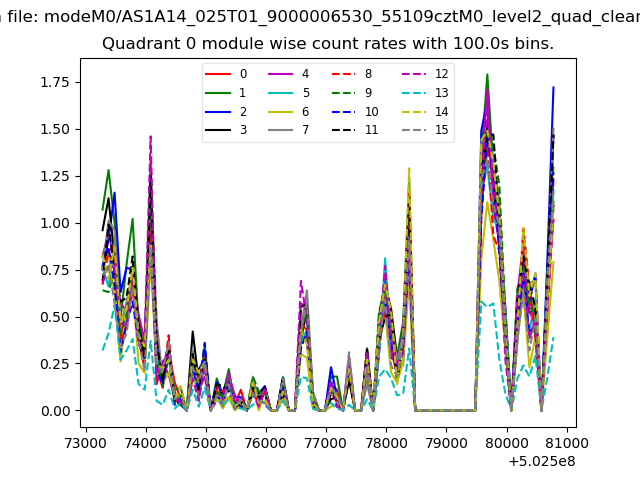 |
 |
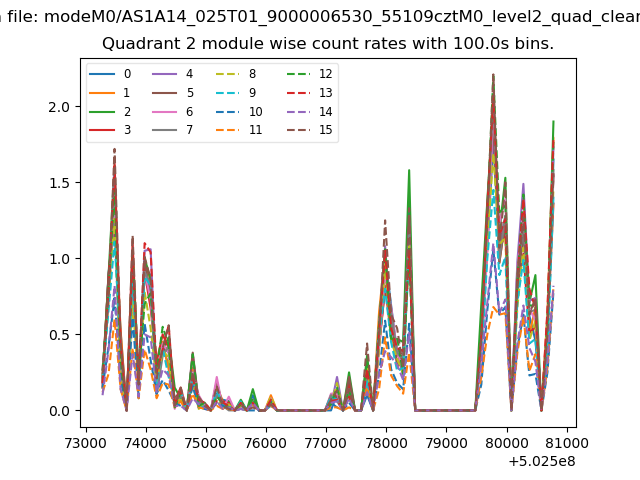
| Module-wise count rates for Quadrant B Data is divided into 100 sec bins |
 |
 |
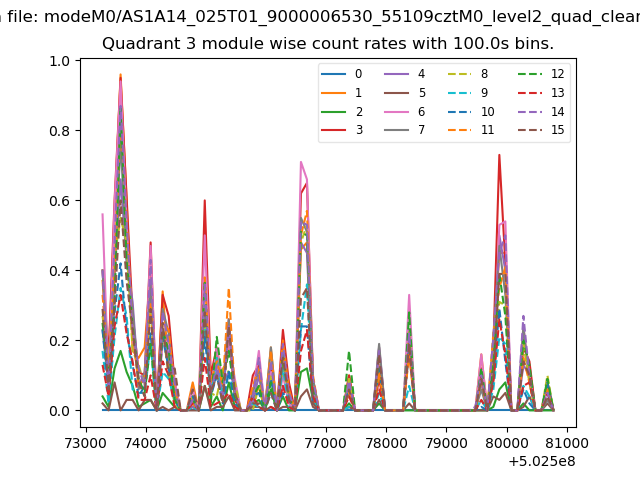
| Module-wise count rates for Quadrant C Data is divided into 100 sec bins |
 |
 |
| Module-wise count rates for Quadrant D Data is divided into 100 sec bins |
 |
 |
| Parameter | Plot |
|---|---|
| CZT HV Monitor | 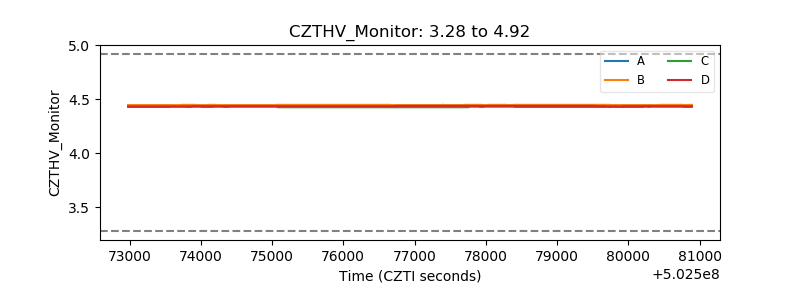 |
| D_VDD | 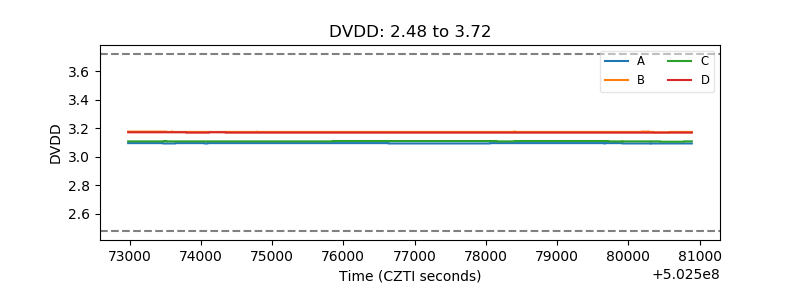 |
| Temperature 1 | 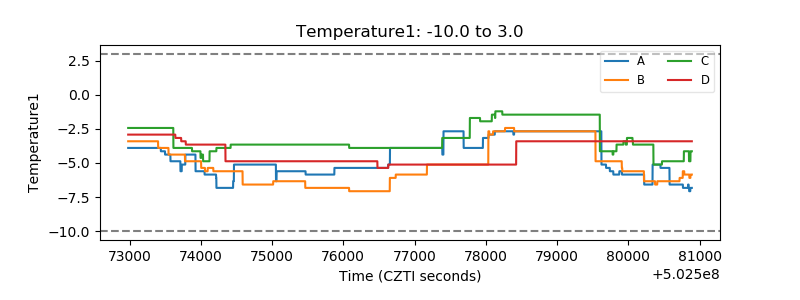 |
| Veto HV Monitor | 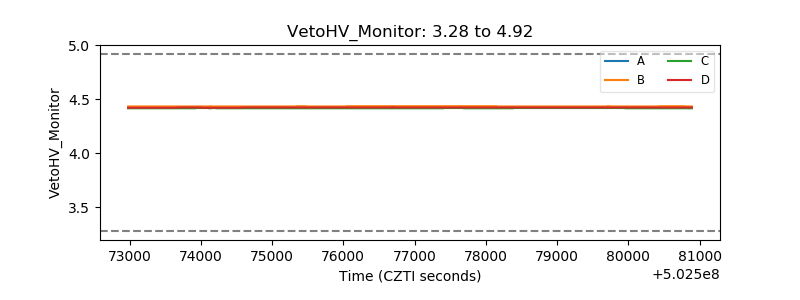 |
| Veto LLD | 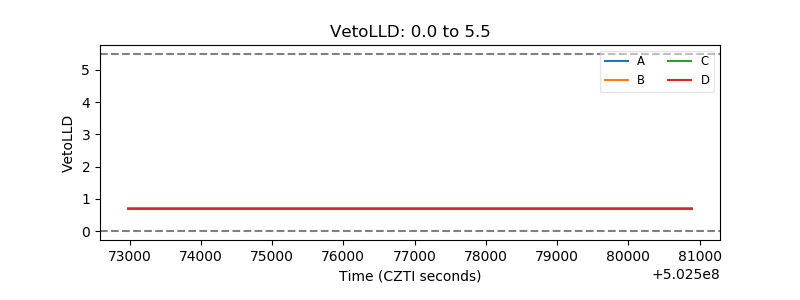 |
| Alpha Counter | 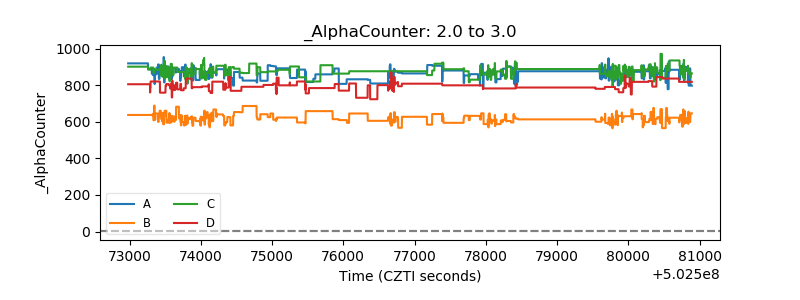 |
| _CPM_Rate | 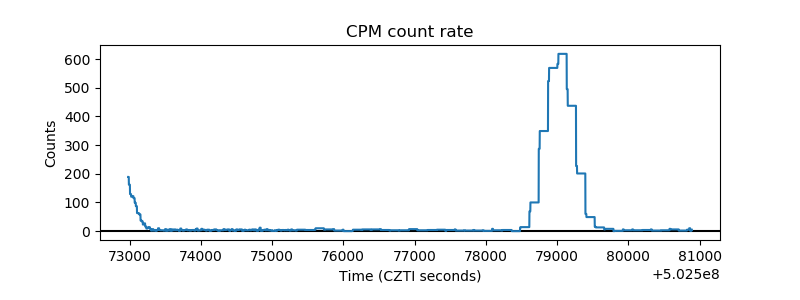 |
| CZT Counter | 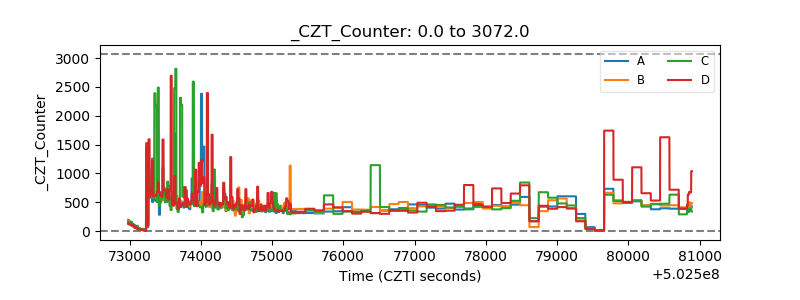 |
| +2.5 Volts monitor |  |
| +5 Volts monitor |  |
| _ROLL_ROT | 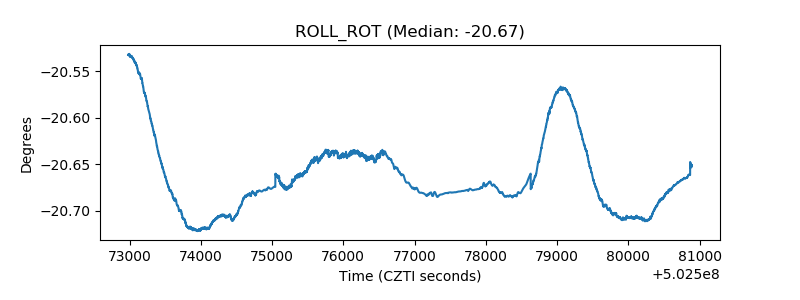 |
| _Roll_DEC | 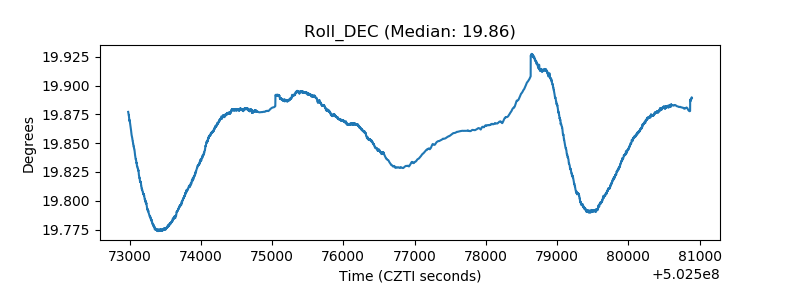 |
| _Roll_RA | 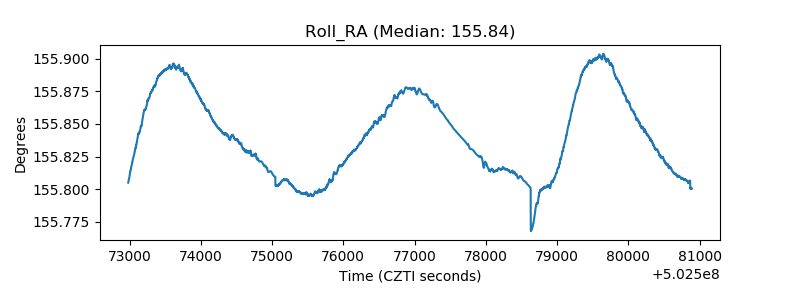 |
| Veto Counter | 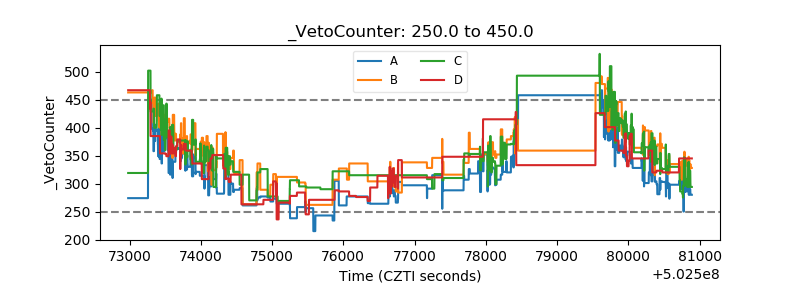 |