| Param | Original file | Final file |
|---|---|---|
| Filename | modeM0/AS1A14_025T01_9000006530_55111cztM0_level2.fits | modeM0/AS1A14_025T01_9000006530_55111cztM0_level2_quad_clean.evt |
| Size (bytes) | 404,020,800 | 101,986,560 |
| Size | 385.3 MB | 97.3 MB |
| Events in quadrant A | 4,446,356 | 655,304 |
| Events in quadrant B | 3,162,523 | 729,420 |
| Events in quadrant C | 3,571,497 | 638,830 |
| Events in quadrant D | 3,246,719 | 591,065 |
| Mode M0 | |||
|---|---|---|---|
| Quadrant | BADHDUFLAG | Total packets | Discarded packets |
| A | 0 | 17950 | 2 |
| B | 0 | 14020 | 2 |
| C | 0 | 15354 | 2 |
| D | 0 | 14985 | 2 |
| Mode SS | |||
|---|---|---|---|
| Quadrant | BADHDUFLAG | Total packets | Discarded packets |
| A | 0 | 140 | 0 |
| B | 0 | 140 | 0 |
| C | 0 | 140 | 0 |
| D | 0 | 140 | 0 |
| Mode M9 | |||
|---|---|---|---|
| Quadrant | BADHDUFLAG | Total packets | Discarded packets |
| A | 0 | 15 | 0 |
| B | 0 | 15 | 0 |
| C | 0 | 16 | 0 |
| D | 0 | 16 | 0 |
| Quadrant | Total seconds | Saturated seconds | Saturation percentage |
|---|---|---|---|
| A | 6794 | 244 | 3.591404% |
| B | 6794 | 47 | 0.691787% |
| C | 6794 | 73 | 1.074477% |
| D | 6793 | 92 | 1.354335% |
Noise dominated data is calculated using 1-second bins in cleaned event files. If a bin has >2000 counts, and if more than 50% of those come from <1% of pixels, then it is considered to be noise-dominated and hence unusable.
| Quadrant | # 1 sec bins | Bins with >0 counts | Bins with >2000 counts | High rate bins dominated by noise | Noise dominated (total time) | Noise dominated (detector-on time) | Marked lightcurve |
|---|---|---|---|---|---|---|---|
| A | 7954 | 6795 | 219 | 219 | 2.75% | 3.22% | 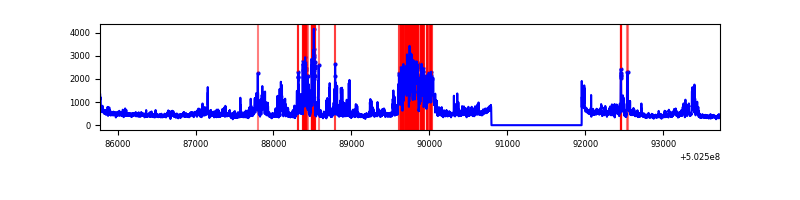 |
| B | 7954 | 6795 | 3 | 3 | 0.04% | 0.04% | 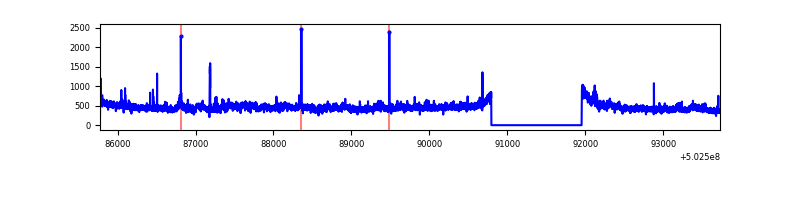 |
| C | 7954 | 6795 | 48 | 48 | 0.60% | 0.71% | 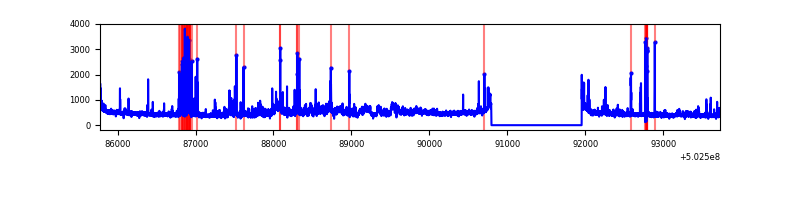 |
| D | 7953 | 6794 | 64 | 64 | 0.80% | 0.94% | 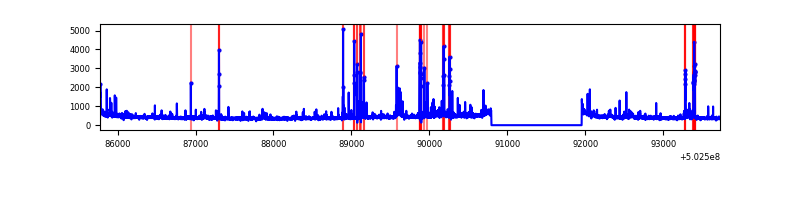 |
Top three noisy pixels from each quadrant. If the there are fewer than three noisy pixels in the level2.evt file, extra rows are filled as -1
| Pixel properties | Quadrant properties | ||||||
|---|---|---|---|---|---|---|---|
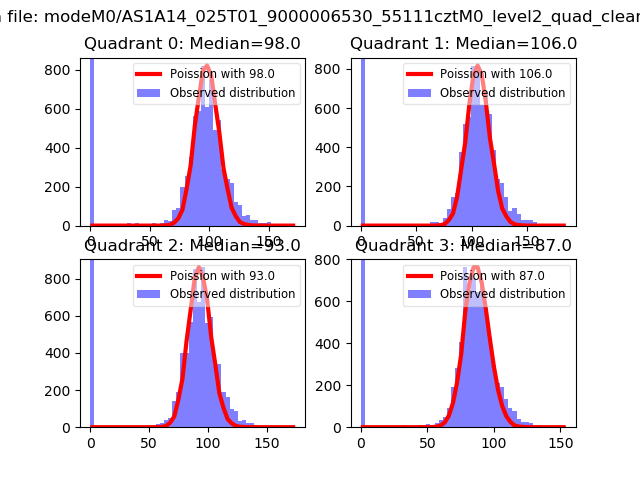
| Quadrant | DetID | PixID | Counts | Sigma | Mean | Median | Sigma |
| A | 5 | 241 | 1546341 | 8698.36 | 717 | 702 | 177.7 |
| A | 0 | 8 | 72458 | 403.82 | 717 | 702 | 177.7 |
| A | 3 | 14 | 13783 | 73.62 | 717 | 702 | 177.7 |
| B | 0 | 63 | 253551 | 1620.59 | 724 | 696 | 156.0 |
| B | 10 | 247 | 21445 | 132.98 | 724 | 696 | 156.0 |
| B | 12 | 111 | 18961 | 117.06 | 724 | 696 | 156.0 |
| C | 3 | 242 | 356028 | 1830.15 | 705 | 700 | 194.2 |
| C | 13 | 3 | 195301 | 1002.31 | 705 | 700 | 194.2 |
| C | 14 | 254 | 58398 | 297.18 | 705 | 700 | 194.2 |
| D | 12 | 6 | 101398 | 507.97 | 693 | 663 | 198.3 |
| D | 2 | 252 | 82950 | 414.94 | 693 | 663 | 198.3 |
| D | 15 | 94 | 74203 | 370.84 | 693 | 663 | 198.3 |
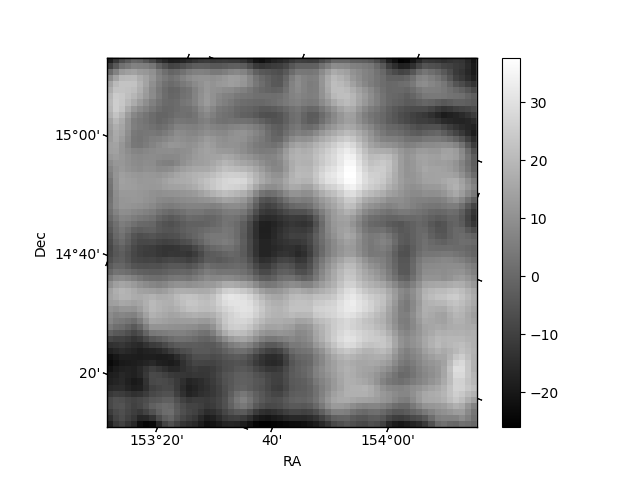
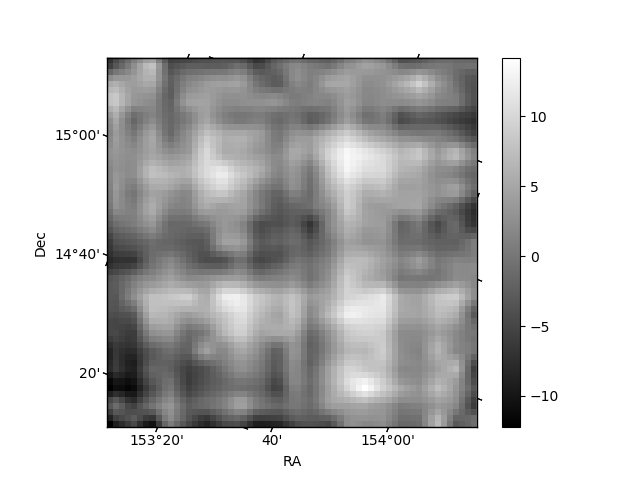
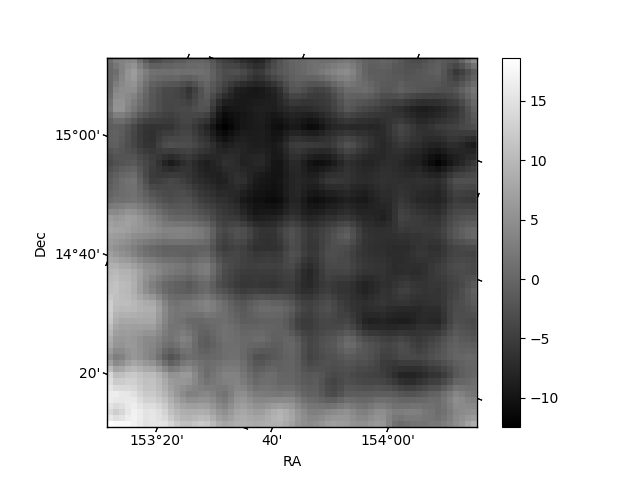
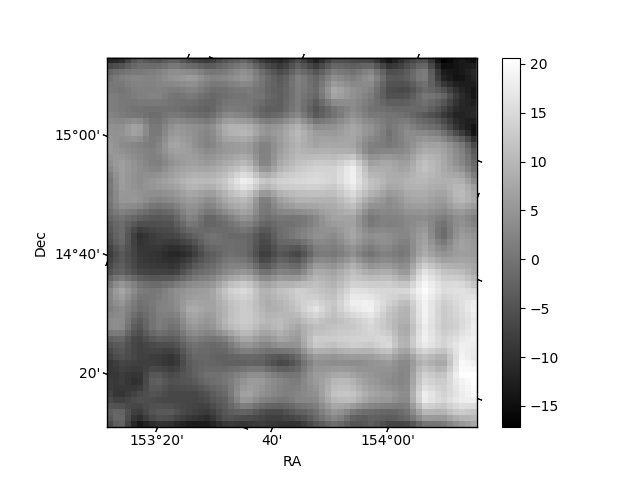
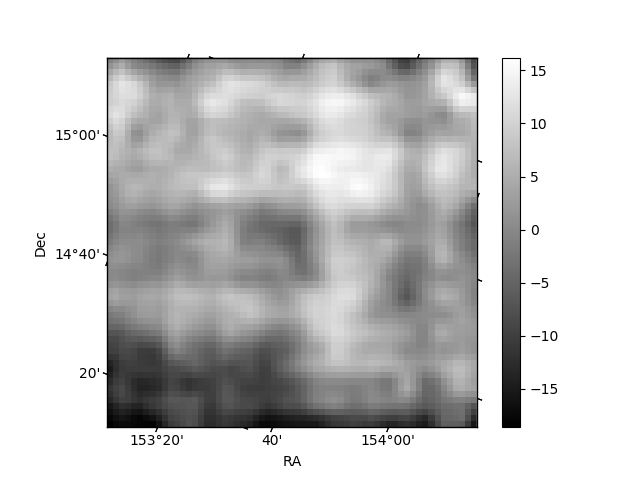
Histogram calculated using DETX and DETY for each event in the final _common_clean file
| Quadrant A | 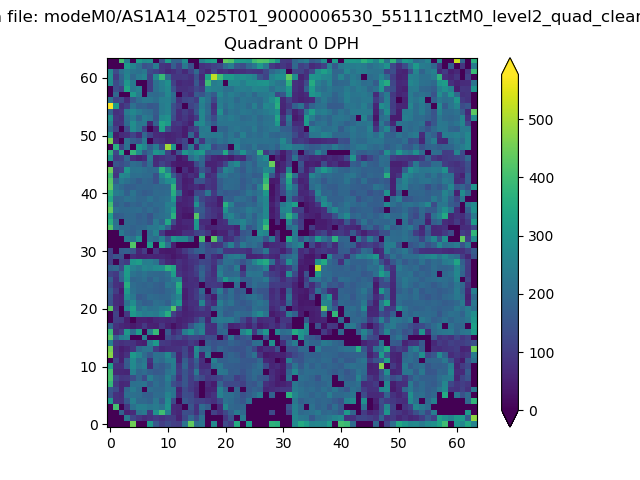 |
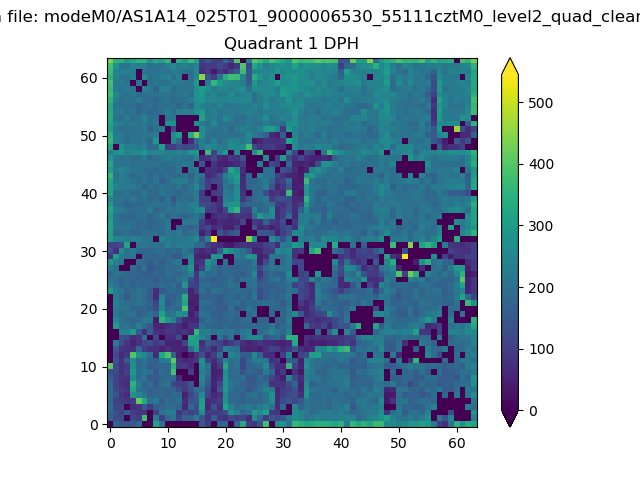 |
Quadrant B |
|---|---|---|---|
| Quadrant D | 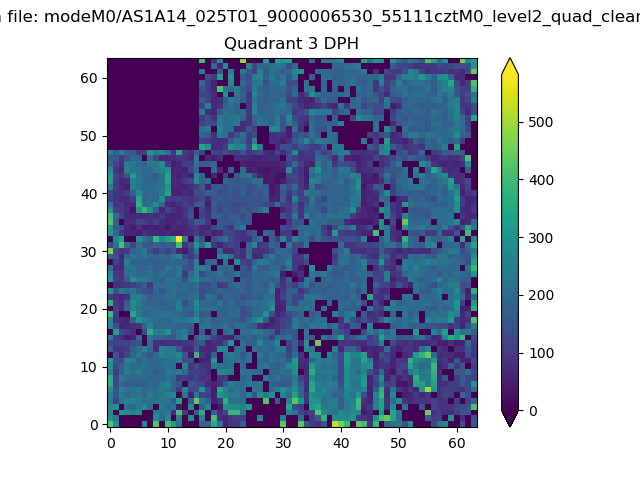 |
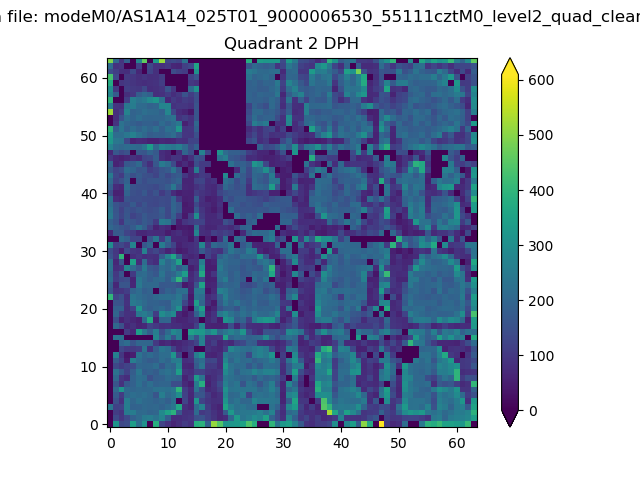 |
Quadrant C |
| Plot type | Count rate plots | Images |
|---|---|---|
| Comparison with Poisson distribution Blue bars denote a histogram of data divided into 1 sec bins. Red curve is a Poisson curve with rate = median count rate of data. |
 |
 |
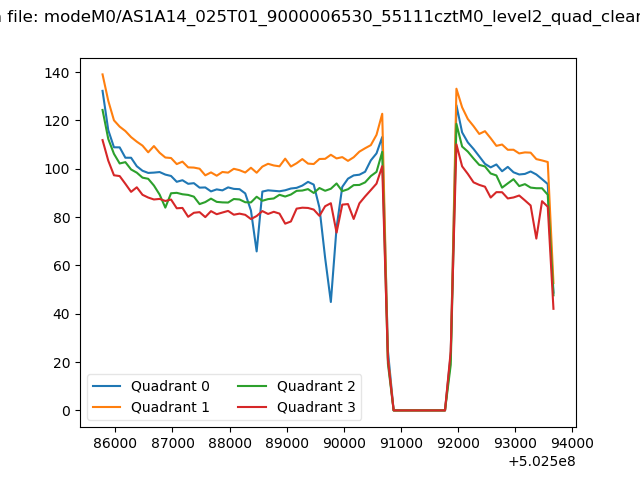
| Quadrant-wise count rates Data is divided into 100 sec bins |
 |
|
| Module-wise count rates for Quadrant A Data is divided into 100 sec bins |
 |
 |
| Module-wise count rates for Quadrant B Data is divided into 100 sec bins |
 |
 |
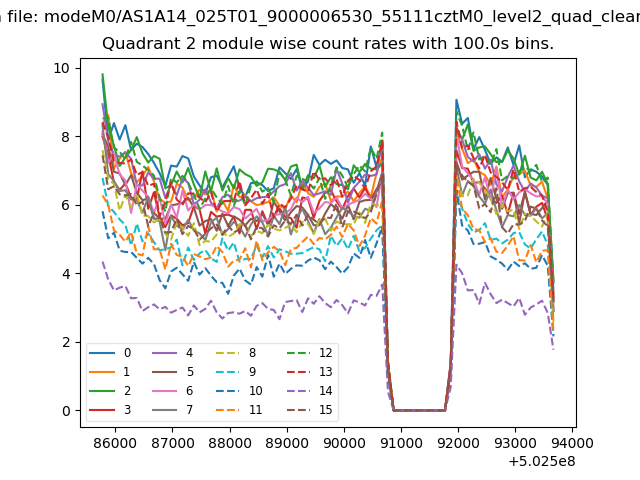
| Module-wise count rates for Quadrant C Data is divided into 100 sec bins |
 |
 |
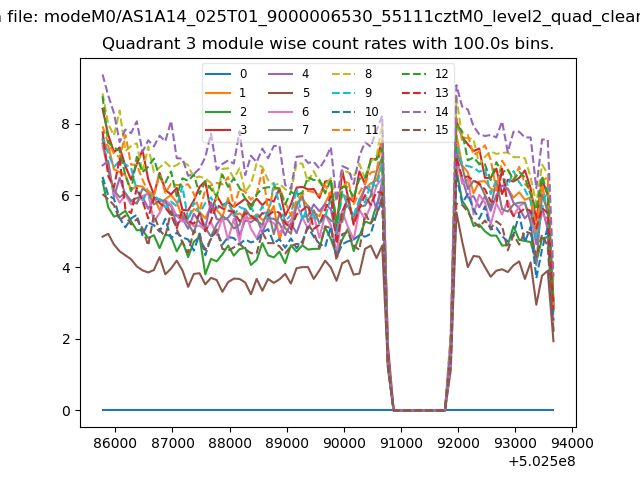
| Module-wise count rates for Quadrant D Data is divided into 100 sec bins |
 |
 |
| Parameter | Plot |
|---|---|
| CZT HV Monitor | 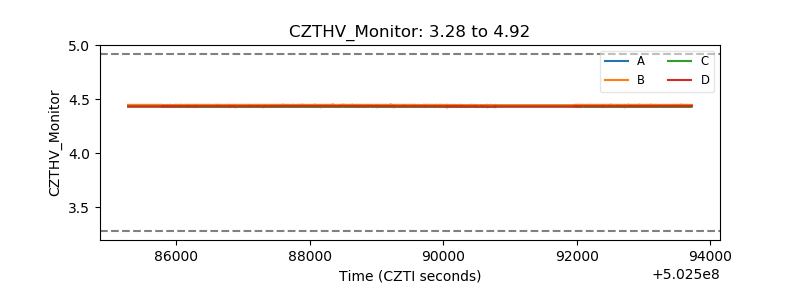 |
| D_VDD | 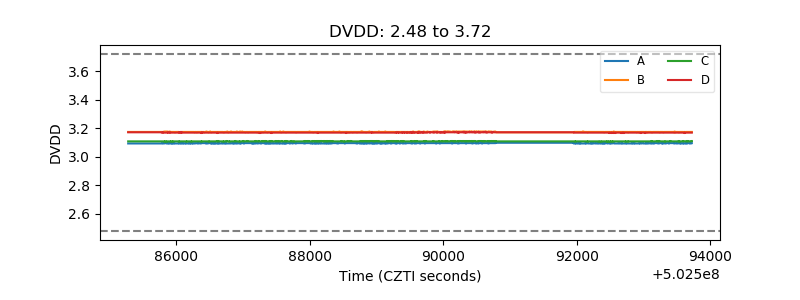 |
| Temperature 1 | 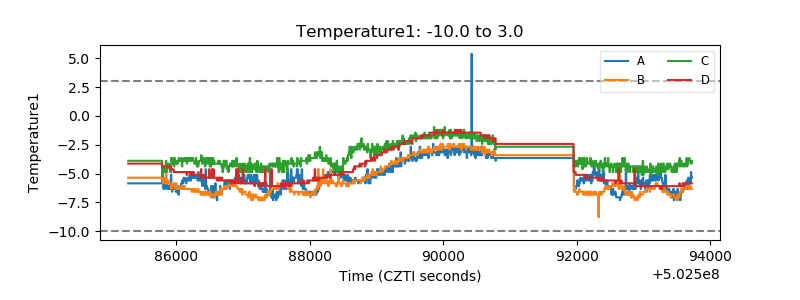 |
| Veto HV Monitor | 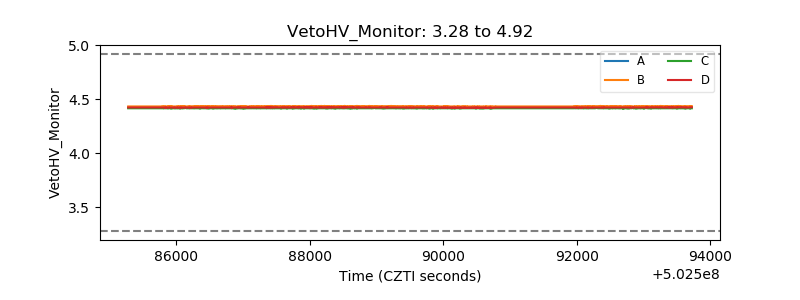 |
| Veto LLD |  |
| Alpha Counter | 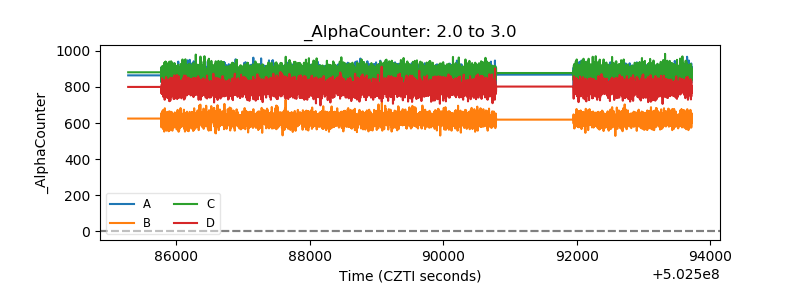 |
| _CPM_Rate | 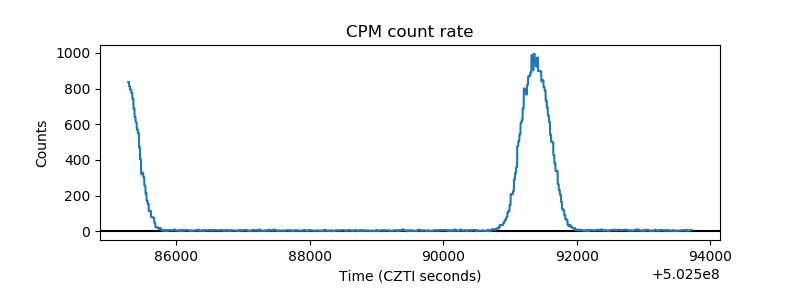 |
| CZT Counter | 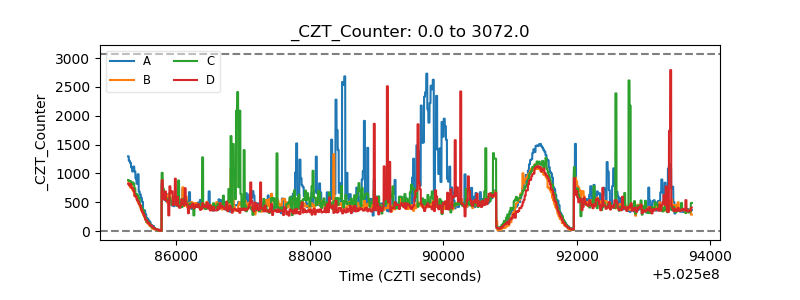 |
| +2.5 Volts monitor |  |
| +5 Volts monitor |  |
| _ROLL_ROT | 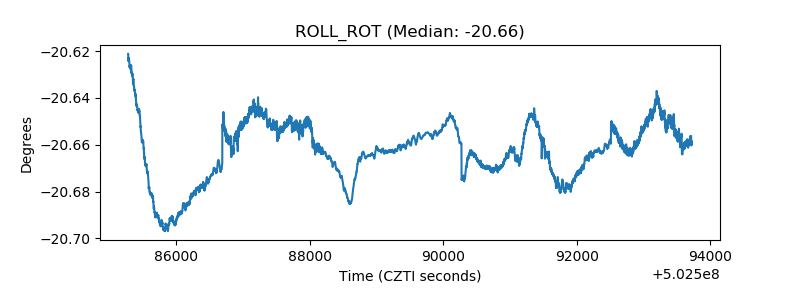 |
| _Roll_DEC | 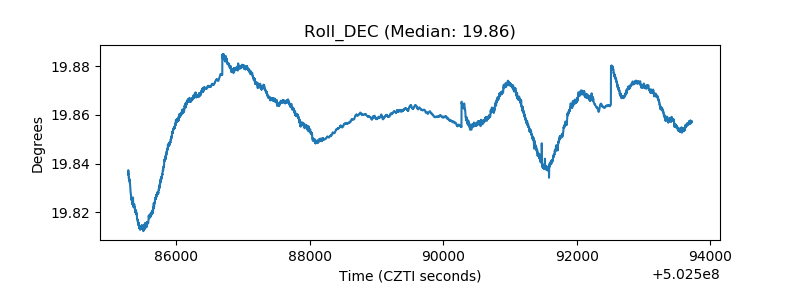 |
| _Roll_RA | 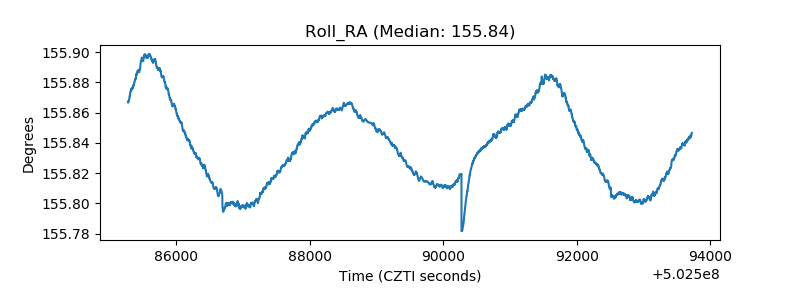 |
| Veto Counter | 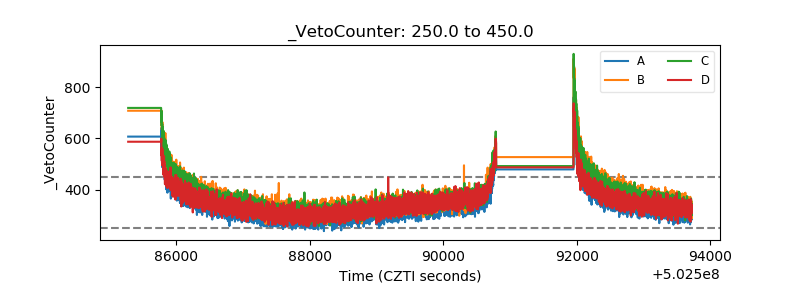 |