| Param | Original file | Final file |
|---|---|---|
| Filename | modeM0/AS1A14_022T16_9000006532cztM0_level2.fits | modeM0/AS1A14_022T16_9000006532cztM0_level2_quad_clean.evt |
| Size (bytes) | 780,511,680 | 476,827,200 |
| Size | 744.4 MB | 454.7 MB |
| Events in quadrant A | 4,653,678 | 2,101,287 |
| Events in quadrant B | 4,415,554 | 2,255,219 |
| Events in quadrant C | 4,515,614 | 1,955,153 |
| Events in quadrant D | 3,639,466 | 1,717,932 |
| Mode SS | |||
|---|---|---|---|
| Quadrant | BADHDUFLAG | Total packets | Discarded packets |
| A | 0 | 1896 | 0 |
| B | 0 | 1900 | 0 |
| C | 0 | 1900 | 0 |
| D | 0 | 1894 | 0 |
| Mode M0 | |||
|---|---|---|---|
| Quadrant | BADHDUFLAG | Total packets | Discarded packets |
| A | 0 | 209335 | 0 |
| B | 0 | 193916 | 0 |
| C | 0 | 211412 | 0 |
| D | 0 | 320755 | 0 |
| Mode M9 | |||
|---|---|---|---|
| Quadrant | BADHDUFLAG | Total packets | Discarded packets |
| A | 0 | 623 | 0 |
| B | 0 | 624 | 0 |
| C | 0 | 624 | 0 |
| D | 0 | 624 | 0 |
| Quadrant | Total seconds | Saturated seconds | Saturation percentage |
|---|---|---|---|
| A | 93442 | 1811 | 1.938101% |
| B | 93442 | 957 | 1.024165% |
| C | 93431 | 1490 | 1.594760% |
| D | 93395 | 12476 | 13.358317% |
Noise dominated data is calculated using 1-second bins in cleaned event files. If a bin has >2000 counts, and if more than 50% of those come from <1% of pixels, then it is considered to be noise-dominated and hence unusable.
| Quadrant | # 1 sec bins | Bins with >0 counts | Bins with >2000 counts | High rate bins dominated by noise | Noise dominated (total time) | Noise dominated (detector-on time) | Marked lightcurve |
|---|---|---|---|---|---|---|---|
| A | 95342 | 86521 | 0 | 0 | 0.00% | 0.00% | 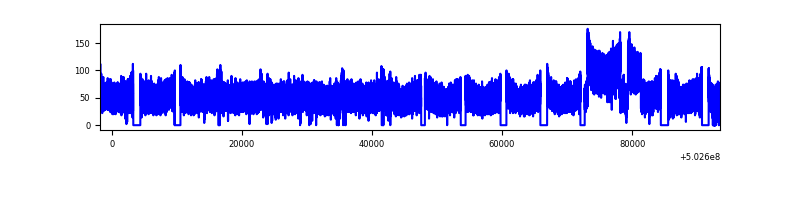 |
| B | 95342 | 86528 | 0 | 0 | 0.00% | 0.00% |  |
| C | 95342 | 86475 | 0 | 0 | 0.00% | 0.00% | 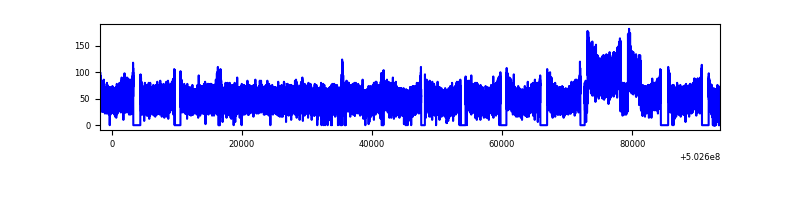 |
| D | 95342 | 86176 | 0 | 0 | 0.00% | 0.00% | 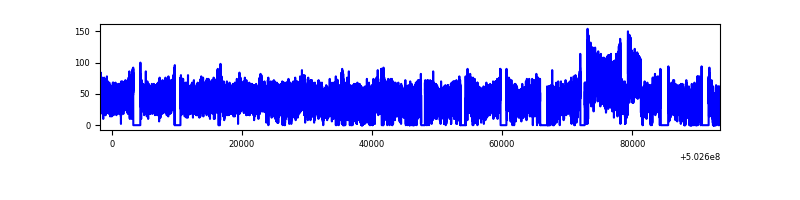 |
Top three noisy pixels from each quadrant. If the there are fewer than three noisy pixels in the level2.evt file, extra rows are filled as -1
| Pixel properties | Quadrant properties | ||||||
|---|---|---|---|---|---|---|---|
| Quadrant | DetID | PixID | Counts | Sigma | Mean | Median | Sigma |
| A | 14 | 188 | 5082 | 9.64 | 1220 | 1120 | 411.1 |
| A | 9 | 255 | 4611 | 8.49 | 1220 | 1120 | 411.1 |
| A | 14 | 204 | 4172 | 7.42 | 1220 | 1120 | 411.1 |
| B | 2 | 9 | 4912 | 13.73 | 1163 | 1098 | 277.8 |
| B | 2 | 8 | 4355 | 11.73 | 1163 | 1098 | 277.8 |
| B | 3 | 25 | 3674 | 9.27 | 1163 | 1098 | 277.8 |
| C | 15 | 175 | 3810 | 6.49 | 1203 | 1086 | 419.7 |
| C | 2 | 31 | 3525 | 5.81 | 1203 | 1086 | 419.7 |
| C | 6 | 179 | 3466 | 5.67 | 1203 | 1086 | 419.7 |
| D | 6 | 218 | 4498 | 10.16 | 1037 | 920 | 352.0 |
| D | 15 | 11 | 3428 | 7.12 | 1037 | 920 | 352.0 |
| D | 3 | 30 | 3374 | 6.97 | 1037 | 920 | 352.0 |
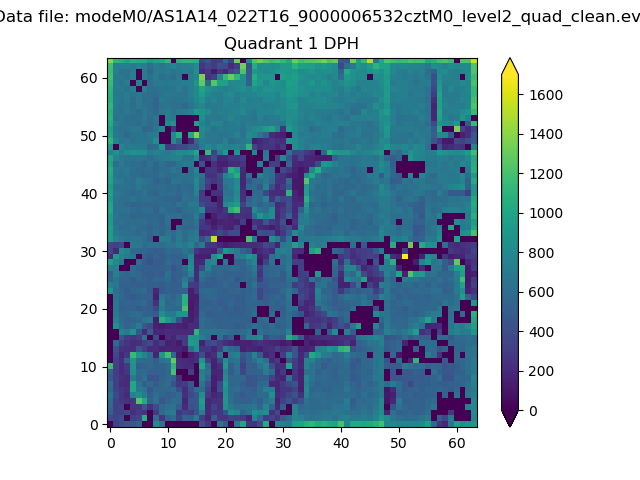
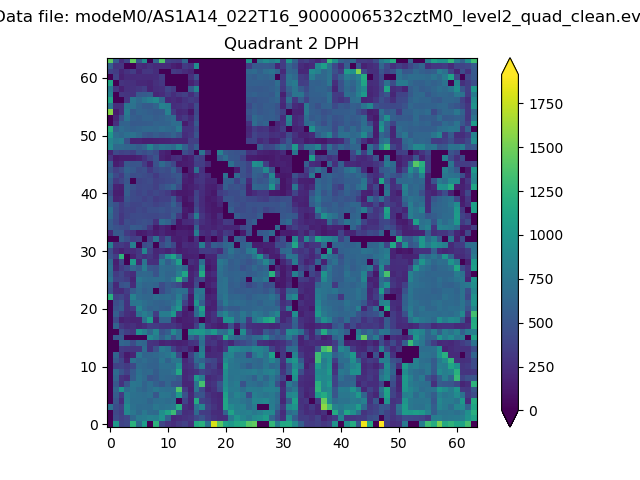
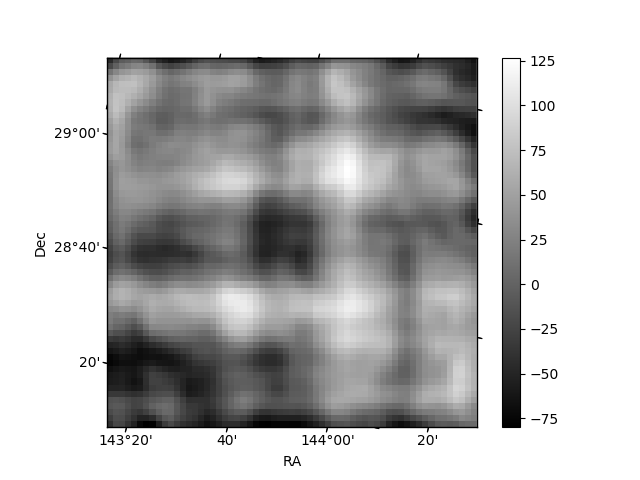
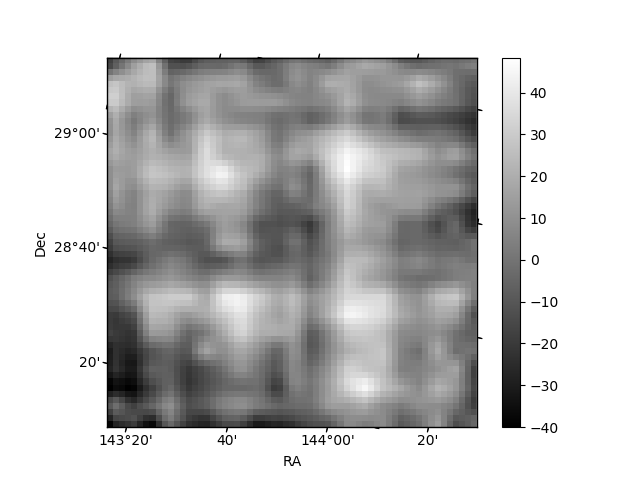
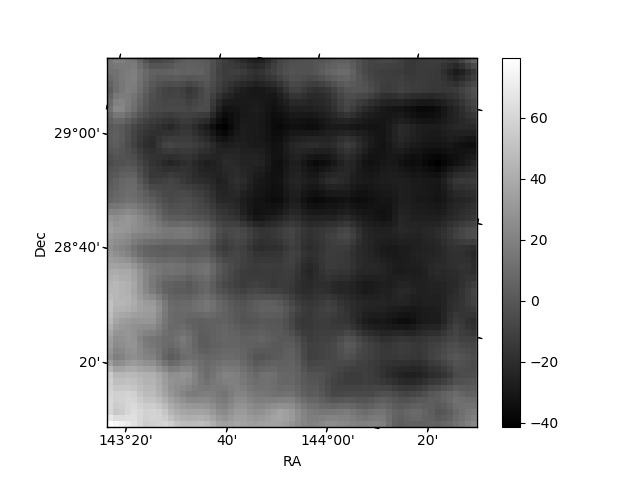
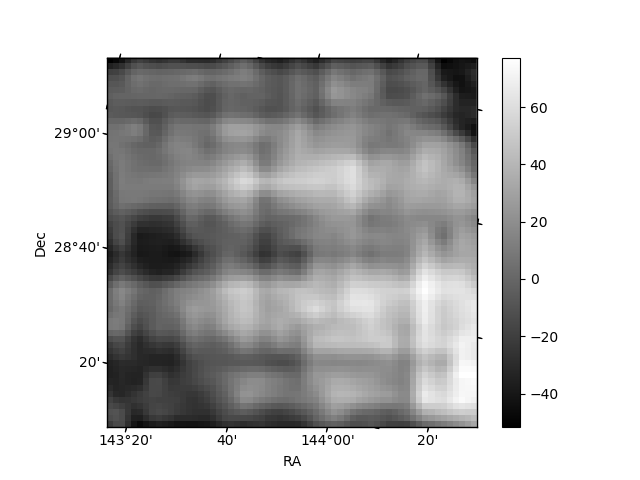
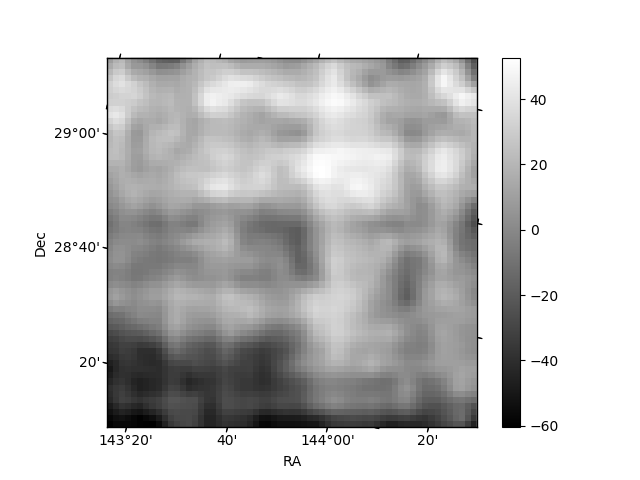
Histogram calculated using DETX and DETY for each event in the final _common_clean file
| Quadrant A | 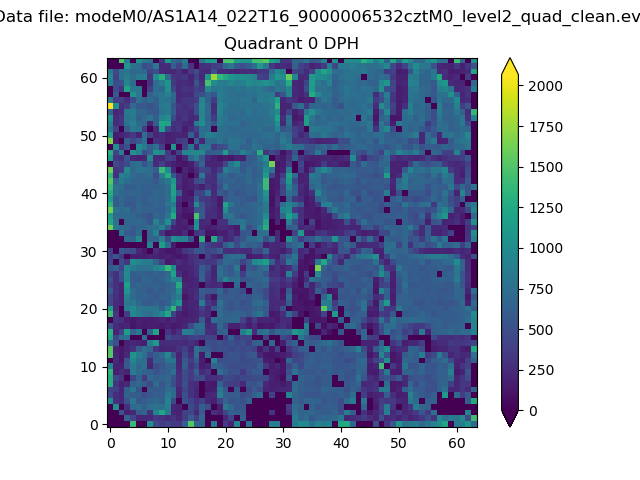 |
 |
Quadrant B |
|---|---|---|---|
| Quadrant D | 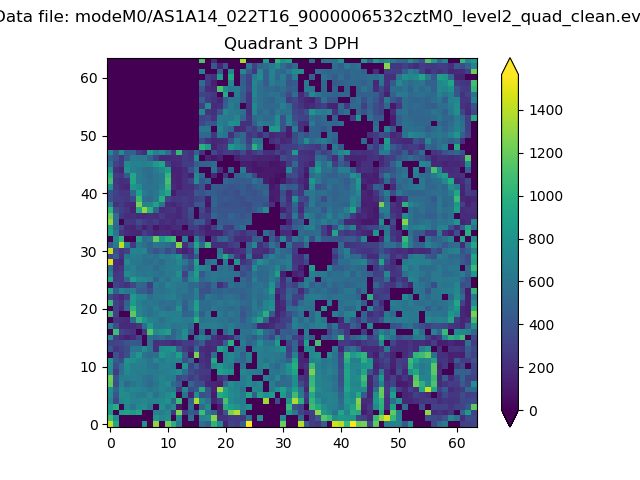 |
 |
Quadrant C |
| Plot type | Count rate plots | Images |
|---|---|---|
| Comparison with Poisson distribution Blue bars denote a histogram of data divided into 1 sec bins. Red curve is a Poisson curve with rate = median count rate of data. |
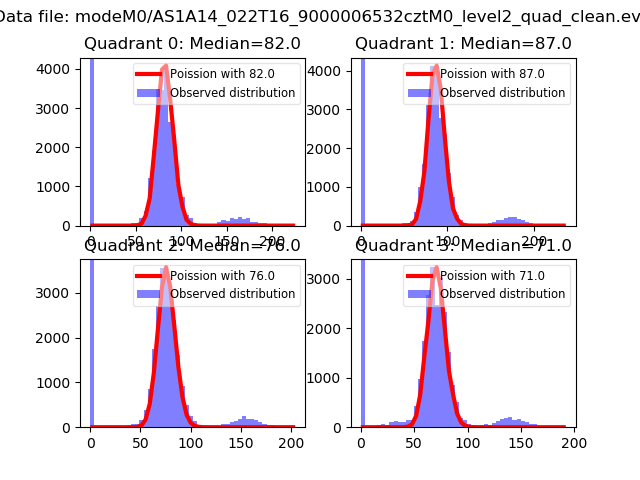 |
 |
| Quadrant-wise count rates Data is divided into 100 sec bins |
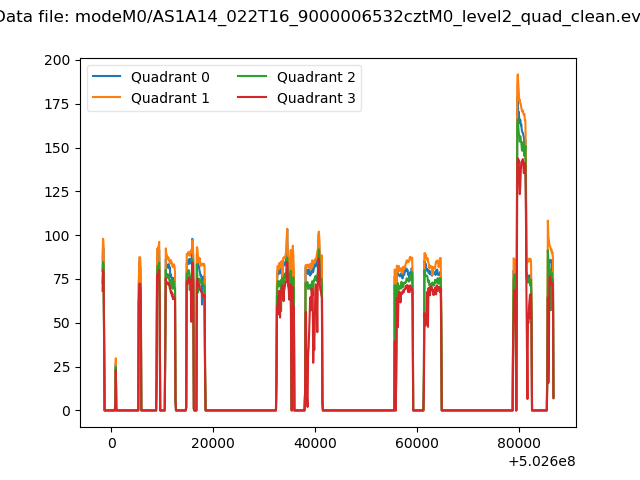 |
|
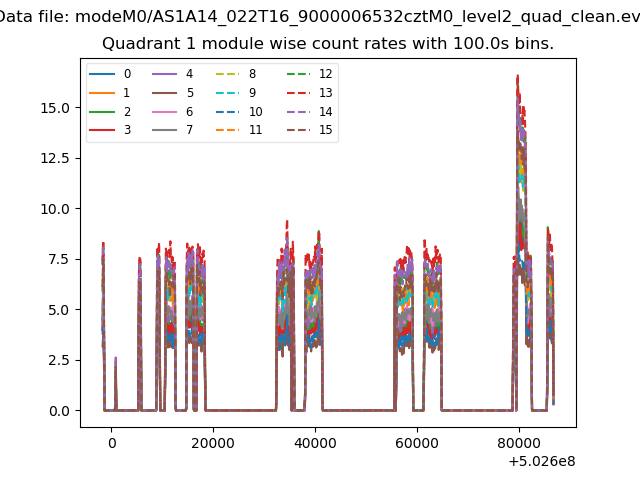
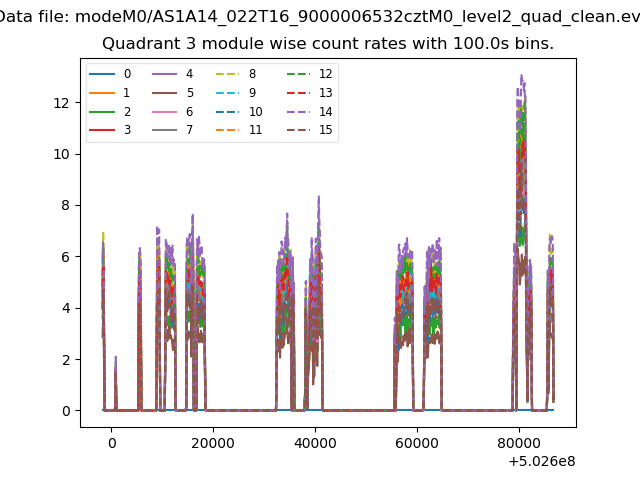
| Module-wise count rates for Quadrant A Data is divided into 100 sec bins |
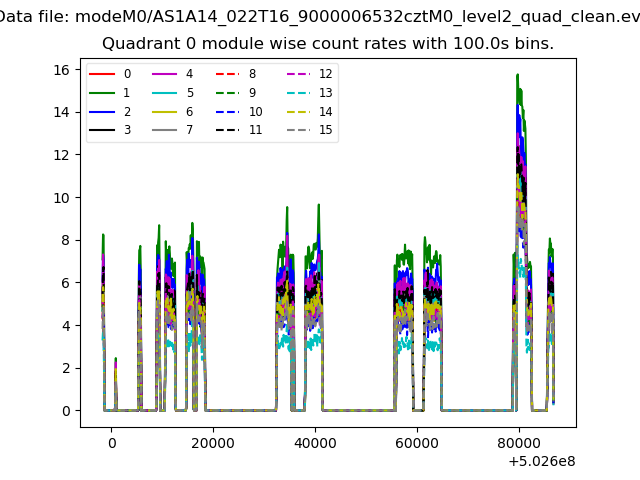 |
 |
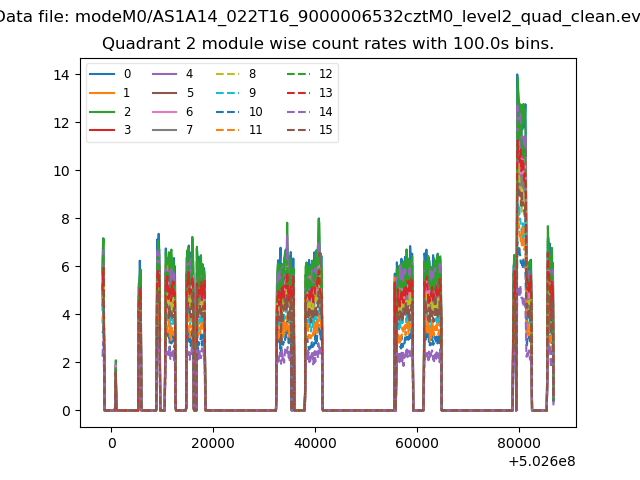
| Module-wise count rates for Quadrant B Data is divided into 100 sec bins |
 |
 |
| Module-wise count rates for Quadrant C Data is divided into 100 sec bins |
 |
 |
| Module-wise count rates for Quadrant D Data is divided into 100 sec bins |
 |
 |
| Parameter | Plot |
|---|---|
| CZT HV Monitor | 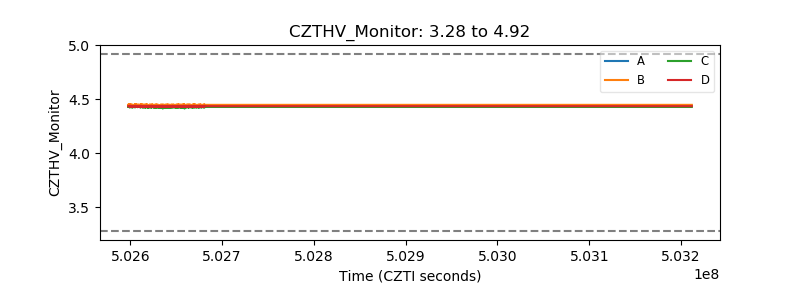 |
| D_VDD | 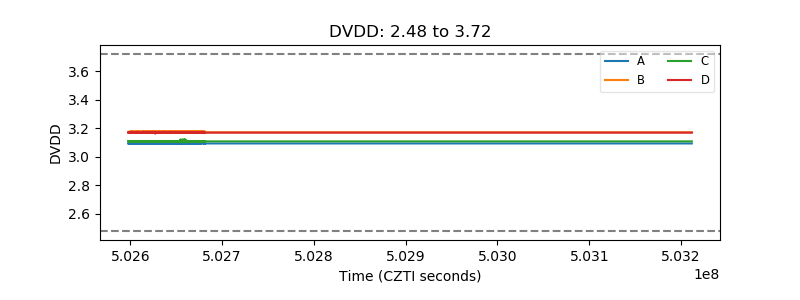 |
| Temperature 1 | 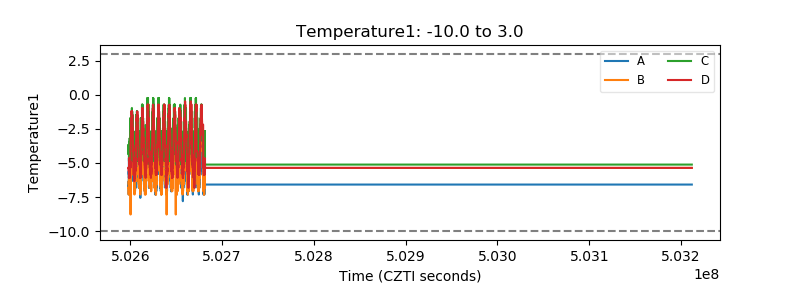 |
| Veto HV Monitor | 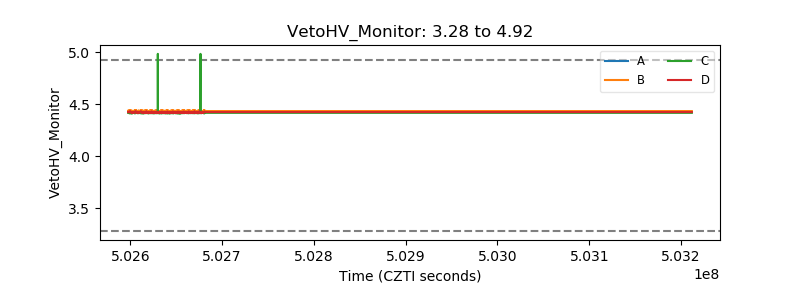 |
| Veto LLD | 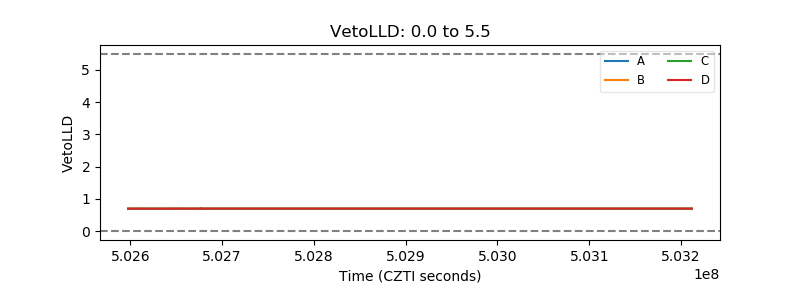 |
| Alpha Counter | 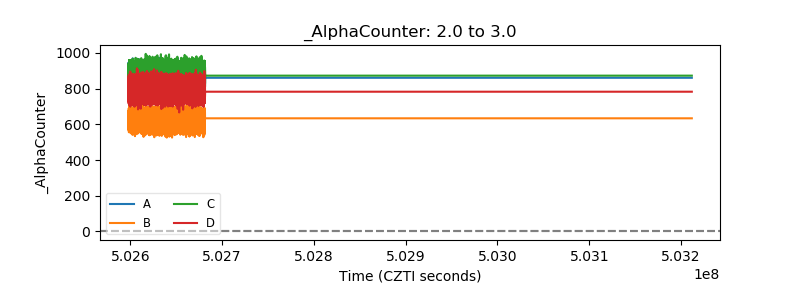 |
| _CPM_Rate | 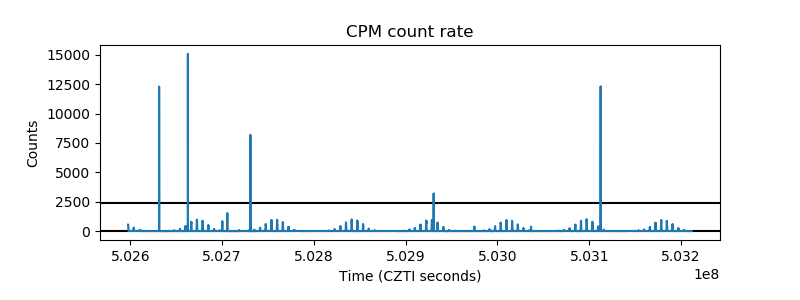 |
| CZT Counter | 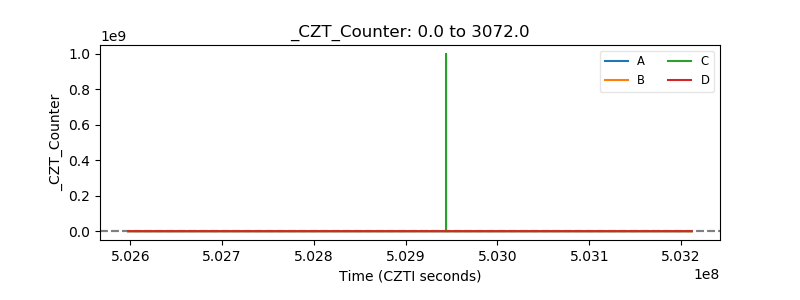 |
| +2.5 Volts monitor | 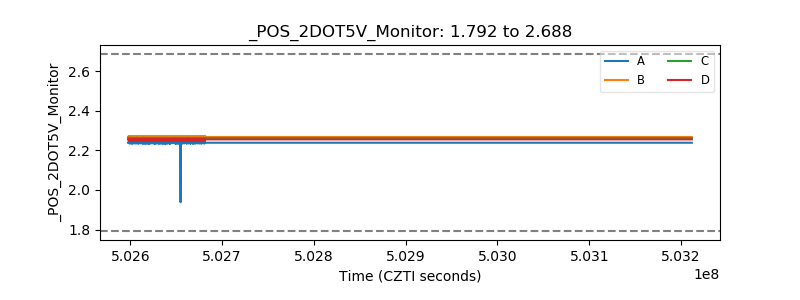 |
| +5 Volts monitor | 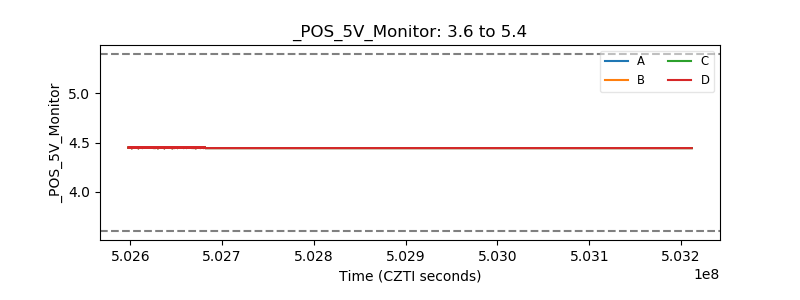 |
| _ROLL_ROT | 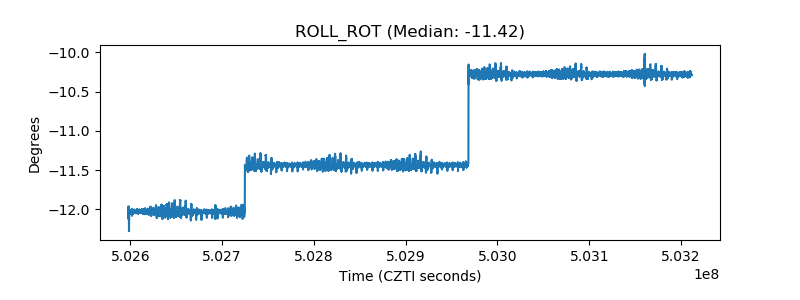 |
| _Roll_DEC | 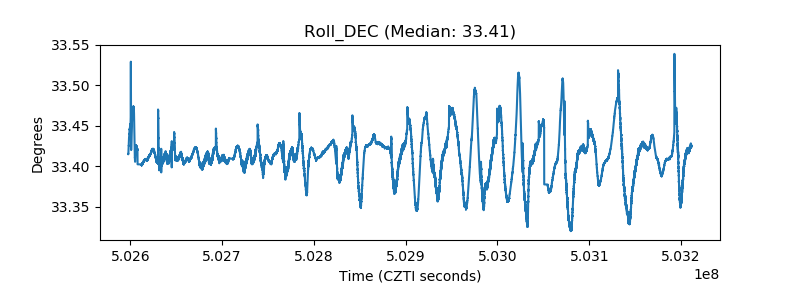 |
| _Roll_RA | 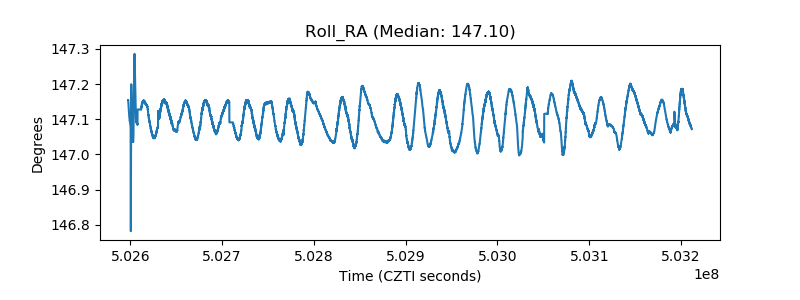 |
| Veto Counter | 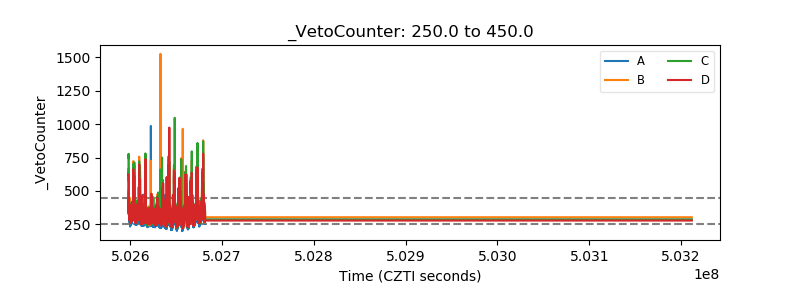 |