| Param | Original file | Final file |
|---|---|---|
| Filename | modeM0/AS1A14_022T16_9000006532_55113cztM0_level2.fits | modeM0/AS1A14_022T16_9000006532_55113cztM0_level2_quad_clean.evt |
| Size (bytes) | 365,284,800 | 100,437,120 |
| Size | 348.4 MB | 95.8 MB |
| Events in quadrant A | 3,333,722 | 647,433 |
| Events in quadrant B | 2,905,209 | 712,768 |
| Events in quadrant C | 3,363,784 | 623,889 |
| Events in quadrant D | 3,388,513 | 582,920 |
| Mode SS | |||
|---|---|---|---|
| Quadrant | BADHDUFLAG | Total packets | Discarded packets |
| A | 0 | 138 | 0 |
| B | 0 | 138 | 0 |
| C | 0 | 138 | 0 |
| D | 0 | 138 | 0 |
| Mode M0 | |||
|---|---|---|---|
| Quadrant | BADHDUFLAG | Total packets | Discarded packets |
| A | 0 | 15302 | 0 |
| B | 0 | 13996 | 0 |
| C | 0 | 15111 | 0 |
| D | 0 | 15440 | 1 |
| Mode M9 | |||
|---|---|---|---|
| Quadrant | BADHDUFLAG | Total packets | Discarded packets |
| A | 0 | 17 | 0 |
| B | 0 | 17 | 0 |
| C | 0 | 17 | 0 |
| D | 0 | 17 | 0 |
| Quadrant | Total seconds | Saturated seconds | Saturation percentage |
|---|---|---|---|
| A | 6807 | 170 | 2.497429% |
| B | 6807 | 42 | 0.617012% |
| C | 6807 | 52 | 0.763919% |
| D | 6806 | 84 | 1.234205% |
Noise dominated data is calculated using 1-second bins in cleaned event files. If a bin has >2000 counts, and if more than 50% of those come from <1% of pixels, then it is considered to be noise-dominated and hence unusable.
| Quadrant | # 1 sec bins | Bins with >0 counts | Bins with >2000 counts | High rate bins dominated by noise | Noise dominated (total time) | Noise dominated (detector-on time) | Marked lightcurve |
|---|---|---|---|---|---|---|---|
| A | 7902 | 6808 | 89 | 89 | 1.13% | 1.31% | 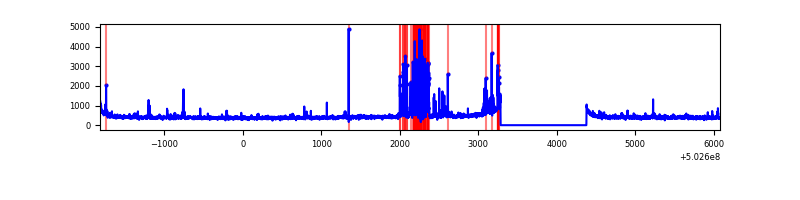 |
| B | 7902 | 6808 | 0 | 0 | 0.00% | 0.00% | 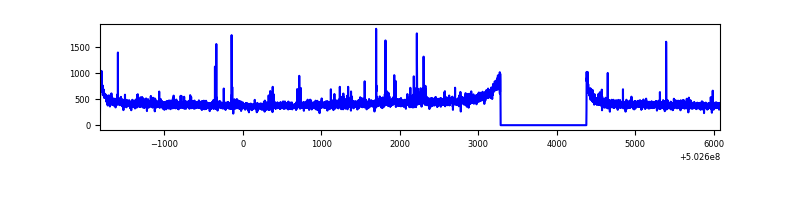 |
| C | 7902 | 6808 | 42 | 42 | 0.53% | 0.62% | 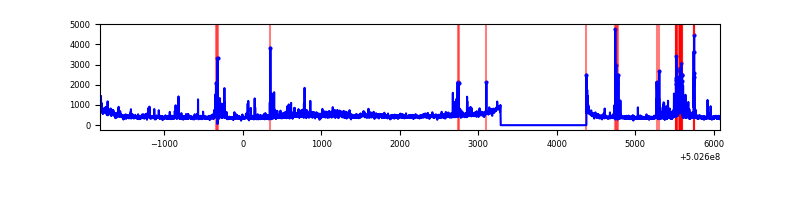 |
| D | 7901 | 6807 | 68 | 68 | 0.86% | 1.00% | 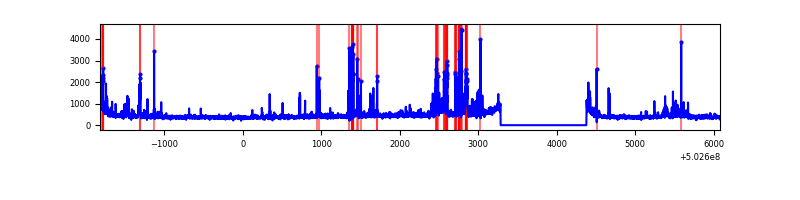 |
Top three noisy pixels from each quadrant. If the there are fewer than three noisy pixels in the level2.evt file, extra rows are filled as -1
| Pixel properties | Quadrant properties | ||||||
|---|---|---|---|---|---|---|---|
| Quadrant | DetID | PixID | Counts | Sigma | Mean | Median | Sigma |
| A | 0 | 8 | 488287 | 2762.94 | 715 | 698 | 176.5 |
| A | 3 | 61 | 24532 | 135.06 | 715 | 698 | 176.5 |
| A | 4 | 3 | 16216 | 87.93 | 715 | 698 | 176.5 |
| B | 0 | 182 | 24972 | 159.61 | 715 | 688 | 152.1 |
| B | 10 | 247 | 22979 | 146.51 | 715 | 688 | 152.1 |
| B | 12 | 111 | 18742 | 118.66 | 715 | 688 | 152.1 |
| C | 3 | 242 | 186011 | 974.0 | 695 | 690 | 190.3 |
| C | 10 | 22 | 108840 | 568.41 | 695 | 690 | 190.3 |
| C | 6 | 223 | 91262 | 476.02 | 695 | 690 | 190.3 |
| D | 15 | 94 | 180465 | 920.82 | 689 | 657 | 195.3 |
| D | 3 | 176 | 160791 | 820.06 | 689 | 657 | 195.3 |
| D | 2 | 249 | 84288 | 428.28 | 689 | 657 | 195.3 |
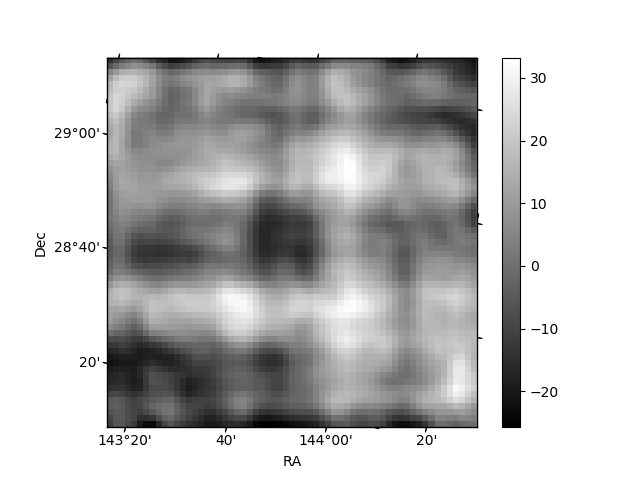
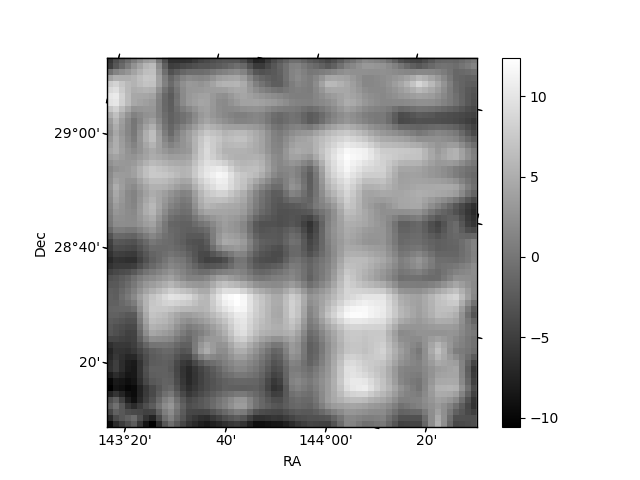
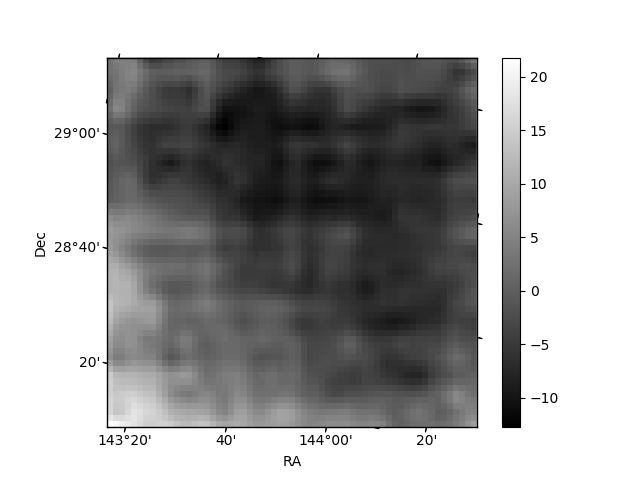
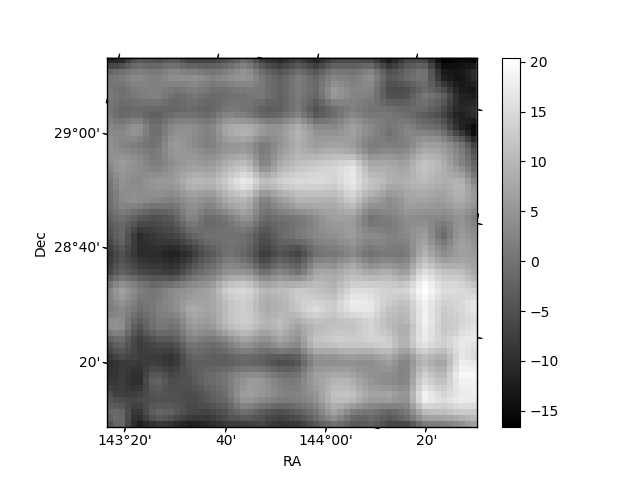
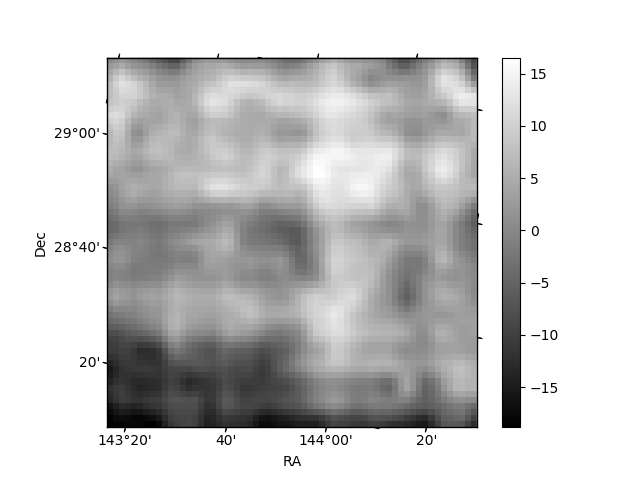
Histogram calculated using DETX and DETY for each event in the final _common_clean file
| Quadrant A | 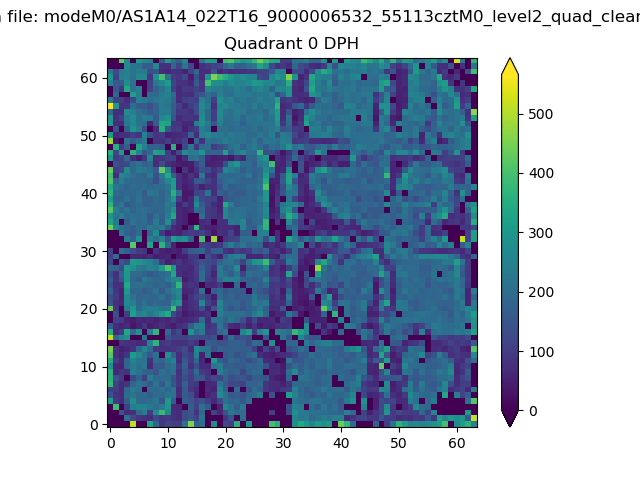 |
 |
Quadrant B |
|---|---|---|---|
| Quadrant D | 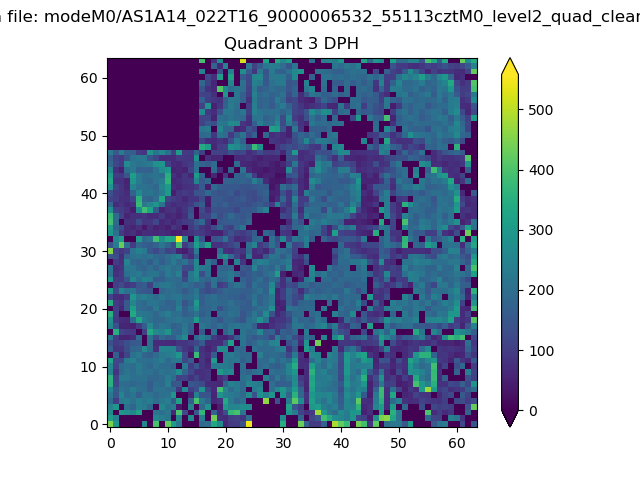 |
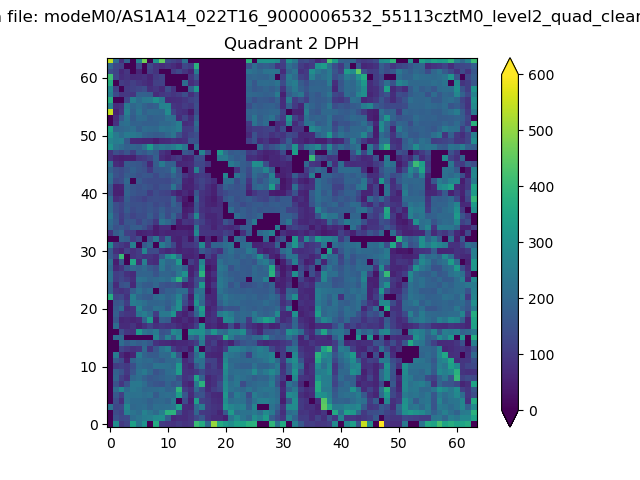 |
Quadrant C |
| Plot type | Count rate plots | Images |
|---|---|---|
| Comparison with Poisson distribution Blue bars denote a histogram of data divided into 1 sec bins. Red curve is a Poisson curve with rate = median count rate of data. |
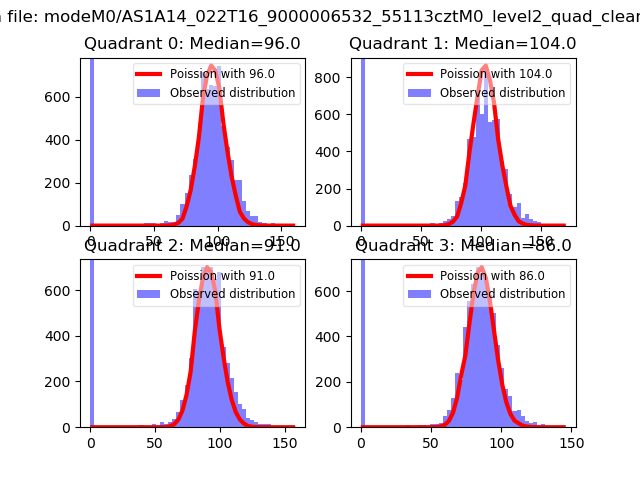 |
 |
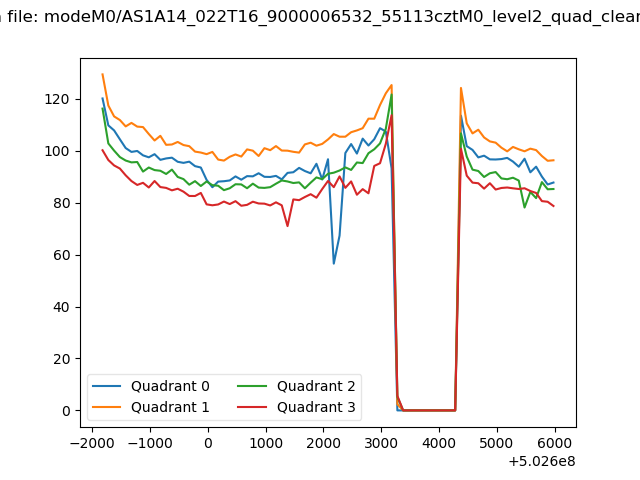
| Quadrant-wise count rates Data is divided into 100 sec bins |
 |
|
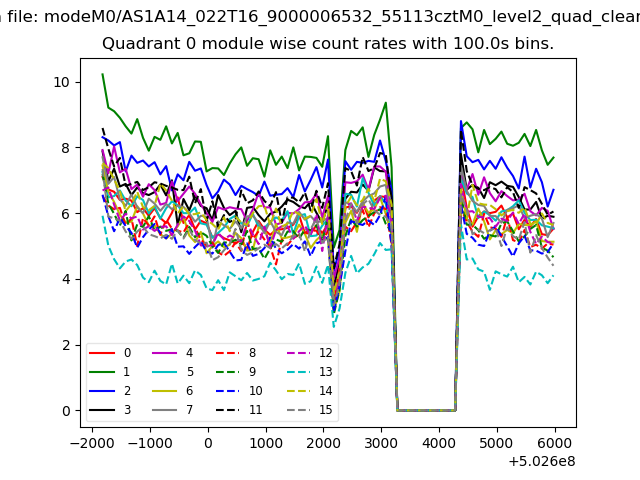
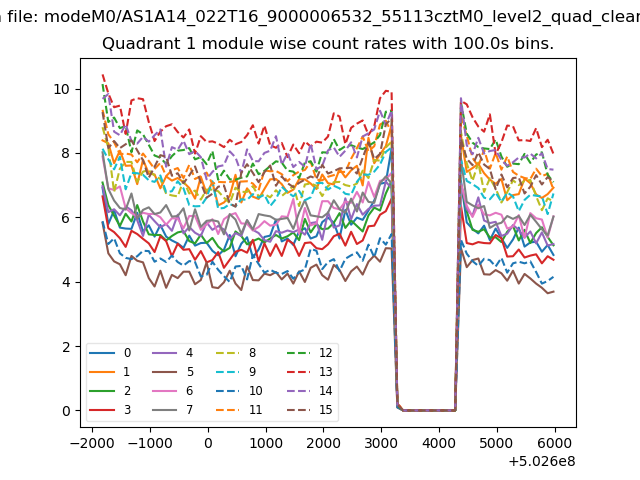
| Module-wise count rates for Quadrant A Data is divided into 100 sec bins |
 |
 |
| Module-wise count rates for Quadrant B Data is divided into 100 sec bins |
 |
 |
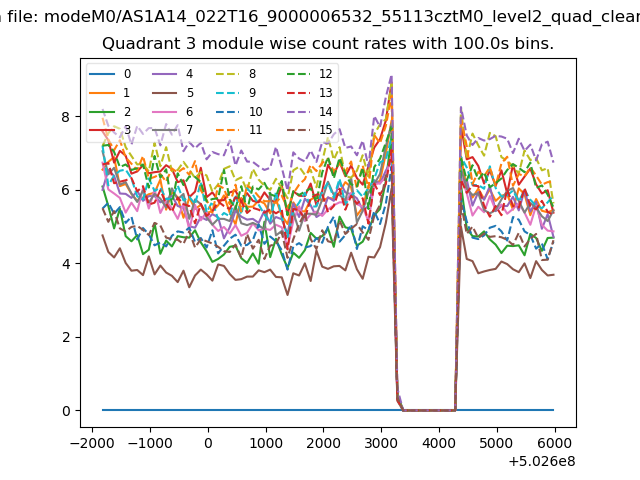
| Module-wise count rates for Quadrant C Data is divided into 100 sec bins |
 |
 |
| Module-wise count rates for Quadrant D Data is divided into 100 sec bins |
 |
 |
| Parameter | Plot |
|---|---|
| CZT HV Monitor | 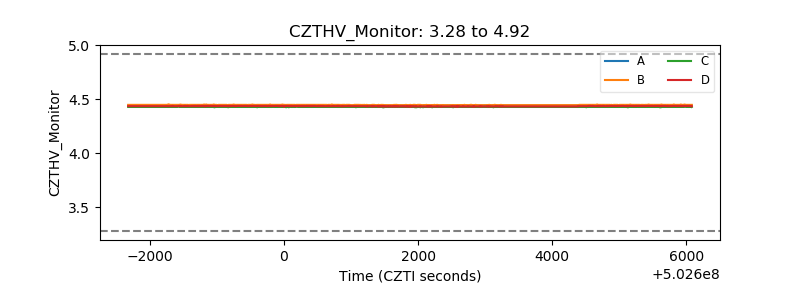 |
| D_VDD | 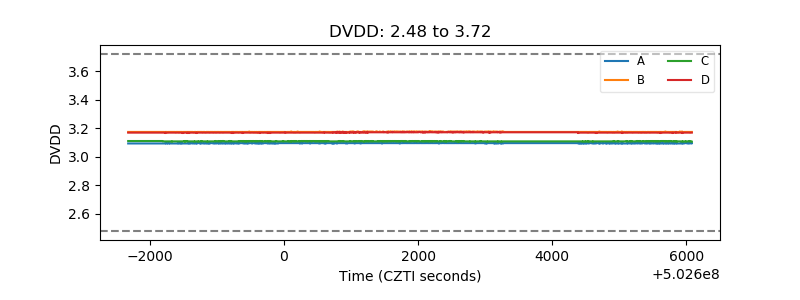 |
| Temperature 1 | 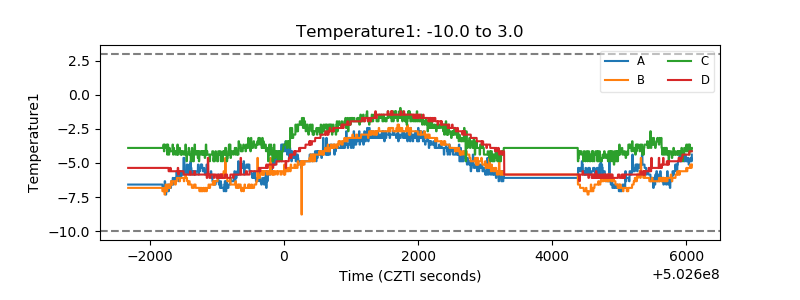 |
| Veto HV Monitor | 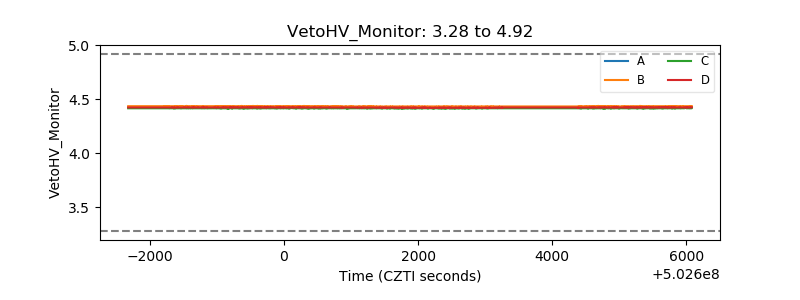 |
| Veto LLD | 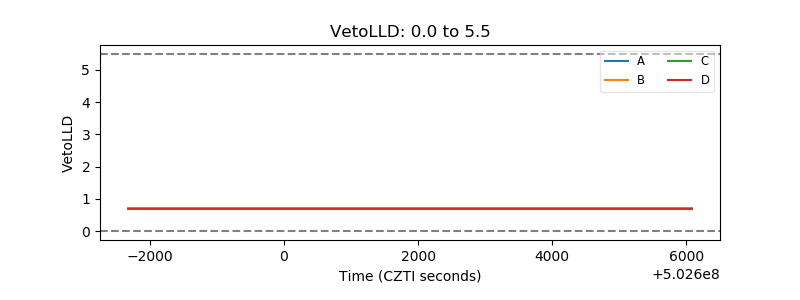 |
| Alpha Counter | 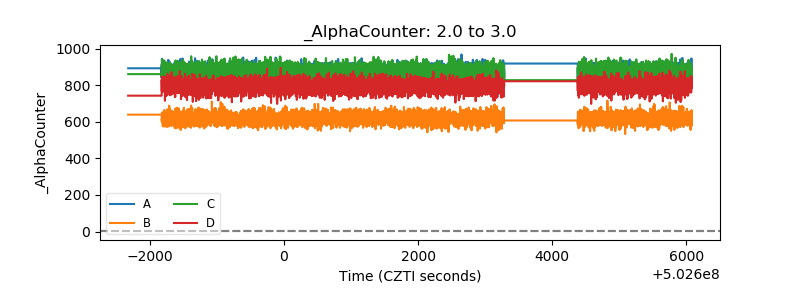 |
| _CPM_Rate | 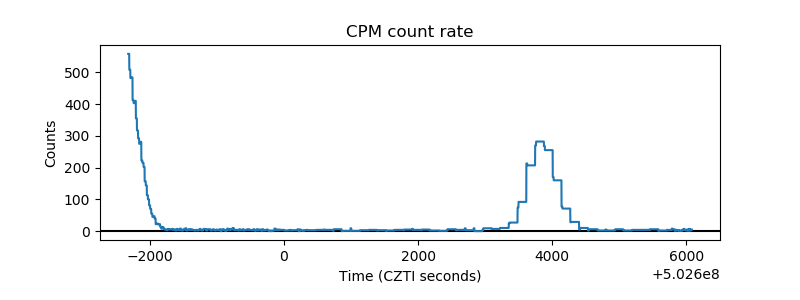 |
| CZT Counter | 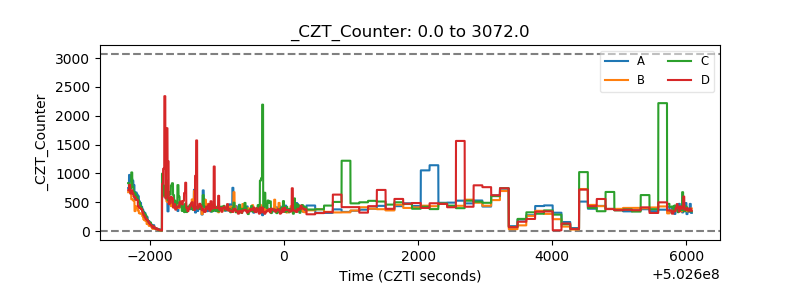 |
| +2.5 Volts monitor |  |
| +5 Volts monitor | 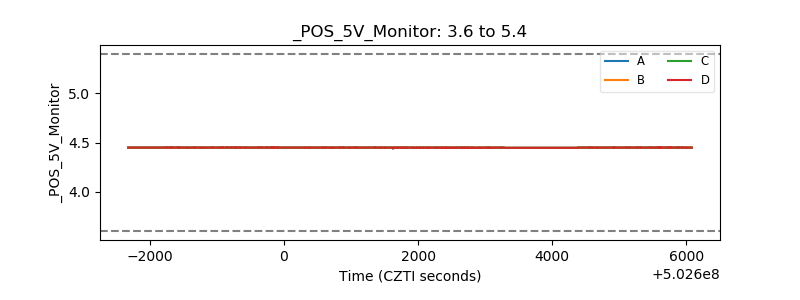 |
| _ROLL_ROT | 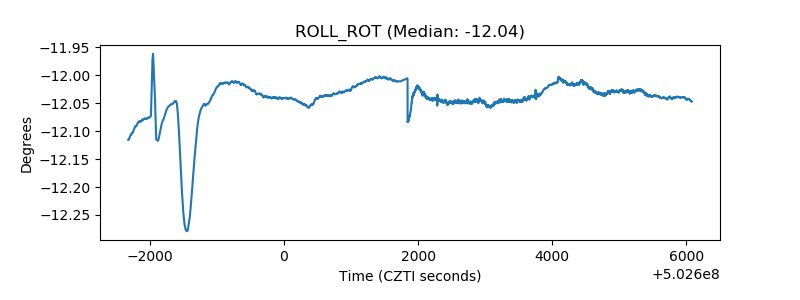 |
| _Roll_DEC | 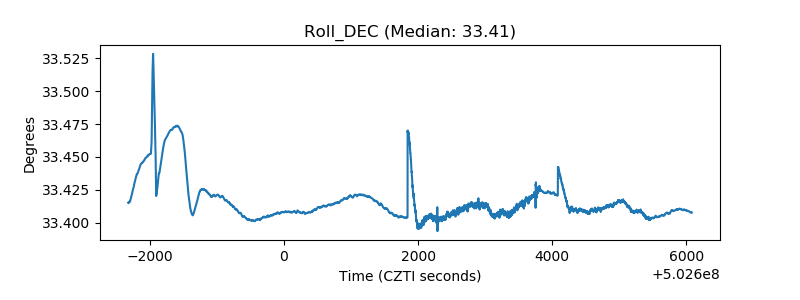 |
| _Roll_RA | 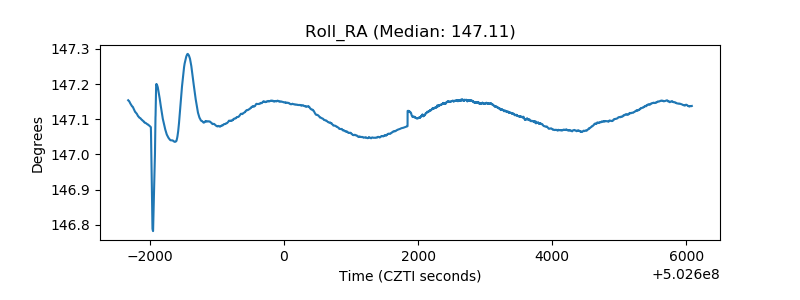 |
| Veto Counter |  |