| Param | Original file | Final file |
|---|---|---|
| Filename | modeM0/AS1A14_022T16_9000006532_55114cztM0_level2.fits | modeM0/AS1A14_022T16_9000006532_55114cztM0_level2_quad_clean.evt |
| Size (bytes) | 361,100,160 | 101,099,520 |
| Size | 344.4 MB | 96.4 MB |
| Events in quadrant A | 2,975,649 | 658,449 |
| Events in quadrant B | 2,960,374 | 708,940 |
| Events in quadrant C | 3,332,424 | 621,904 |
| Events in quadrant D | 3,556,252 | 587,229 |
| Mode SS | |||
|---|---|---|---|
| Quadrant | BADHDUFLAG | Total packets | Discarded packets |
| A | 0 | 142 | 0 |
| B | 0 | 142 | 0 |
| C | 0 | 142 | 0 |
| D | 0 | 142 | 0 |
| Mode M0 | |||
|---|---|---|---|
| Quadrant | BADHDUFLAG | Total packets | Discarded packets |
| A | 0 | 14283 | 2 |
| B | 0 | 14281 | 2 |
| C | 0 | 15342 | 2 |
| D | 0 | 15745 | 2 |
| Mode M9 | |||
|---|---|---|---|
| Quadrant | BADHDUFLAG | Total packets | Discarded packets |
| A | 0 | 17 | 0 |
| B | 0 | 18 | 0 |
| C | 0 | 18 | 0 |
| D | 0 | 18 | 0 |
| Quadrant | Total seconds | Saturated seconds | Saturation percentage |
|---|---|---|---|
| A | 6959 | 48 | 0.689754% |
| B | 6959 | 69 | 0.991522% |
| C | 6959 | 89 | 1.278919% |
| D | 6959 | 65 | 0.934042% |
Noise dominated data is calculated using 1-second bins in cleaned event files. If a bin has >2000 counts, and if more than 50% of those come from <1% of pixels, then it is considered to be noise-dominated and hence unusable.
| Quadrant | # 1 sec bins | Bins with >0 counts | Bins with >2000 counts | High rate bins dominated by noise | Noise dominated (total time) | Noise dominated (detector-on time) | Marked lightcurve |
|---|---|---|---|---|---|---|---|
| A | 7829 | 6961 | 0 | 0 | 0.00% | 0.00% | 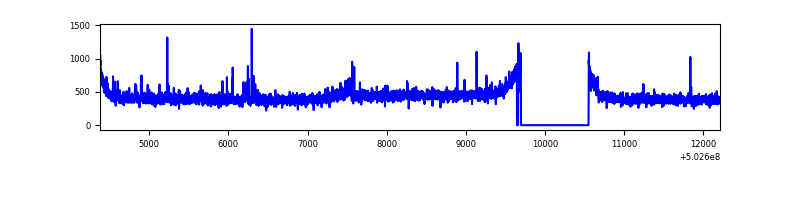 |
| B | 7829 | 6961 | 3 | 3 | 0.04% | 0.04% | 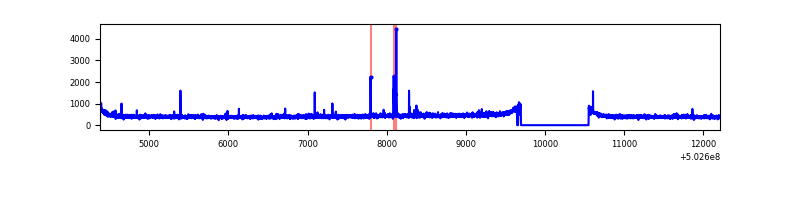 |
| C | 7829 | 6961 | 54 | 54 | 0.69% | 0.78% | 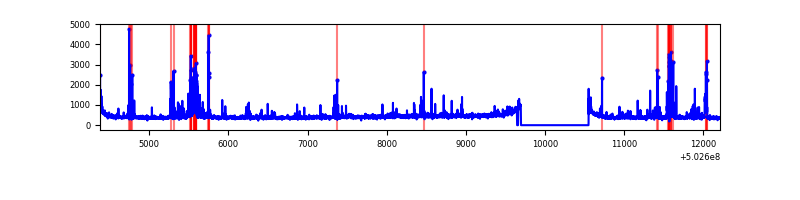 |
| D | 7829 | 6961 | 37 | 37 | 0.47% | 0.53% | 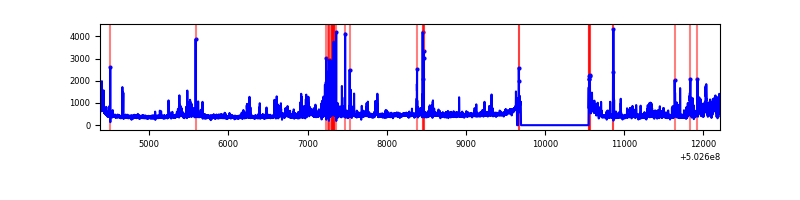 |
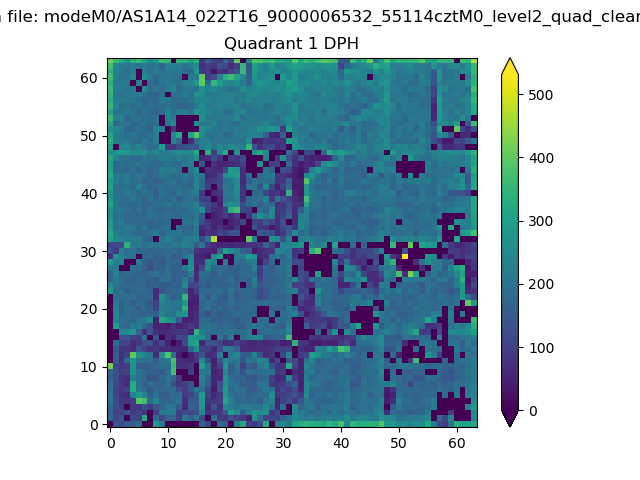
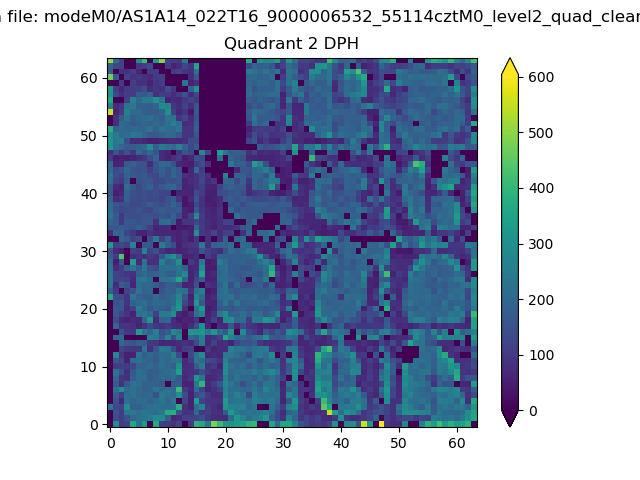
Top three noisy pixels from each quadrant. If the there are fewer than three noisy pixels in the level2.evt file, extra rows are filled as -1
| Pixel properties | Quadrant properties | ||||||
|---|---|---|---|---|---|---|---|
| Quadrant | DetID | PixID | Counts | Sigma | Mean | Median | Sigma |
| A | 0 | 8 | 19401 | 102.87 | 738 | 717 | 181.6 |
| A | 4 | 3 | 17473 | 92.25 | 738 | 717 | 181.6 |
| A | 5 | 241 | 16015 | 84.22 | 738 | 717 | 181.6 |
| B | 10 | 247 | 24569 | 151.59 | 728 | 701 | 157.4 |
| B | 12 | 111 | 19390 | 118.7 | 728 | 701 | 157.4 |
| B | 14 | 111 | 17902 | 109.25 | 728 | 701 | 157.4 |
| C | 10 | 22 | 172662 | 889.46 | 708 | 703 | 193.3 |
| C | 6 | 223 | 78569 | 402.76 | 708 | 703 | 193.3 |
| C | 13 | 3 | 74847 | 383.51 | 708 | 703 | 193.3 |
| D | 3 | 144 | 238317 | 1197.41 | 707 | 677 | 198.5 |
| D | 15 | 94 | 107869 | 540.12 | 707 | 677 | 198.5 |
| D | 12 | 6 | 99127 | 496.07 | 707 | 677 | 198.5 |
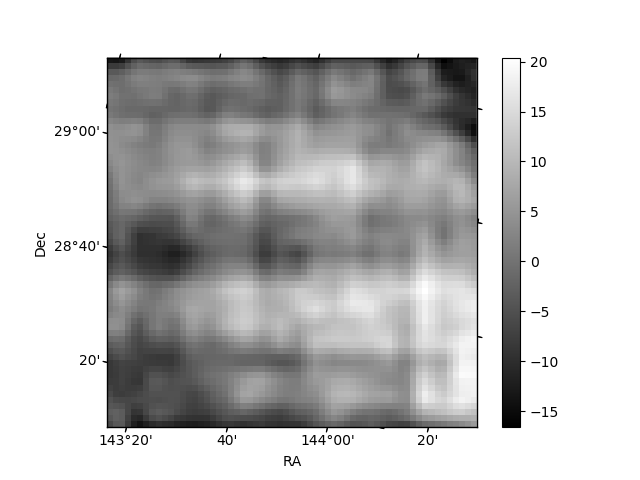
Histogram calculated using DETX and DETY for each event in the final _common_clean file
| Quadrant A | 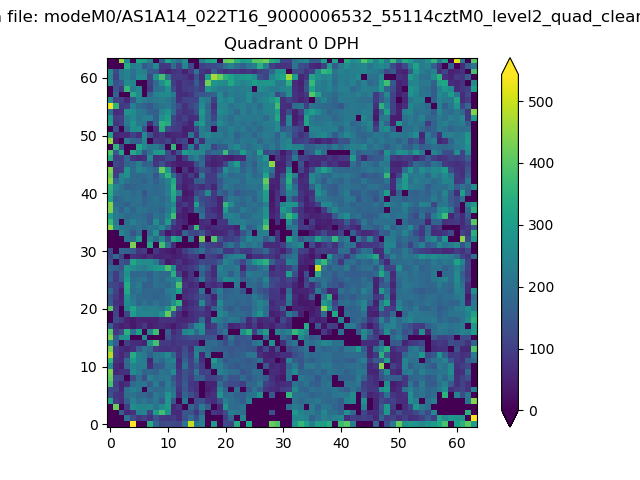 |
 |
Quadrant B |
|---|---|---|---|
| Quadrant D | 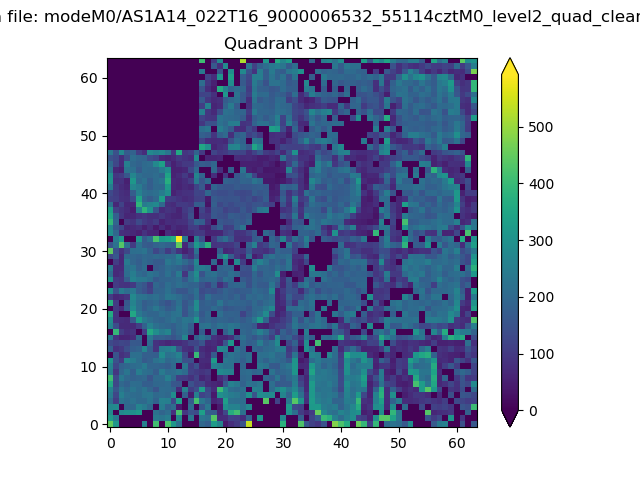 |
 |
Quadrant C |
| Plot type | Count rate plots | Images |
|---|---|---|
| Comparison with Poisson distribution Blue bars denote a histogram of data divided into 1 sec bins. Red curve is a Poisson curve with rate = median count rate of data. |
 |
 |
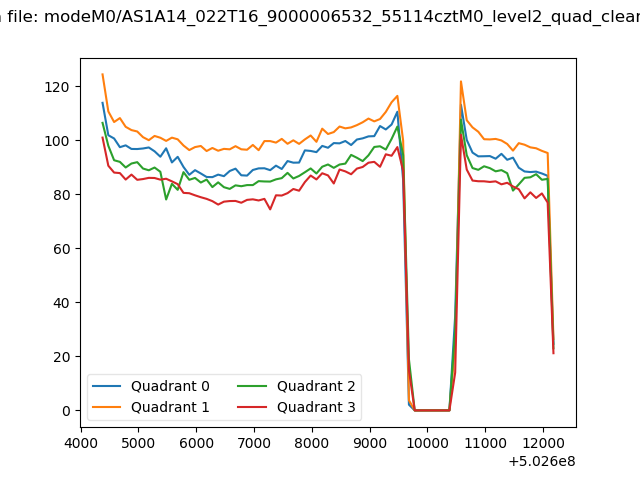
| Quadrant-wise count rates Data is divided into 100 sec bins |
 |
|
| Module-wise count rates for Quadrant A Data is divided into 100 sec bins |
 |
 |
| Module-wise count rates for Quadrant B Data is divided into 100 sec bins |
 |
 |
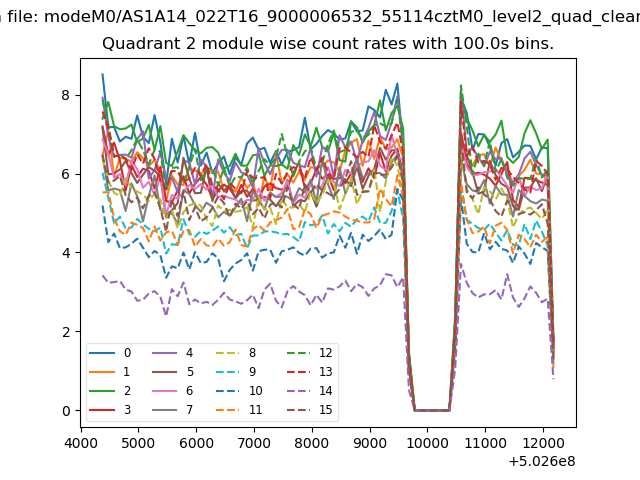
| Module-wise count rates for Quadrant C Data is divided into 100 sec bins |
 |
 |
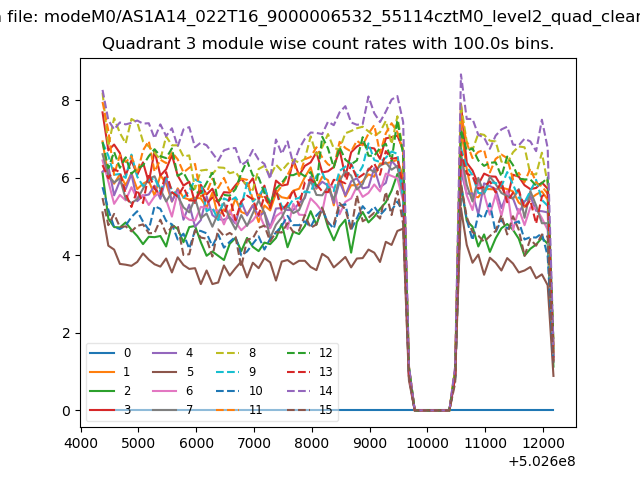
| Module-wise count rates for Quadrant D Data is divided into 100 sec bins |
 |
 |
| Parameter | Plot |
|---|---|
| CZT HV Monitor | 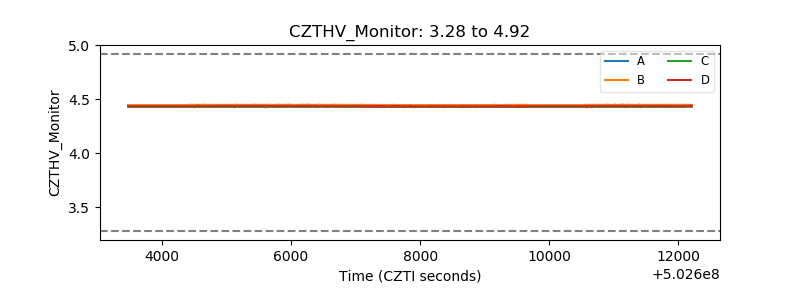 |
| D_VDD | 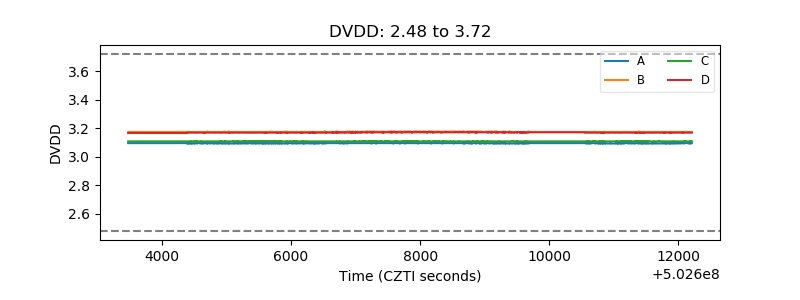 |
| Temperature 1 | 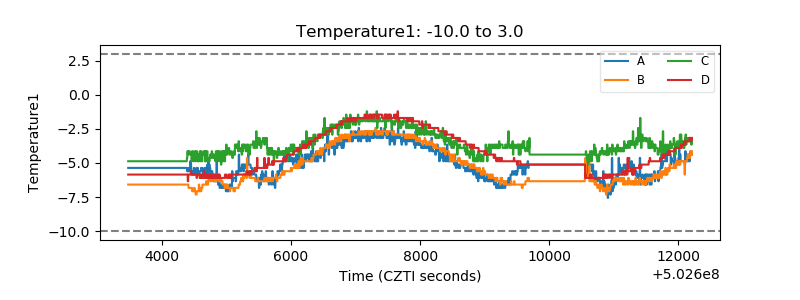 |
| Veto HV Monitor | 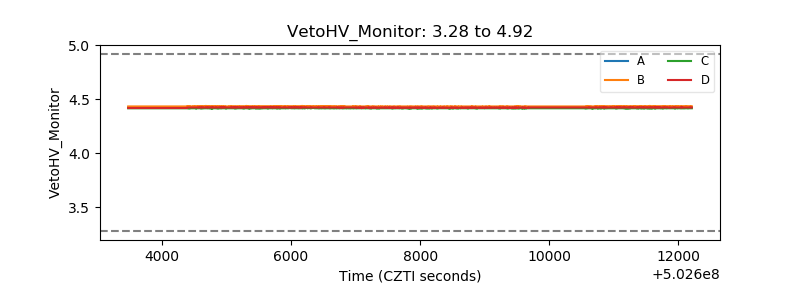 |
| Veto LLD | 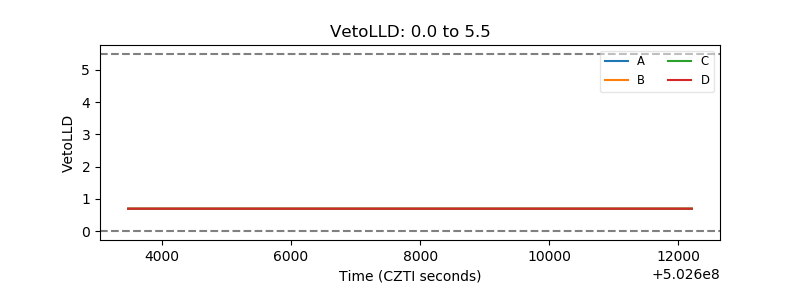 |
| Alpha Counter | 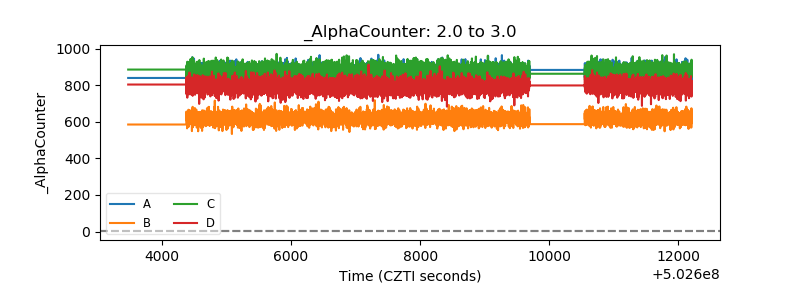 |
| _CPM_Rate | 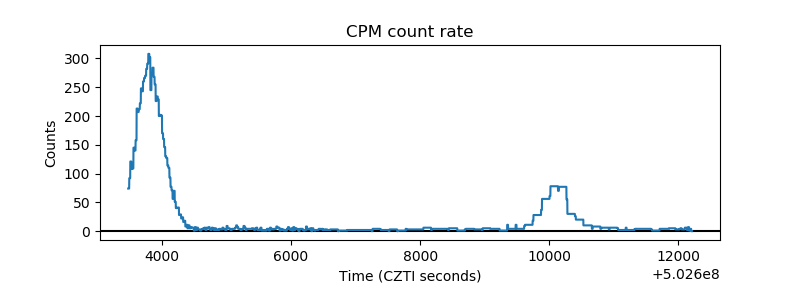 |
| CZT Counter | 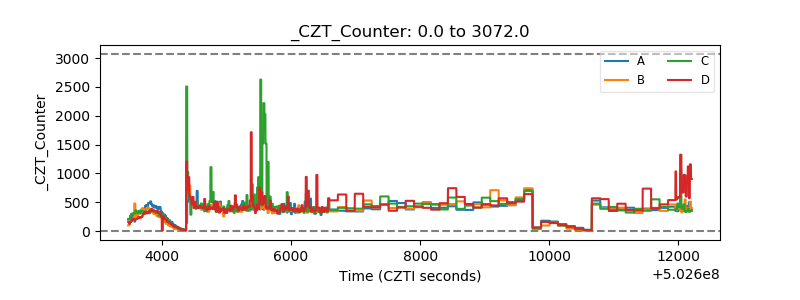 |
| +2.5 Volts monitor |  |
| +5 Volts monitor |  |
| _ROLL_ROT | 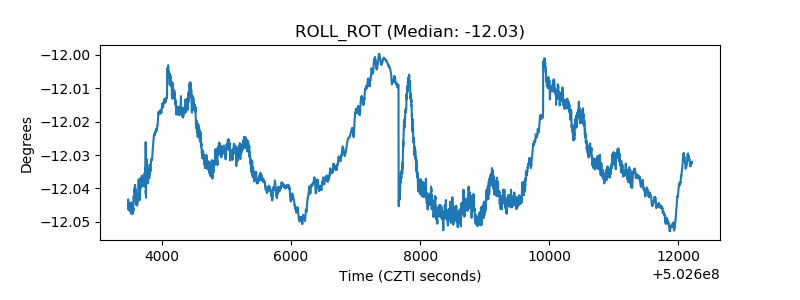 |
| _Roll_DEC | 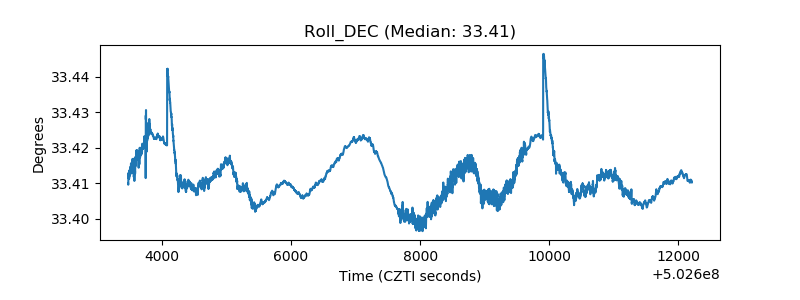 |
| _Roll_RA | 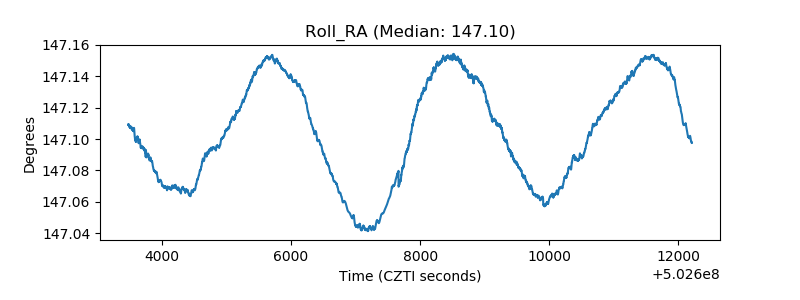 |
| Veto Counter | 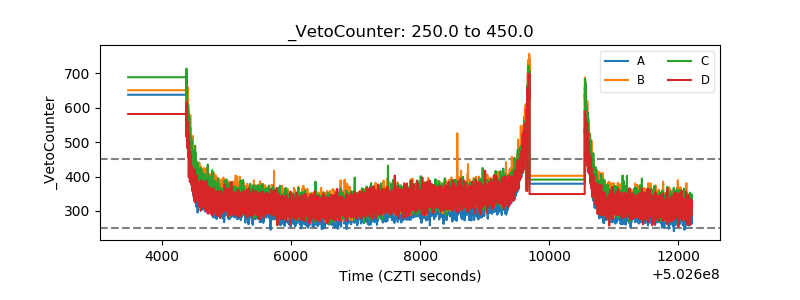 |