| Param | Original file | Final file |
|---|---|---|
| Filename | modeM0/AS1A14_022T16_9000006532_55116cztM0_level2.fits | modeM0/AS1A14_022T16_9000006532_55116cztM0_level2_quad_clean.evt |
| Size (bytes) | 1,310,362,560 | 349,208,640 |
| Size | 1.2 GB | 333.0 MB |
| Events in quadrant A | 11,417,087 | 2,260,981 |
| Events in quadrant B | 10,587,843 | 2,455,482 |
| Events in quadrant C | 11,858,569 | 2,157,902 |
| Events in quadrant D | 12,758,225 | 2,027,460 |
| Mode SS | |||
|---|---|---|---|
| Quadrant | BADHDUFLAG | Total packets | Discarded packets |
| A | 0 | 492 | 0 |
| B | 0 | 492 | 0 |
| C | 0 | 492 | 0 |
| D | 0 | 492 | 0 |
| Mode M0 | |||
|---|---|---|---|
| Quadrant | BADHDUFLAG | Total packets | Discarded packets |
| A | 0 | 52660 | 4 |
| B | 0 | 50193 | 4 |
| C | 0 | 53779 | 4 |
| D | 0 | 56108 | 4 |
| Mode M9 | |||
|---|---|---|---|
| Quadrant | BADHDUFLAG | Total packets | Discarded packets |
| A | 0 | 26 | 0 |
| B | 0 | 26 | 0 |
| C | 0 | 26 | 0 |
| D | 0 | 26 | 0 |
| Quadrant | Total seconds | Saturated seconds | Saturation percentage |
|---|---|---|---|
| A | 24295 | 594 | 2.444948% |
| B | 24295 | 354 | 1.457090% |
| C | 24294 | 382 | 1.572405% |
| D | 24294 | 470 | 1.934634% |
Noise dominated data is calculated using 1-second bins in cleaned event files. If a bin has >2000 counts, and if more than 50% of those come from <1% of pixels, then it is considered to be noise-dominated and hence unusable.
| Quadrant | # 1 sec bins | Bins with >0 counts | Bins with >2000 counts | High rate bins dominated by noise | Noise dominated (total time) | Noise dominated (detector-on time) | Marked lightcurve |
|---|---|---|---|---|---|---|---|
| A | 26490 | 24300 | 199 | 199 | 0.75% | 0.82% | 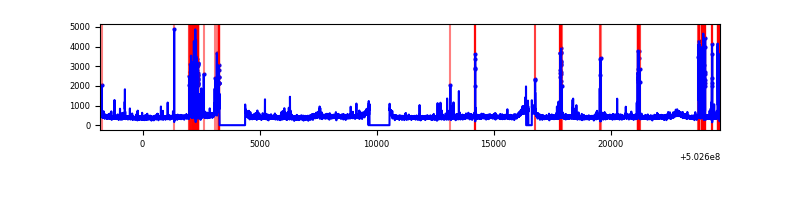 |
| B | 26490 | 24300 | 16 | 16 | 0.06% | 0.07% | 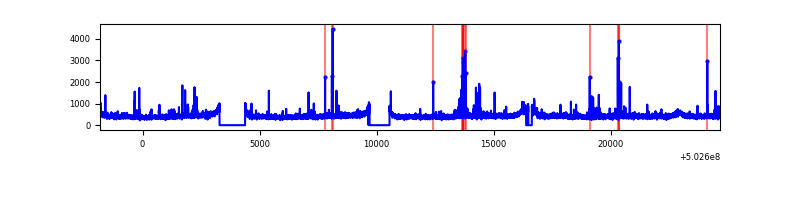 |
| C | 26489 | 24299 | 175 | 175 | 0.66% | 0.72% | 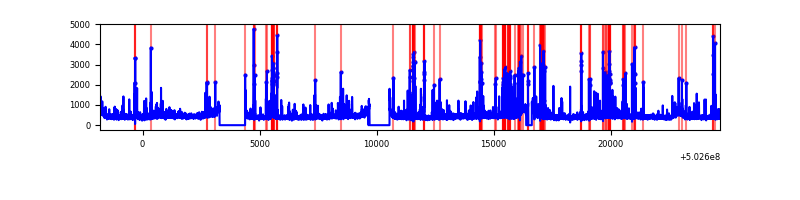 |
| D | 26489 | 24299 | 263 | 263 | 0.99% | 1.08% | 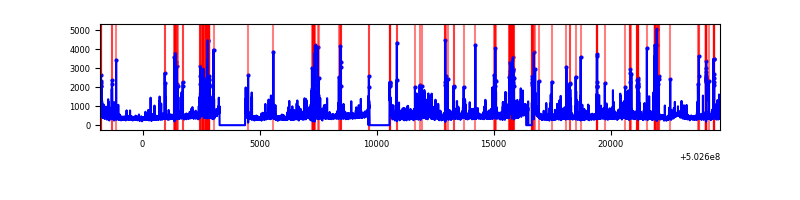 |
Top three noisy pixels from each quadrant. If the there are fewer than three noisy pixels in the level2.evt file, extra rows are filled as -1
| Pixel properties | Quadrant properties | ||||||
|---|---|---|---|---|---|---|---|
| Quadrant | DetID | PixID | Counts | Sigma | Mean | Median | Sigma |
| A | 0 | 8 | 1058688 | 1660.58 | 2587 | 2519 | 636.0 |
| A | 5 | 241 | 95736 | 146.56 | 2587 | 2519 | 636.0 |
| A | 3 | 14 | 62437 | 94.21 | 2587 | 2519 | 636.0 |
| B | 10 | 247 | 139822 | 249.37 | 2562 | 2459 | 550.8 |
| B | 0 | 63 | 132968 | 236.92 | 2562 | 2459 | 550.8 |
| B | 0 | 182 | 107524 | 190.73 | 2562 | 2459 | 550.8 |
| C | 6 | 223 | 576457 | 843.06 | 2503 | 2481 | 680.8 |
| C | 10 | 22 | 299940 | 436.91 | 2503 | 2481 | 680.8 |
| C | 3 | 242 | 188814 | 273.69 | 2503 | 2481 | 680.8 |
| D | 15 | 94 | 633485 | 895.41 | 2503 | 2394 | 704.8 |
| D | 3 | 144 | 532395 | 751.98 | 2503 | 2394 | 704.8 |
| D | 3 | 176 | 339314 | 478.03 | 2503 | 2394 | 704.8 |
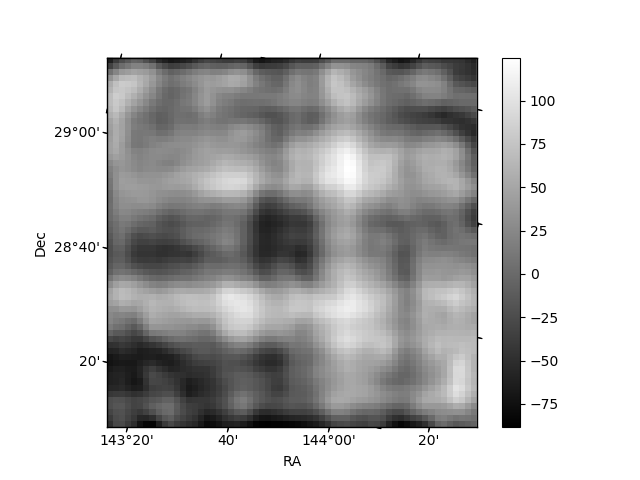
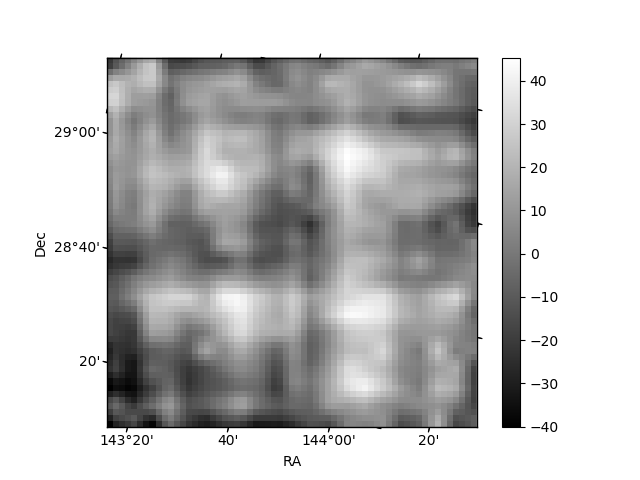
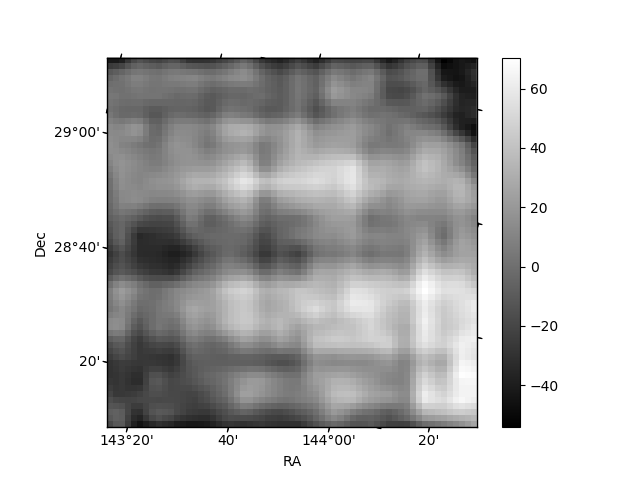
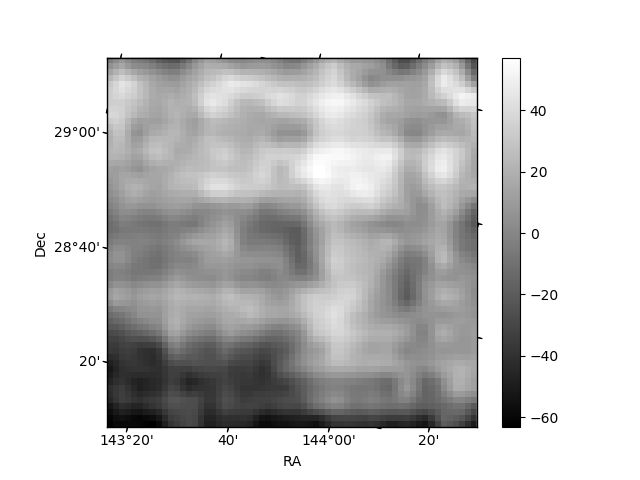
Histogram calculated using DETX and DETY for each event in the final _common_clean file
| Quadrant A | 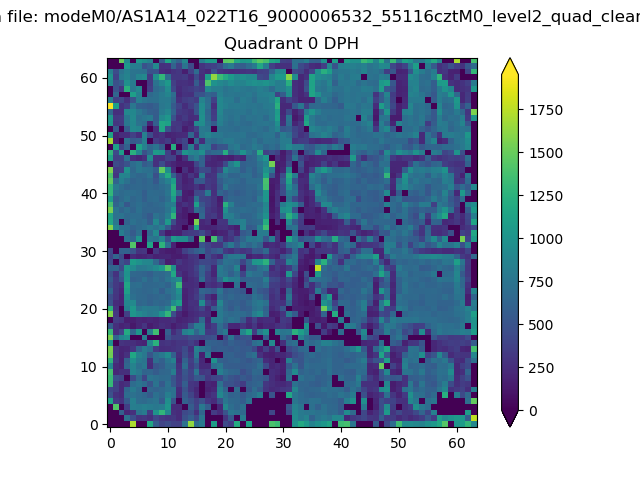 |
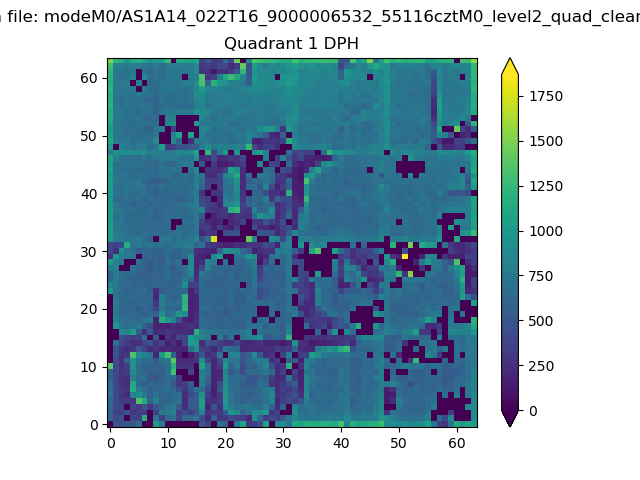 |
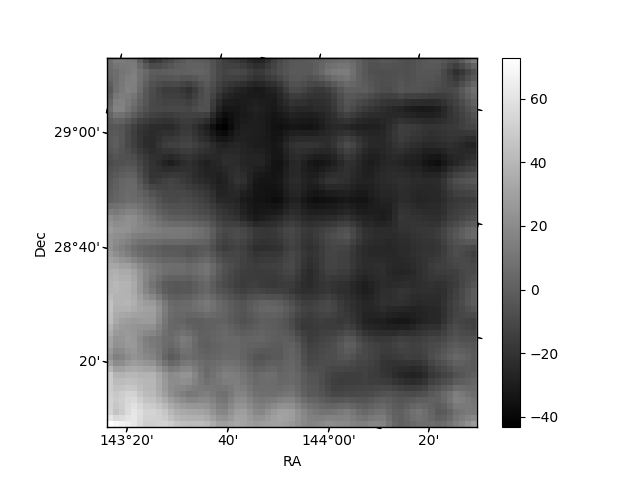
Quadrant B |
|---|---|---|---|
| Quadrant D | 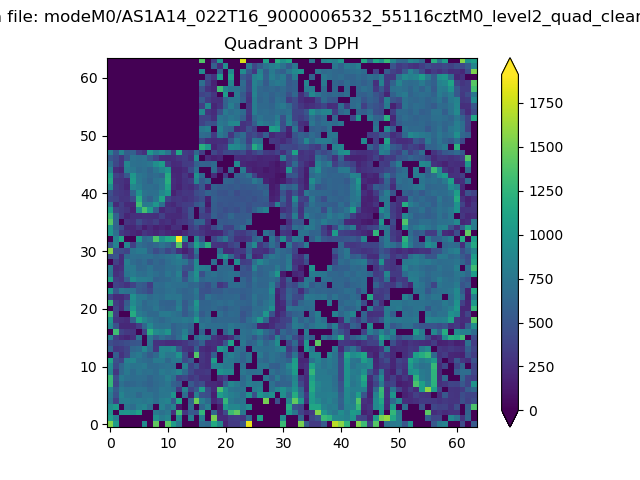 |
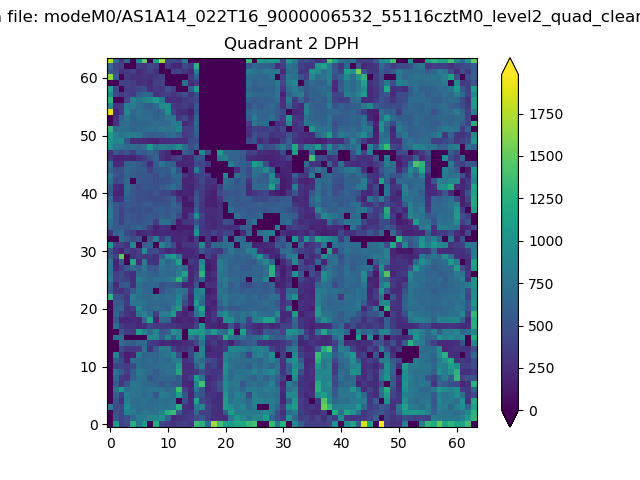 |
Quadrant C |
| Plot type | Count rate plots | Images |
|---|---|---|
| Comparison with Poisson distribution Blue bars denote a histogram of data divided into 1 sec bins. Red curve is a Poisson curve with rate = median count rate of data. |
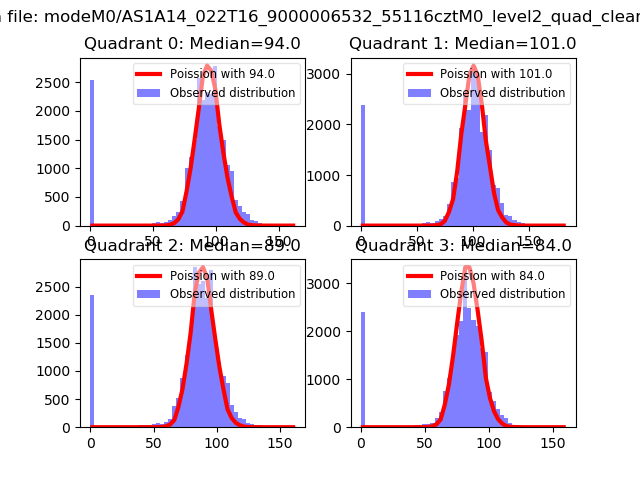 |
 |
| Quadrant-wise count rates Data is divided into 100 sec bins |
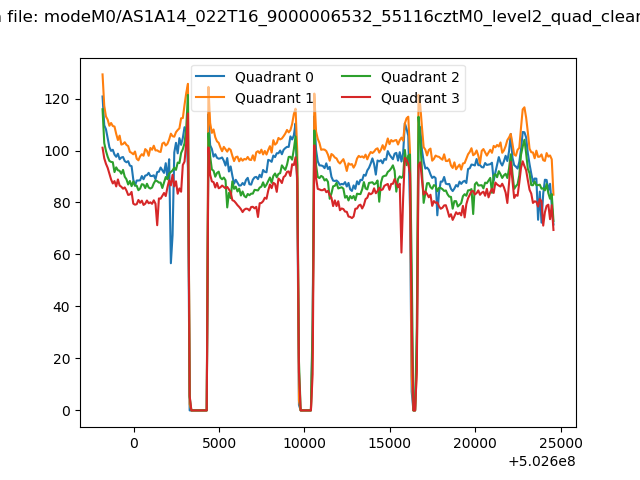 |
|
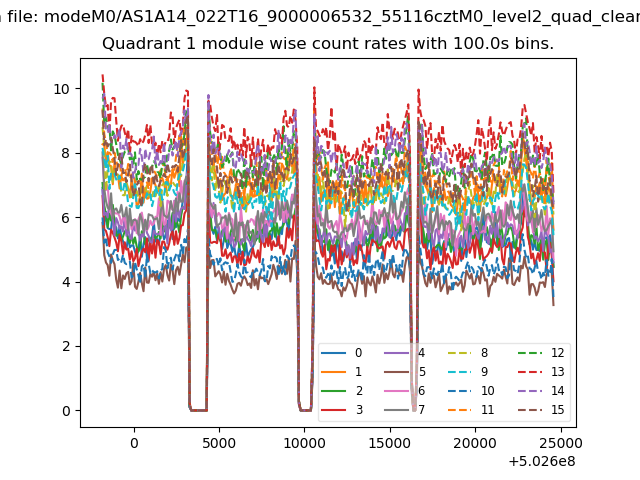
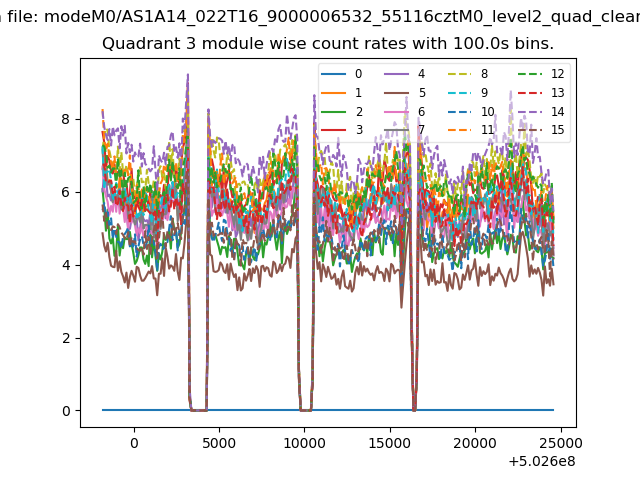
| Module-wise count rates for Quadrant A Data is divided into 100 sec bins |
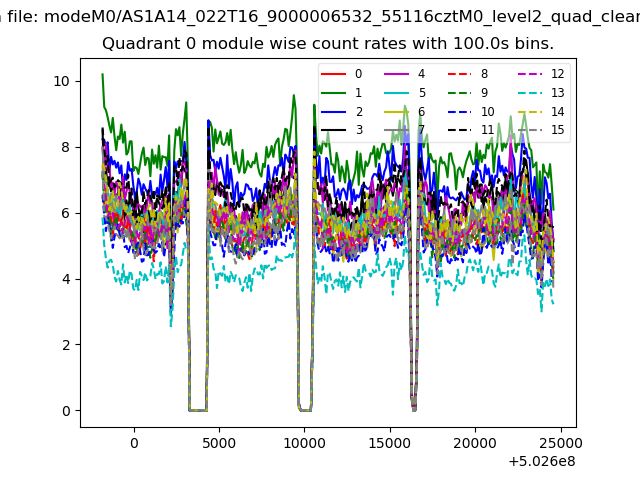 |
 |
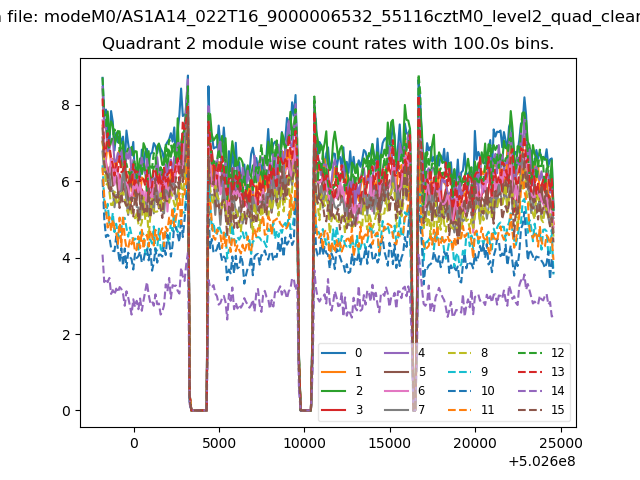
| Module-wise count rates for Quadrant B Data is divided into 100 sec bins |
 |
 |
| Module-wise count rates for Quadrant C Data is divided into 100 sec bins |
 |
 |
| Module-wise count rates for Quadrant D Data is divided into 100 sec bins |
 |
 |
| Parameter | Plot |
|---|---|
| CZT HV Monitor | 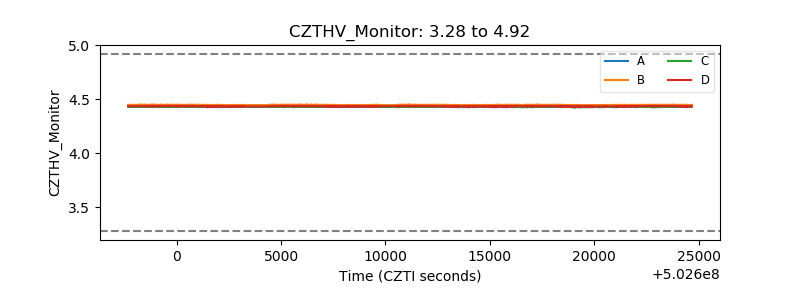 |
| D_VDD | 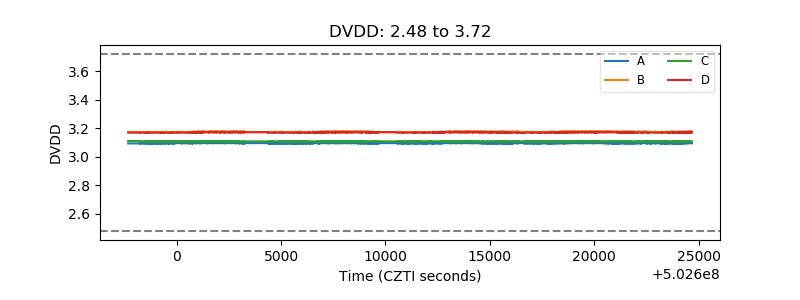 |
| Temperature 1 |  |
| Veto HV Monitor | 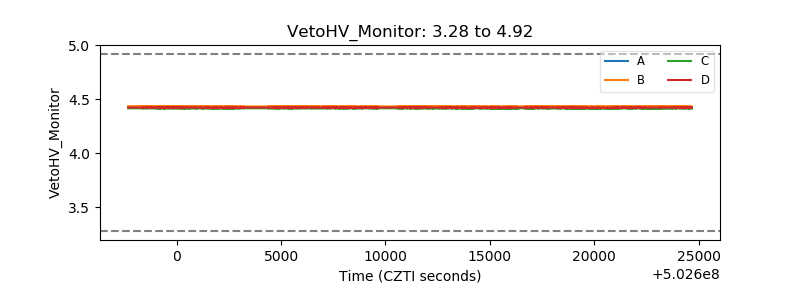 |
| Veto LLD | 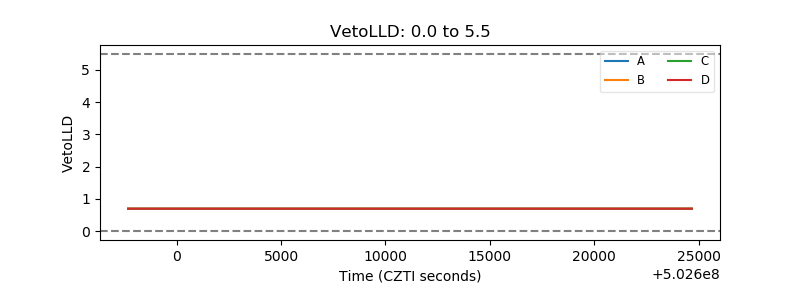 |
| Alpha Counter | 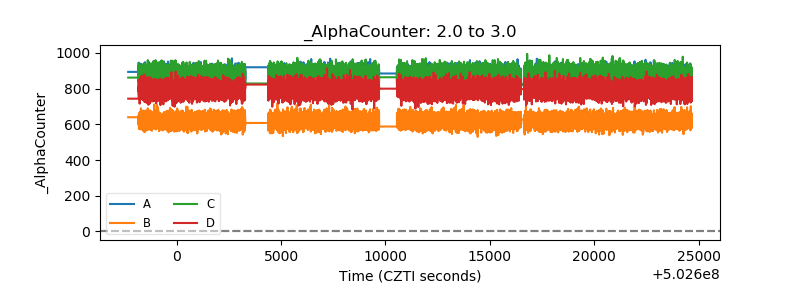 |
| _CPM_Rate | 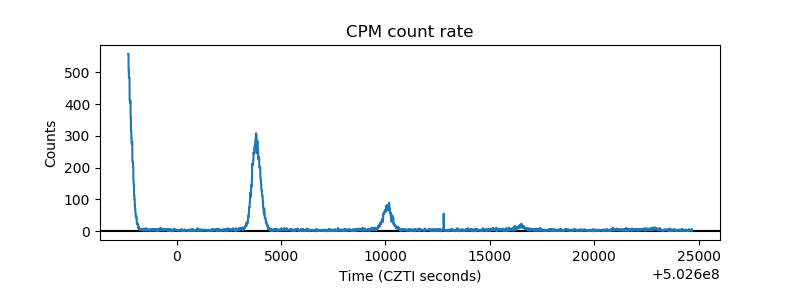 |
| CZT Counter | 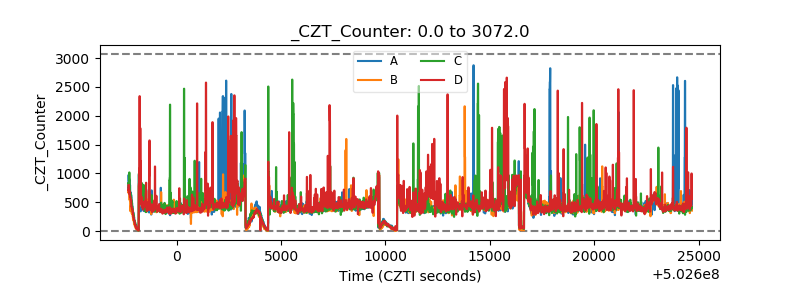 |
| +2.5 Volts monitor |  |
| +5 Volts monitor | 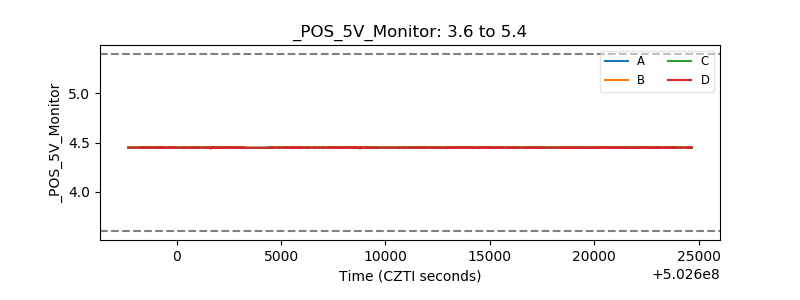 |
| _ROLL_ROT | 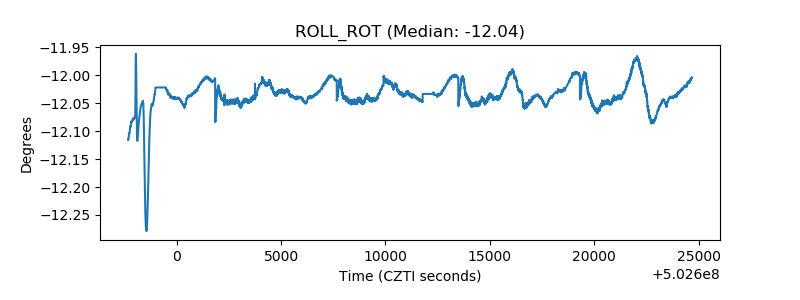 |
| _Roll_DEC | 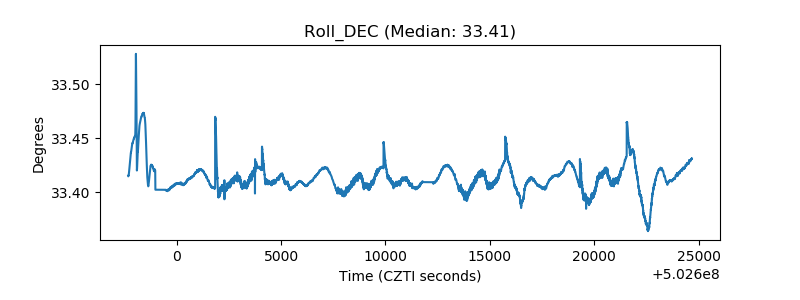 |
| _Roll_RA | 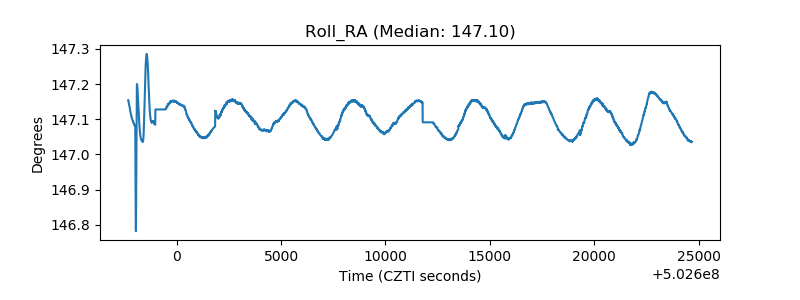 |
| Veto Counter | 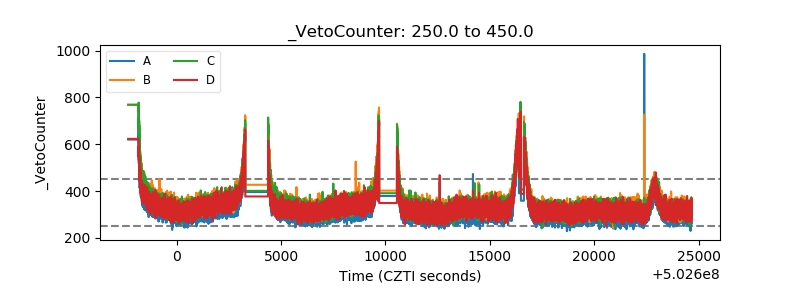 |