| Param | Original file | Final file |
|---|---|---|
| Filename | modeM0/AS1A14_022T16_9000006532_55117cztM0_level2.fits | modeM0/AS1A14_022T16_9000006532_55117cztM0_level2_quad_clean.evt |
| Size (bytes) | 475,102,080 | 107,170,560 |
| Size | 453.1 MB | 102.2 MB |
| Events in quadrant A | 4,019,635 | 691,075 |
| Events in quadrant B | 3,235,562 | 763,381 |
| Events in quadrant C | 3,603,137 | 666,400 |
| Events in quadrant D | 6,129,952 | 588,961 |
| Mode SS | |||
|---|---|---|---|
| Quadrant | BADHDUFLAG | Total packets | Discarded packets |
| A | 0 | 154 | 0 |
| B | 0 | 154 | 0 |
| C | 0 | 154 | 0 |
| D | 0 | 154 | 0 |
| Mode M0 | |||
|---|---|---|---|
| Quadrant | BADHDUFLAG | Total packets | Discarded packets |
| A | 0 | 17884 | 6 |
| B | 0 | 15620 | 0 |
| C | 0 | 16629 | 0 |
| D | 0 | 23727 | 1 |
| Quadrant | Total seconds | Saturated seconds | Saturation percentage |
|---|---|---|---|
| A | 7692 | 249 | 3.237129% |
| B | 7696 | 13 | 0.168919% |
| C | 7696 | 58 | 0.753638% |
| D | 7696 | 628 | 8.160083% |
Noise dominated data is calculated using 1-second bins in cleaned event files. If a bin has >2000 counts, and if more than 50% of those come from <1% of pixels, then it is considered to be noise-dominated and hence unusable.
| Quadrant | # 1 sec bins | Bins with >0 counts | Bins with >2000 counts | High rate bins dominated by noise | Noise dominated (total time) | Noise dominated (detector-on time) | Marked lightcurve |
|---|---|---|---|---|---|---|---|
| A | 7696 | 7694 | 192 | 192 | 2.49% | 2.50% | 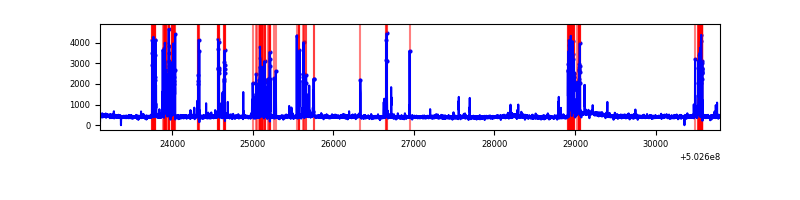 |
| B | 7696 | 7696 | 3 | 3 | 0.04% | 0.04% | 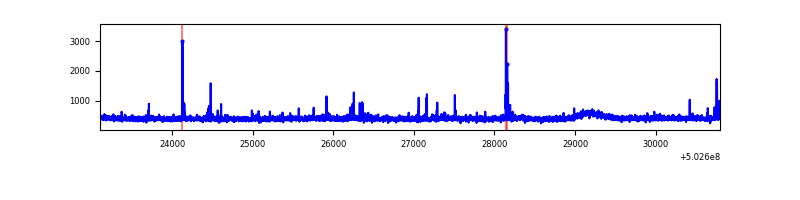 |
| C | 7696 | 7696 | 51 | 51 | 0.66% | 0.66% | 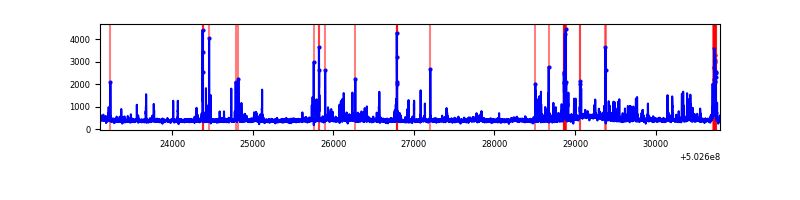 |
| D | 7697 | 7697 | 569 | 569 | 7.39% | 7.39% | 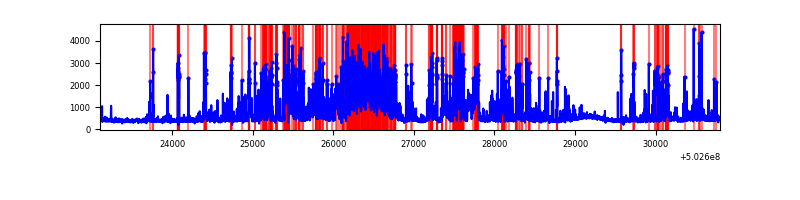 |
Top three noisy pixels from each quadrant. If the there are fewer than three noisy pixels in the level2.evt file, extra rows are filled as -1
| Pixel properties | Quadrant properties | ||||||
|---|---|---|---|---|---|---|---|
| Quadrant | DetID | PixID | Counts | Sigma | Mean | Median | Sigma |
| A | 0 | 8 | 905257 | 4637.6 | 790 | 772 | 195.0 |
| A | 4 | 3 | 15353 | 74.76 | 790 | 772 | 195.0 |
| A | 3 | 14 | 14743 | 71.63 | 790 | 772 | 195.0 |
| B | 5 | 185 | 28575 | 163.05 | 790 | 761 | 170.6 |
| B | 0 | 182 | 24758 | 140.67 | 790 | 761 | 170.6 |
| B | 10 | 247 | 23500 | 133.3 | 790 | 761 | 170.6 |
| C | 13 | 3 | 226697 | 1074.66 | 770 | 760 | 210.2 |
| C | 14 | 254 | 97884 | 461.97 | 770 | 760 | 210.2 |
| C | 12 | 2 | 59356 | 278.71 | 770 | 760 | 210.2 |
| D | 4 | 221 | 1301249 | 6129.29 | 750 | 718 | 212.2 |
| D | 11 | 129 | 881943 | 4153.14 | 750 | 718 | 212.2 |
| D | 12 | 6 | 156613 | 734.72 | 750 | 718 | 212.2 |
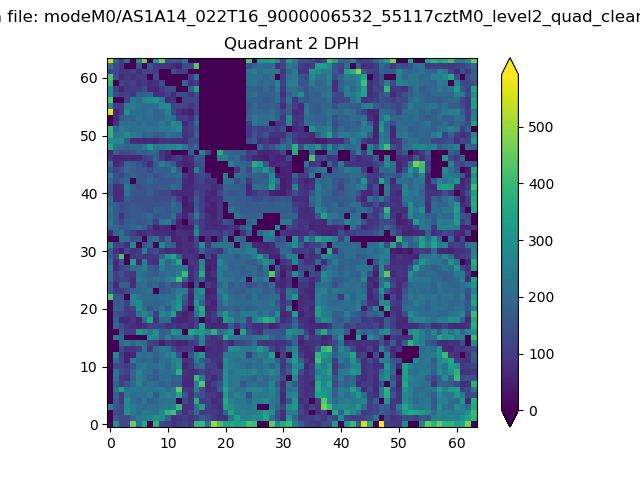
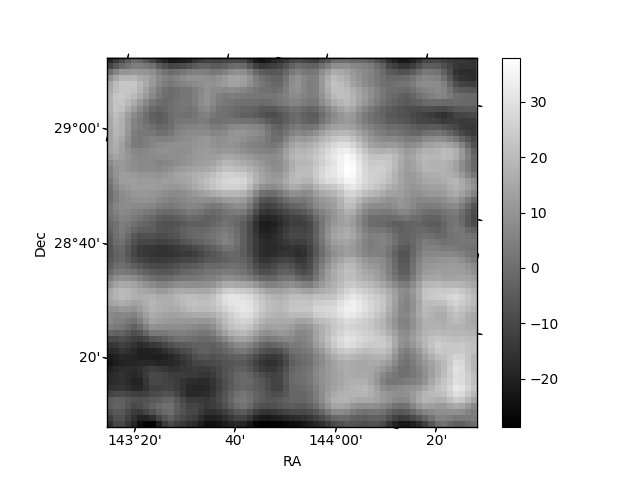
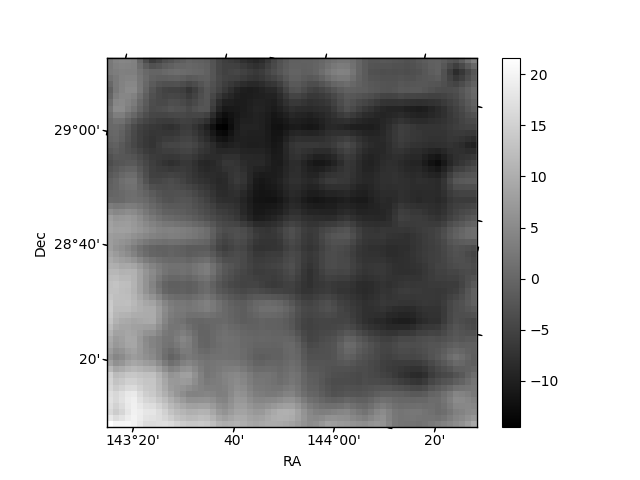
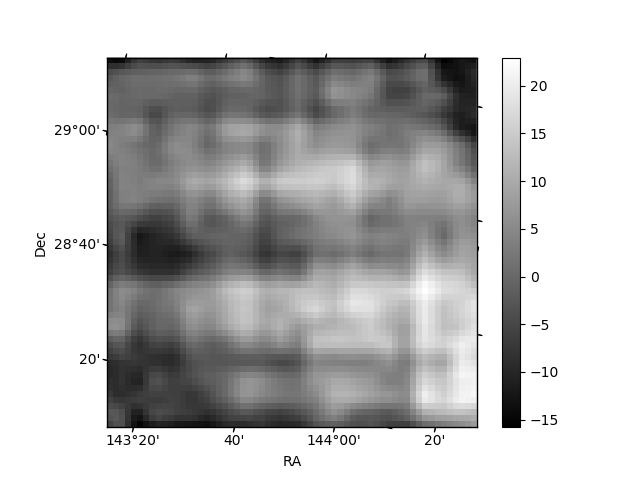
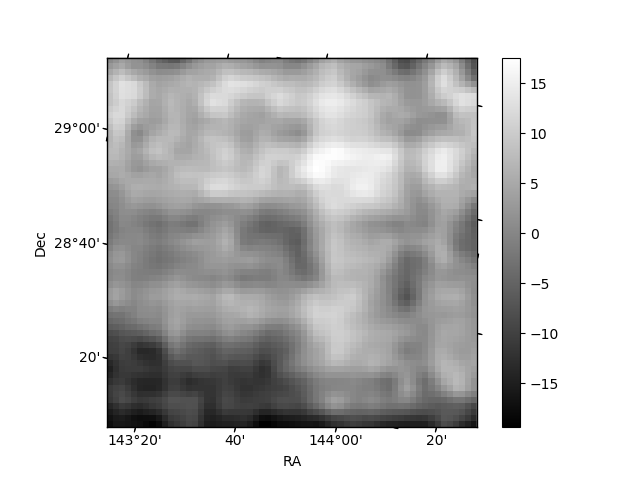
Histogram calculated using DETX and DETY for each event in the final _common_clean file
| Quadrant A | 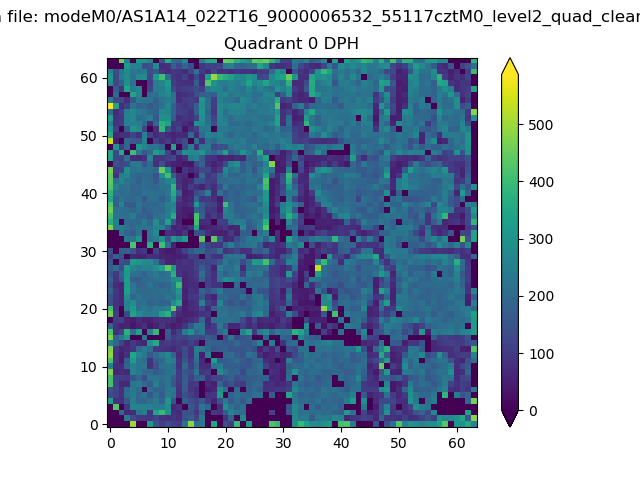 |
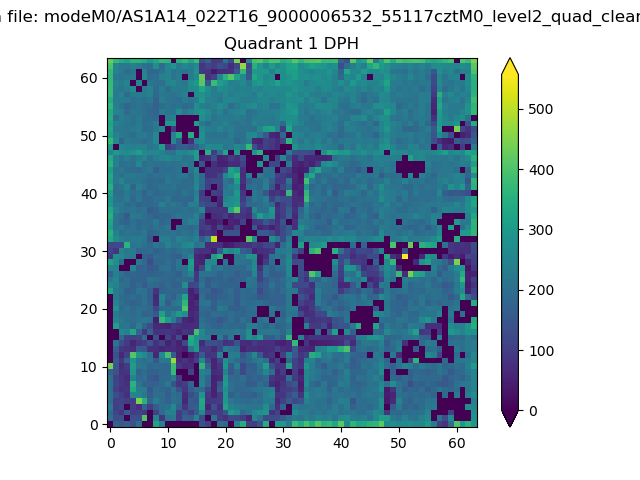 |
Quadrant B |
|---|---|---|---|
| Quadrant D | 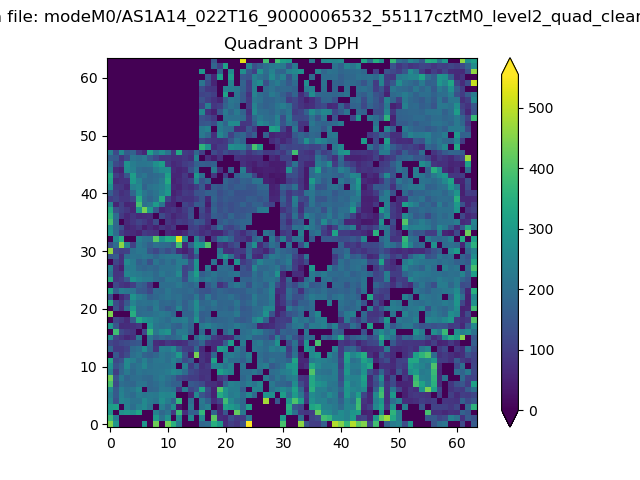 |
 |
Quadrant C |
| Plot type | Count rate plots | Images |
|---|---|---|
| Comparison with Poisson distribution Blue bars denote a histogram of data divided into 1 sec bins. Red curve is a Poisson curve with rate = median count rate of data. |
 |
 |
| Quadrant-wise count rates Data is divided into 100 sec bins |
 |
|
| Module-wise count rates for Quadrant A Data is divided into 100 sec bins |
 |
 |
| Module-wise count rates for Quadrant B Data is divided into 100 sec bins |
 |
 |
| Module-wise count rates for Quadrant C Data is divided into 100 sec bins |
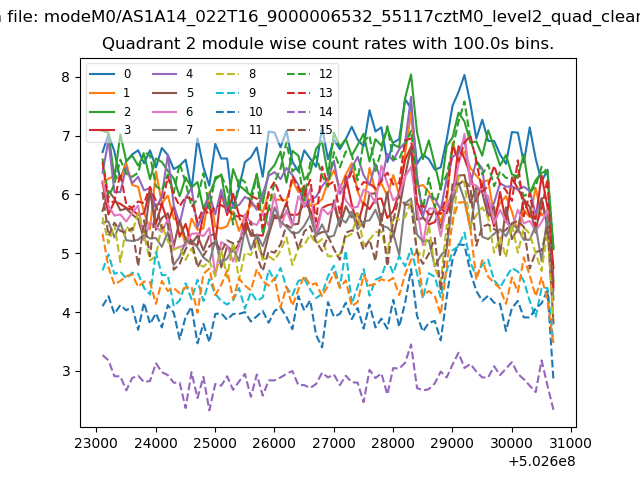 |
 |
| Module-wise count rates for Quadrant D Data is divided into 100 sec bins |
 |
 |
| Parameter | Plot |
|---|---|
| CZT HV Monitor | 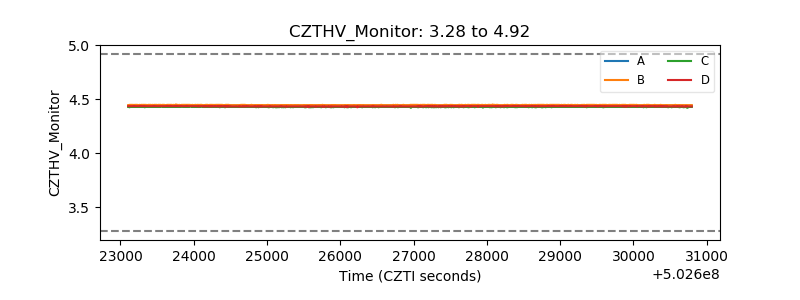 |
| D_VDD | 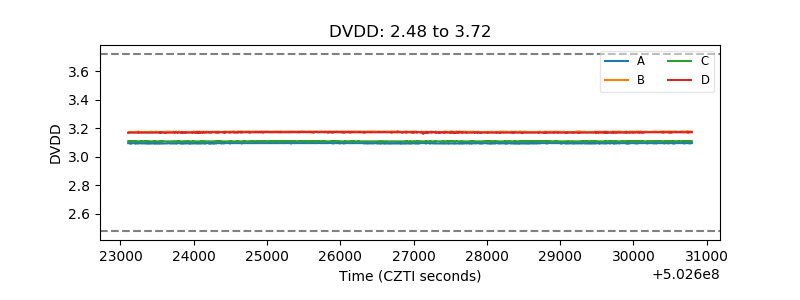 |
| Temperature 1 |  |
| Veto HV Monitor | 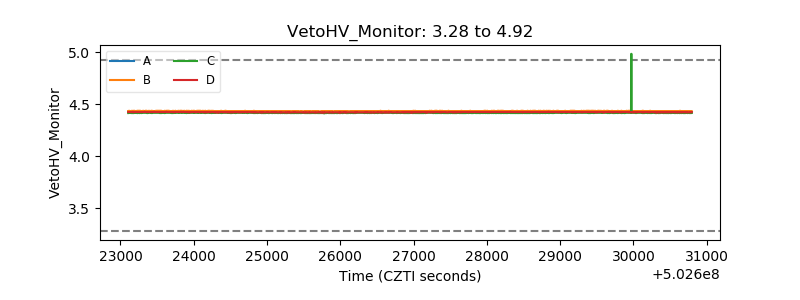 |
| Veto LLD | 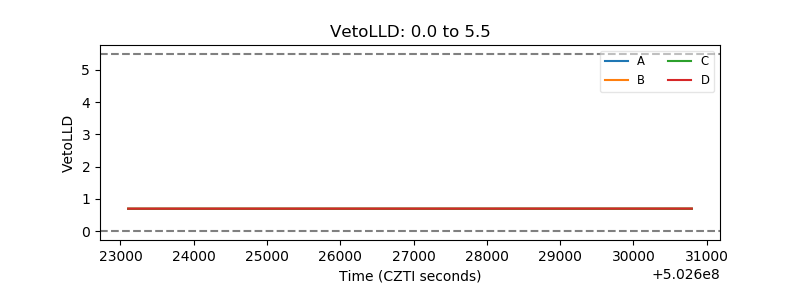 |
| Alpha Counter | 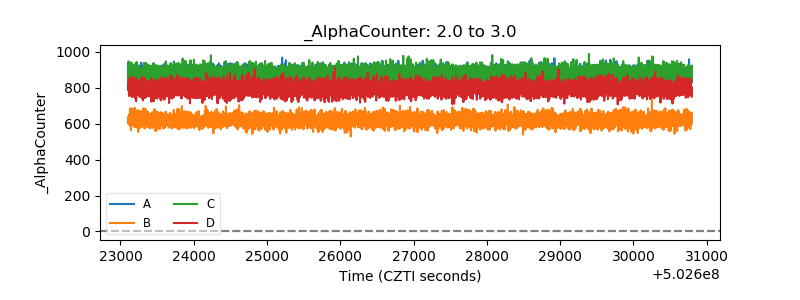 |
| _CPM_Rate | 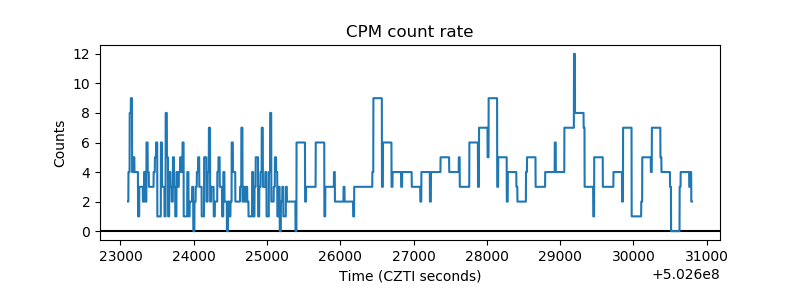 |
| CZT Counter | 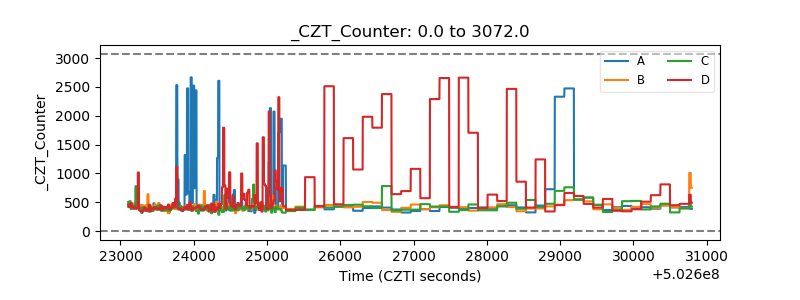 |
| +2.5 Volts monitor |  |
| +5 Volts monitor |  |
| _ROLL_ROT |  |
| _Roll_DEC |  |
| _Roll_RA | 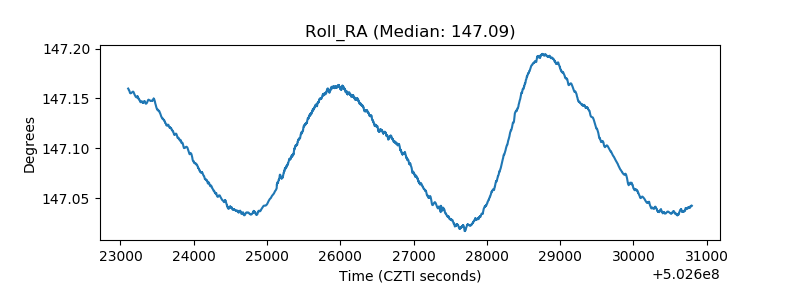 |
| Veto Counter |  |