| Param | Original file | Final file |
|---|---|---|
| Filename | modeM0/AS1A14_022T16_9000006532_55120cztM0_level2.fits | modeM0/AS1A14_022T16_9000006532_55120cztM0_level2_quad_clean.evt |
| Size (bytes) | 752,725,440 | 151,623,360 |
| Size | 717.9 MB | 144.6 MB |
| Events in quadrant A | 4,873,859 | 1,009,614 |
| Events in quadrant B | 4,666,393 | 1,088,652 |
| Events in quadrant C | 5,924,217 | 947,619 |
| Events in quadrant D | 11,547,498 | 785,169 |
| Mode SS | |||
|---|---|---|---|
| Quadrant | BADHDUFLAG | Total packets | Discarded packets |
| A | 0 | 220 | 0 |
| B | 0 | 220 | 0 |
| C | 0 | 219 | 0 |
| D | 0 | 220 | 0 |
| Mode M0 | |||
|---|---|---|---|
| Quadrant | BADHDUFLAG | Total packets | Discarded packets |
| A | 0 | 23229 | 45 |
| B | 0 | 22571 | 36 |
| C | 0 | 25842 | 72 |
| D | 0 | 42071 | 150 |
| Quadrant | Total seconds | Saturated seconds | Saturation percentage |
|---|---|---|---|
| A | 10980 | 125 | 1.138434% |
| B | 10983 | 52 | 0.473459% |
| C | 10973 | 153 | 1.394332% |
| D | 10969 | 1686 | 15.370590% |
Noise dominated data is calculated using 1-second bins in cleaned event files. If a bin has >2000 counts, and if more than 50% of those come from <1% of pixels, then it is considered to be noise-dominated and hence unusable.
| Quadrant | # 1 sec bins | Bins with >0 counts | Bins with >2000 counts | High rate bins dominated by noise | Noise dominated (total time) | Noise dominated (detector-on time) | Marked lightcurve |
|---|---|---|---|---|---|---|---|
| A | 11011 | 11001 | 77 | 77 | 0.70% | 0.70% | 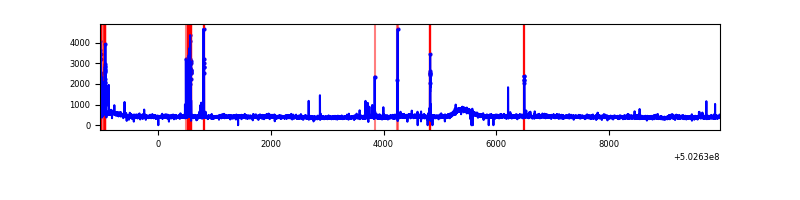 |
| B | 11011 | 11003 | 2 | 2 | 0.02% | 0.02% | 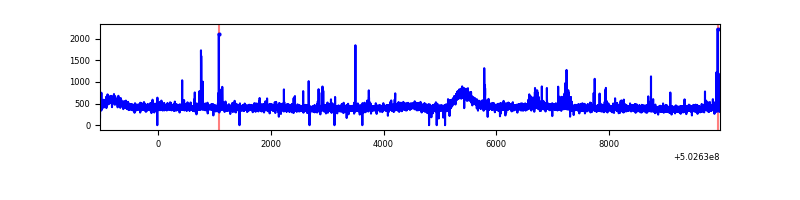 |
| C | 11011 | 10995 | 142 | 142 | 1.29% | 1.29% | 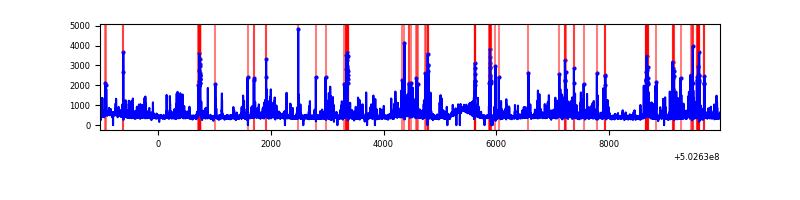 |
| D | 11011 | 10997 | 1521 | 1521 | 13.81% | 13.83% | 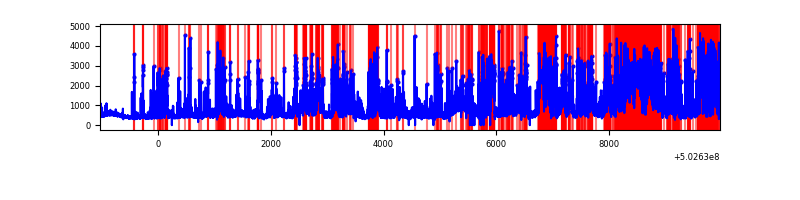 |
Top three noisy pixels from each quadrant. If the there are fewer than three noisy pixels in the level2.evt file, extra rows are filled as -1
| Pixel properties | Quadrant properties | ||||||
|---|---|---|---|---|---|---|---|
| Quadrant | DetID | PixID | Counts | Sigma | Mean | Median | Sigma |
| A | 0 | 8 | 290525 | 1008.62 | 1154 | 1123 | 286.9 |
| A | 4 | 3 | 39043 | 132.16 | 1154 | 1123 | 286.9 |
| A | 3 | 14 | 31796 | 106.9 | 1154 | 1123 | 286.9 |
| B | 0 | 182 | 69260 | 276.72 | 1145 | 1101 | 246.3 |
| B | 12 | 111 | 30380 | 118.87 | 1145 | 1101 | 246.3 |
| B | 11 | 111 | 28335 | 110.57 | 1145 | 1101 | 246.3 |
| C | 6 | 223 | 457245 | 1509.2 | 1118 | 1105 | 302.2 |
| C | 13 | 3 | 324692 | 1070.63 | 1118 | 1105 | 302.2 |
| C | 12 | 249 | 259054 | 853.46 | 1118 | 1105 | 302.2 |
| D | 11 | 129 | 2983043 | 10106.52 | 1049 | 1003 | 295.1 |
| D | 15 | 94 | 1535505 | 5200.62 | 1049 | 1003 | 295.1 |
| D | 4 | 221 | 1531474 | 5186.96 | 1049 | 1003 | 295.1 |
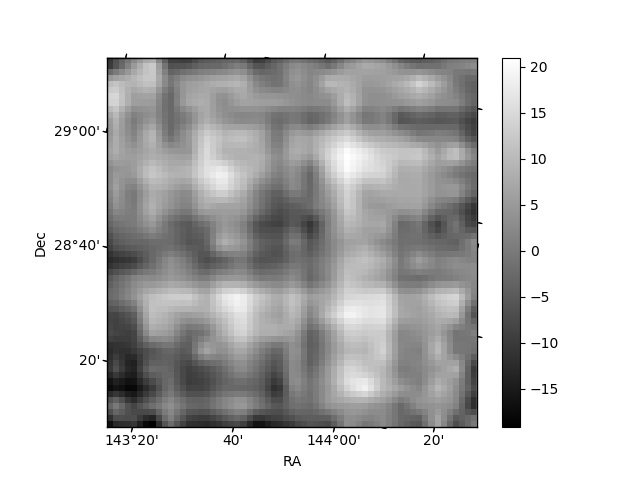
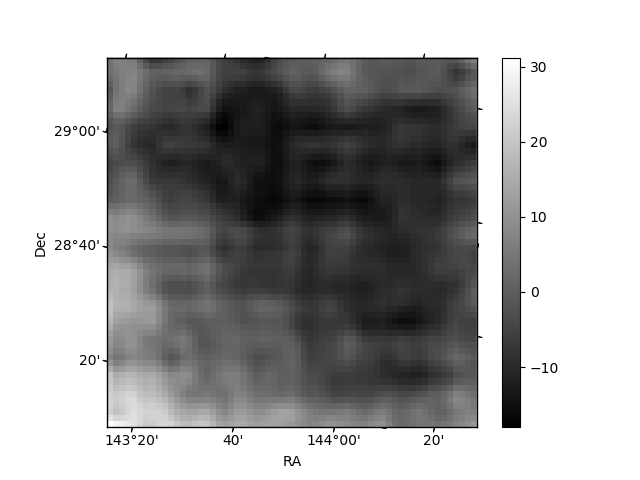
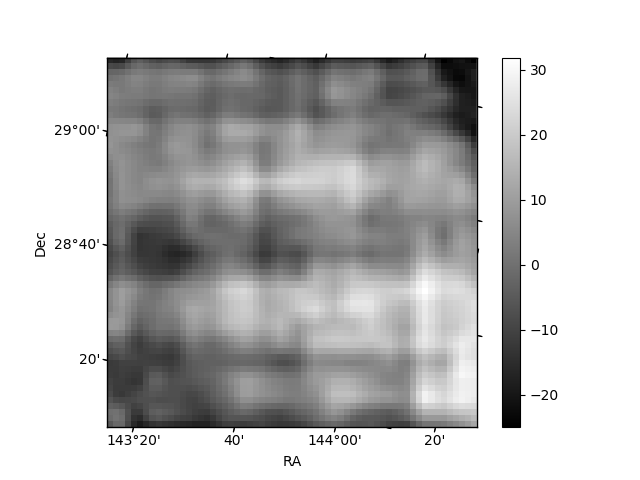
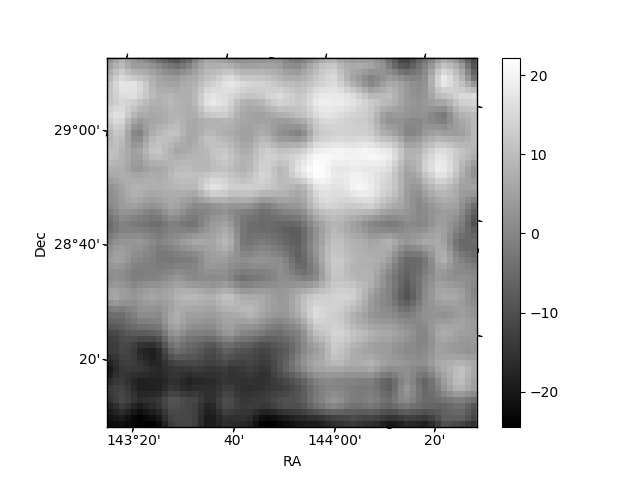
Histogram calculated using DETX and DETY for each event in the final _common_clean file
| Quadrant A | 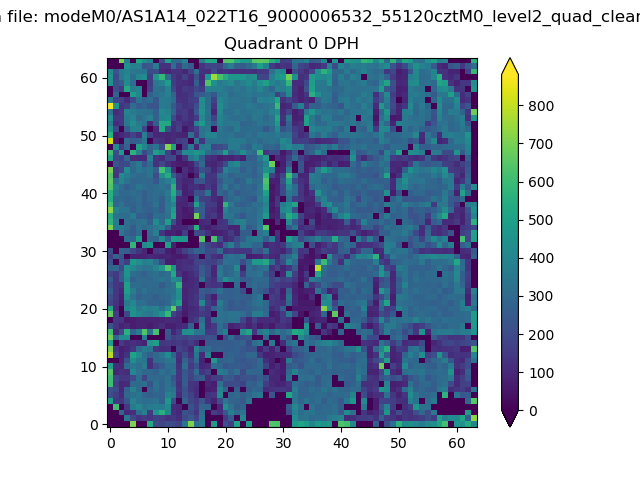 |
 |
Quadrant B |
|---|---|---|---|
| Quadrant D | 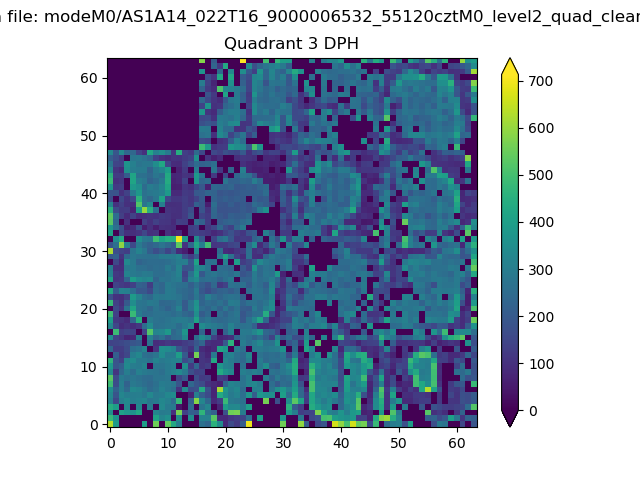 |
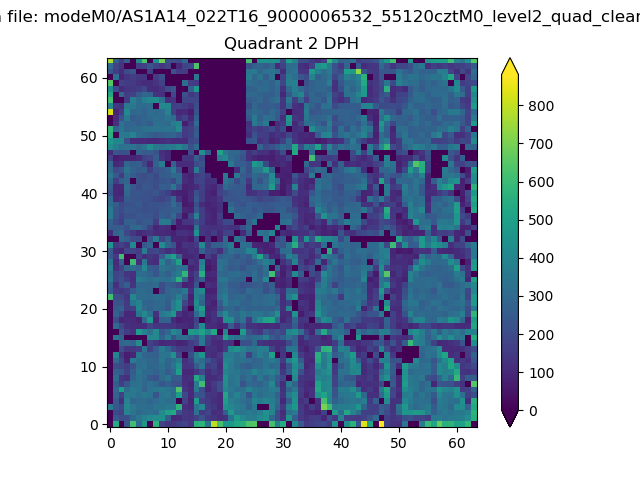 |
Quadrant C |
| Plot type | Count rate plots | Images |
|---|---|---|
| Comparison with Poisson distribution Blue bars denote a histogram of data divided into 1 sec bins. Red curve is a Poisson curve with rate = median count rate of data. |
 |
 |
| Quadrant-wise count rates Data is divided into 100 sec bins |
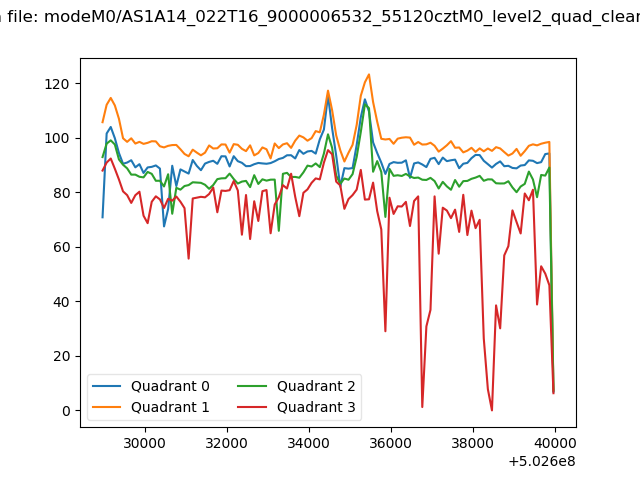 |
|
| Module-wise count rates for Quadrant A Data is divided into 100 sec bins |
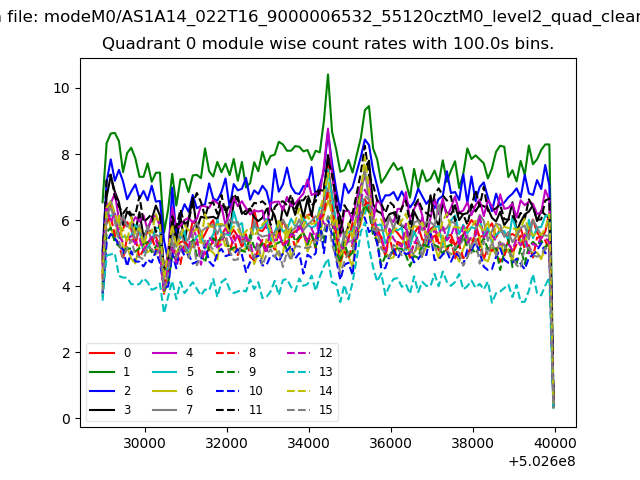 |
 |
| Module-wise count rates for Quadrant B Data is divided into 100 sec bins |
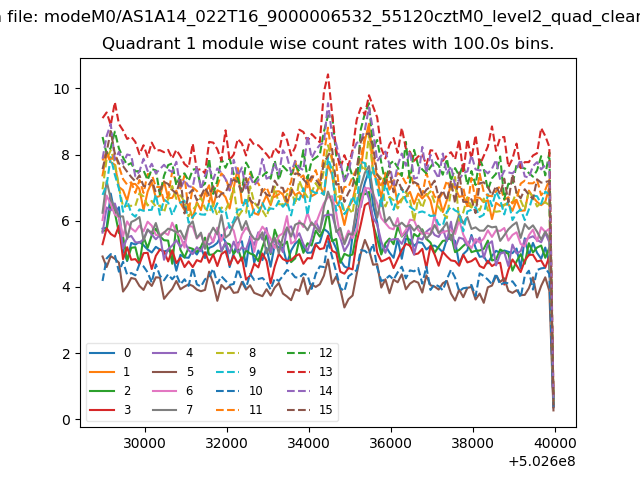 |
 |
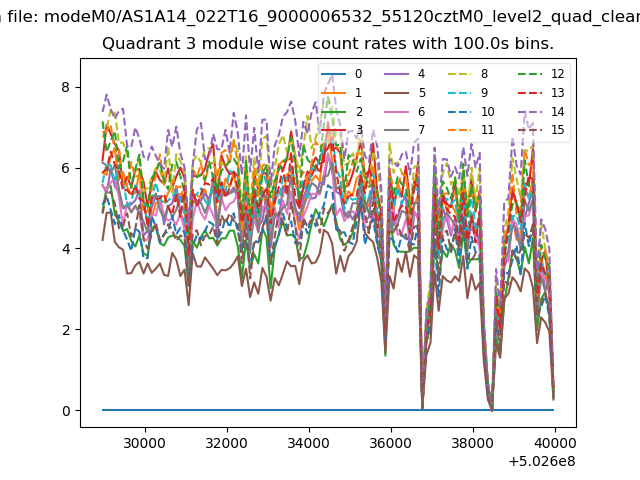
| Module-wise count rates for Quadrant C Data is divided into 100 sec bins |
 |
 |
| Module-wise count rates for Quadrant D Data is divided into 100 sec bins |
 |
 |
| Parameter | Plot |
|---|---|
| CZT HV Monitor | 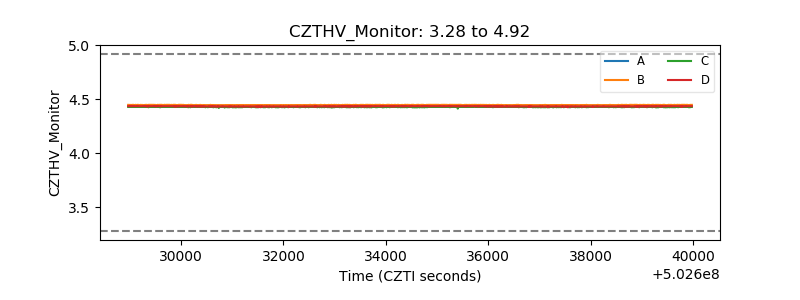 |
| D_VDD | 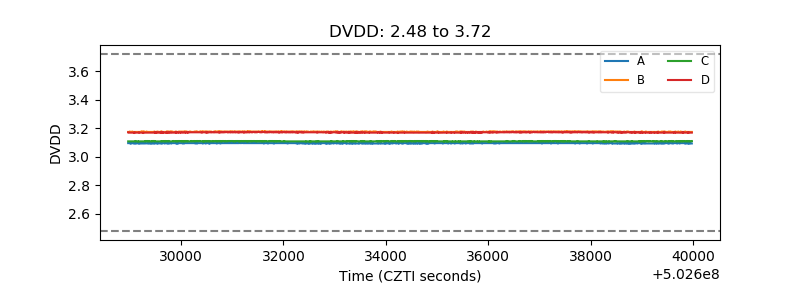 |
| Temperature 1 | 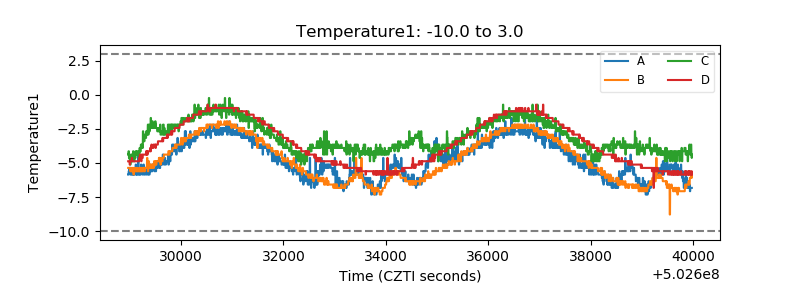 |
| Veto HV Monitor | 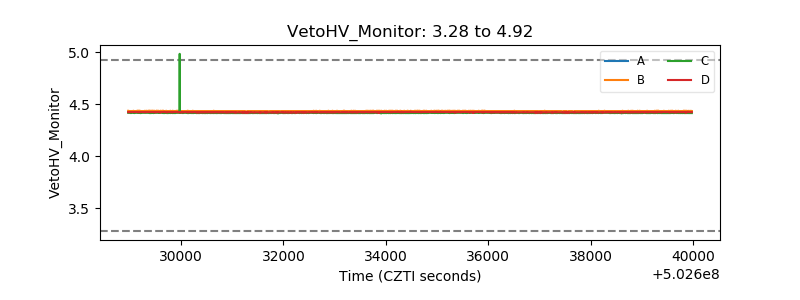 |
| Veto LLD | 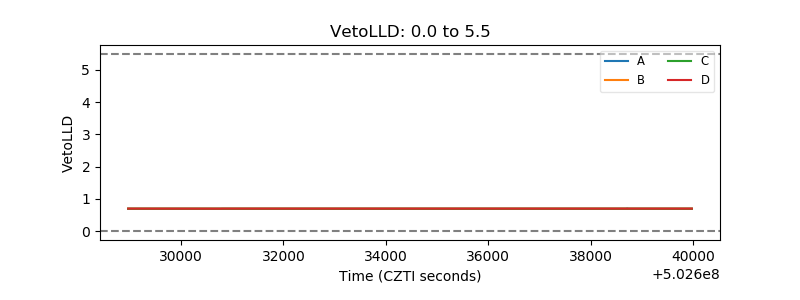 |
| Alpha Counter | 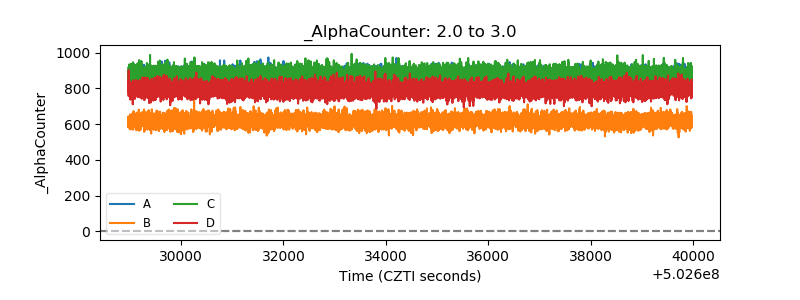 |
| _CPM_Rate | 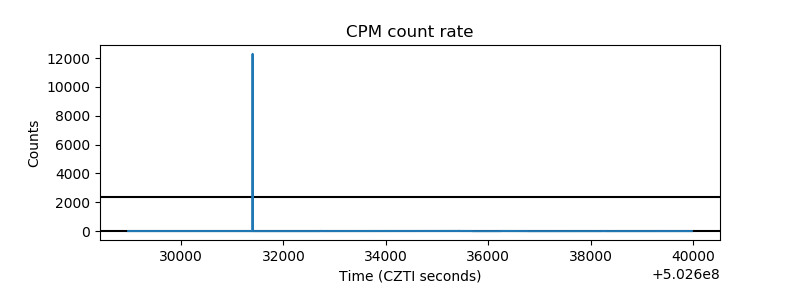 |
| CZT Counter | 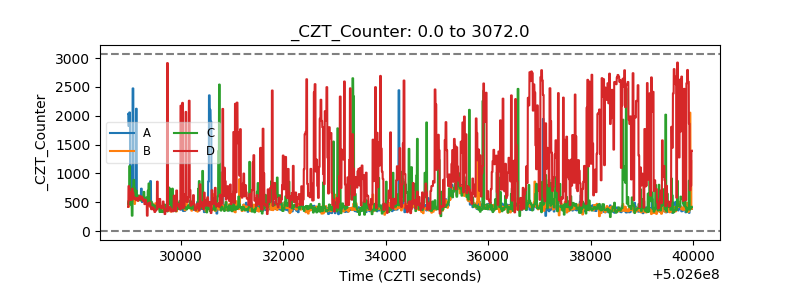 |
| +2.5 Volts monitor |  |
| +5 Volts monitor | 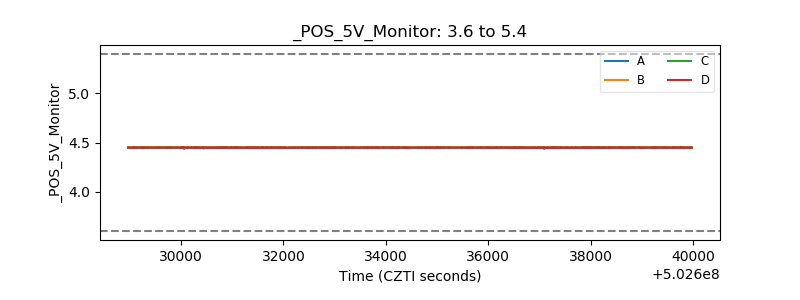 |
| _ROLL_ROT | 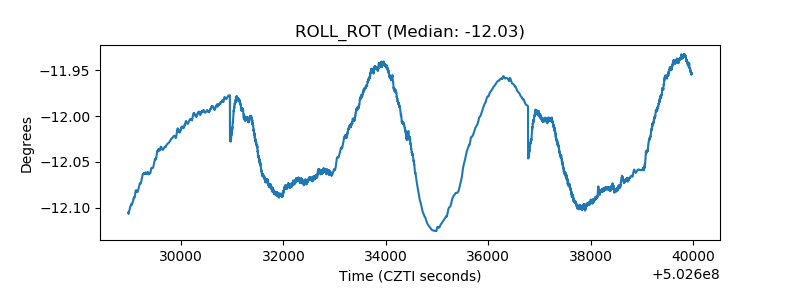 |
| _Roll_DEC | 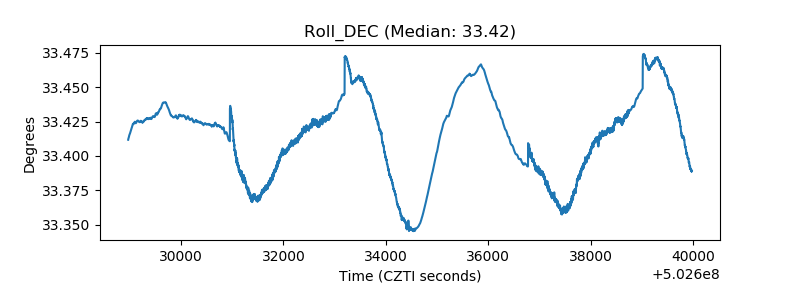 |
| _Roll_RA | 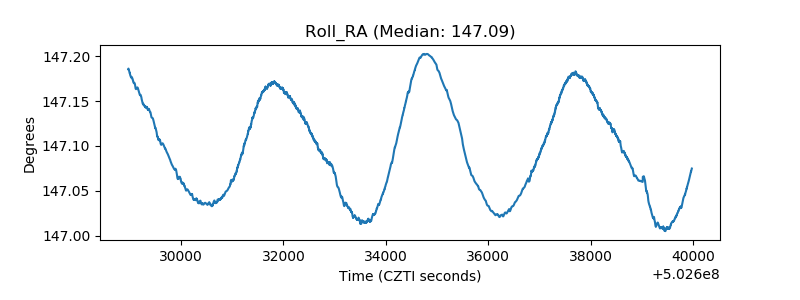 |
| Veto Counter | 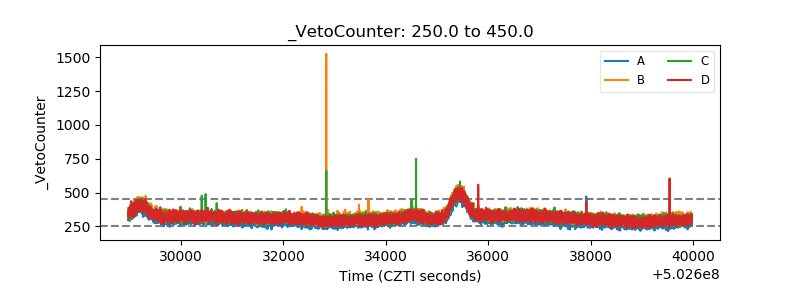 |