| Param | Original file | Final file |
|---|---|---|
| Filename | modeM0/AS1A14_022T16_9000006532_55121cztM0_level2.fits | modeM0/AS1A14_022T16_9000006532_55121cztM0_level2_quad_clean.evt |
| Size (bytes) | 1,067,273,280 | 207,002,880 |
| Size | 1017.8 MB | 197.4 MB |
| Events in quadrant A | 7,159,842 | 1,389,732 |
| Events in quadrant B | 6,664,280 | 1,483,457 |
| Events in quadrant C | 8,839,454 | 1,290,398 |
| Events in quadrant D | 15,669,334 | 1,058,334 |
| Mode SS | |||
|---|---|---|---|
| Quadrant | BADHDUFLAG | Total packets | Discarded packets |
| A | 0 | 308 | 0 |
| B | 0 | 308 | 0 |
| C | 0 | 308 | 0 |
| D | 0 | 308 | 0 |
| Mode M0 | |||
|---|---|---|---|
| Quadrant | BADHDUFLAG | Total packets | Discarded packets |
| A | 0 | 32659 | 19 |
| B | 0 | 31350 | 7 |
| C | 0 | 37244 | 14 |
| D | 0 | 57321 | 24 |
| Mode M9 | |||
|---|---|---|---|
| Quadrant | BADHDUFLAG | Total packets | Discarded packets |
| A | 0 | 16 | 0 |
| B | 0 | 16 | 0 |
| C | 0 | 16 | 0 |
| D | 0 | 16 | 0 |
| Quadrant | Total seconds | Saturated seconds | Saturation percentage |
|---|---|---|---|
| A | 15152 | 260 | 1.715945% |
| B | 15155 | 228 | 1.504454% |
| C | 15151 | 514 | 3.392515% |
| D | 15148 | 2672 | 17.639292% |
Noise dominated data is calculated using 1-second bins in cleaned event files. If a bin has >2000 counts, and if more than 50% of those come from <1% of pixels, then it is considered to be noise-dominated and hence unusable.
| Quadrant | # 1 sec bins | Bins with >0 counts | Bins with >2000 counts | High rate bins dominated by noise | Noise dominated (total time) | Noise dominated (detector-on time) | Marked lightcurve |
|---|---|---|---|---|---|---|---|
| A | 16743 | 15160 | 60 | 60 | 0.36% | 0.40% | 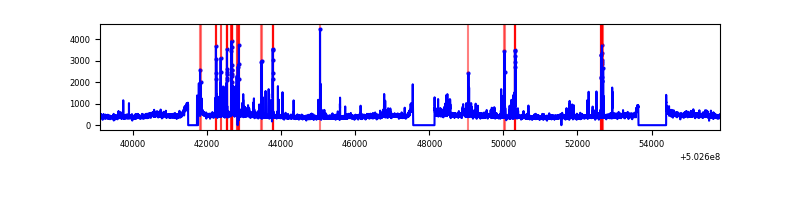 |
| B | 16743 | 15161 | 12 | 12 | 0.07% | 0.08% | 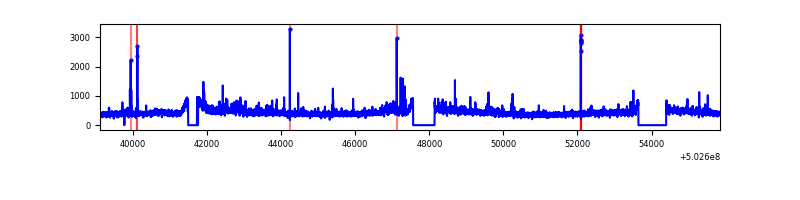 |
| C | 16742 | 15158 | 303 | 303 | 1.81% | 2.00% | 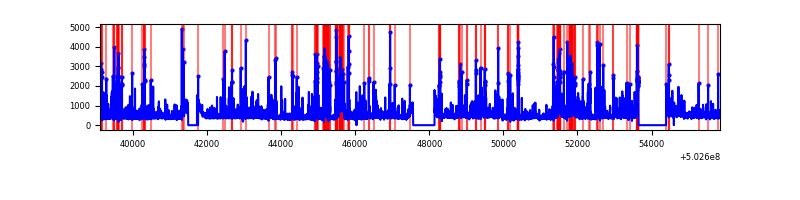 |
| D | 16742 | 15158 | 2327 | 2327 | 13.90% | 15.35% | 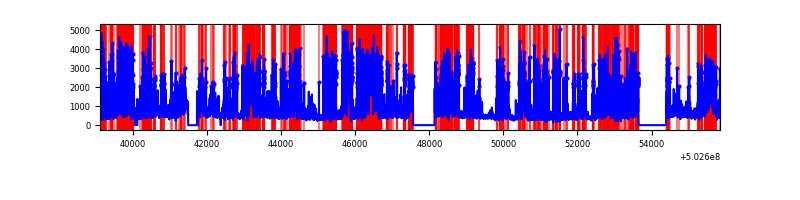 |
Top three noisy pixels from each quadrant. If the there are fewer than three noisy pixels in the level2.evt file, extra rows are filled as -1
| Pixel properties | Quadrant properties | ||||||
|---|---|---|---|---|---|---|---|
| Quadrant | DetID | PixID | Counts | Sigma | Mean | Median | Sigma |
| A | 0 | 8 | 327024 | 821.88 | 1608 | 1568 | 396.0 |
| A | 5 | 241 | 206767 | 518.19 | 1608 | 1568 | 396.0 |
| A | 4 | 78 | 117868 | 293.7 | 1608 | 1568 | 396.0 |
| B | 0 | 63 | 178797 | 520.24 | 1584 | 1523 | 340.8 |
| B | 5 | 185 | 65111 | 186.61 | 1584 | 1523 | 340.8 |
| B | 0 | 182 | 50574 | 143.95 | 1584 | 1523 | 340.8 |
| C | 6 | 223 | 896157 | 2107.38 | 1548 | 1536 | 424.5 |
| C | 13 | 3 | 580506 | 1363.83 | 1548 | 1536 | 424.5 |
| C | 14 | 254 | 417505 | 979.86 | 1548 | 1536 | 424.5 |
| D | 15 | 94 | 6023490 | 14724.29 | 1440 | 1377 | 409.0 |
| D | 11 | 129 | 2736470 | 6687.4 | 1440 | 1377 | 409.0 |
| D | 4 | 221 | 236803 | 575.63 | 1440 | 1377 | 409.0 |
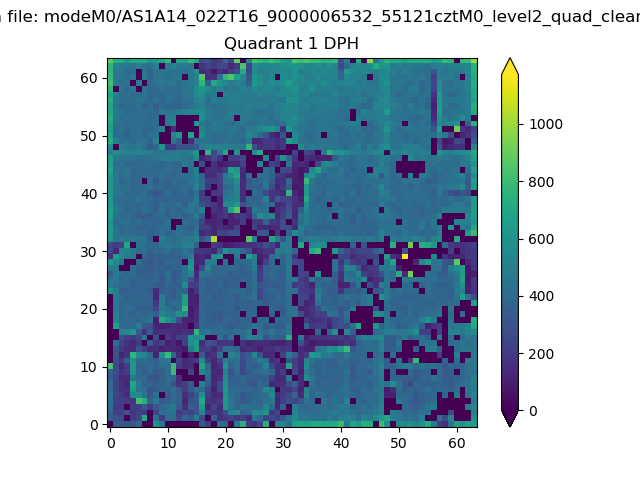
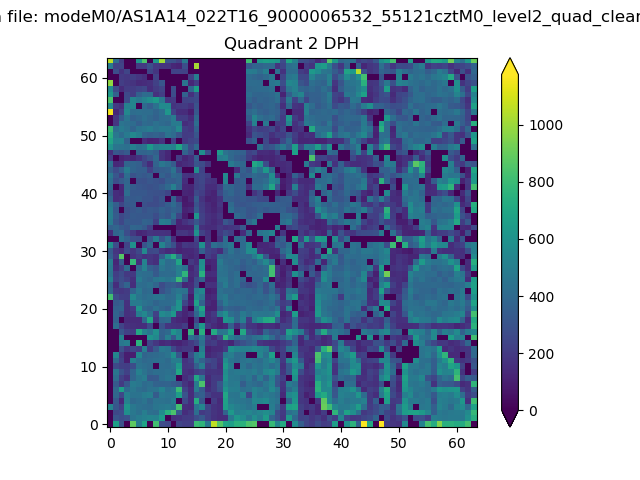
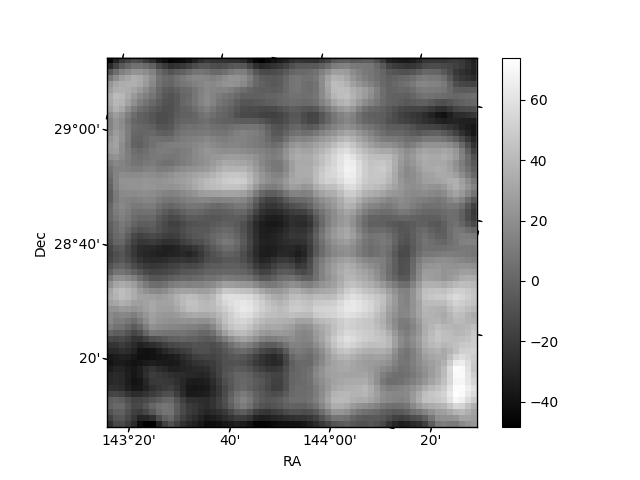
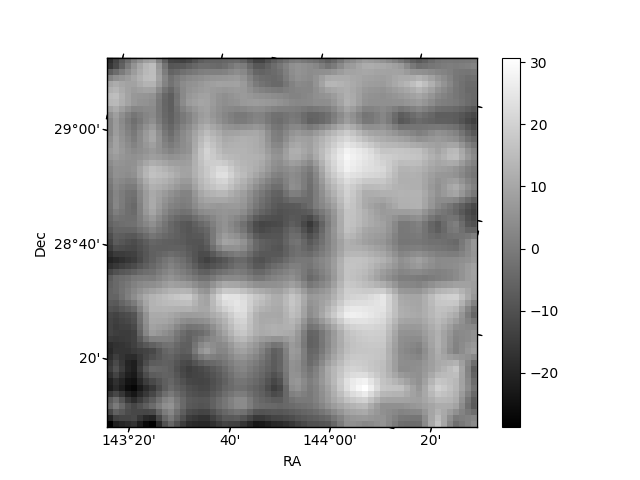
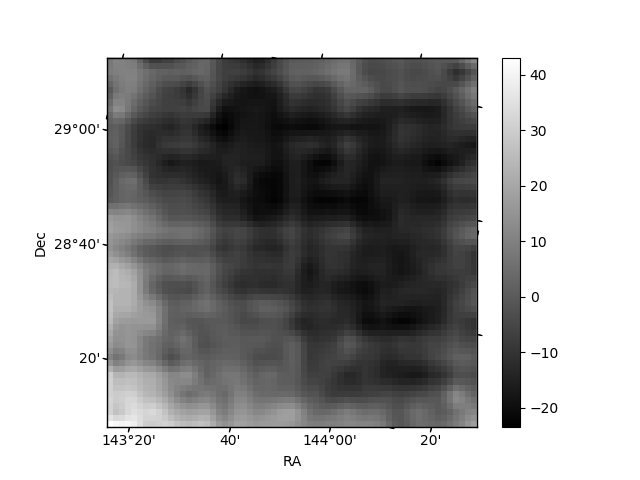
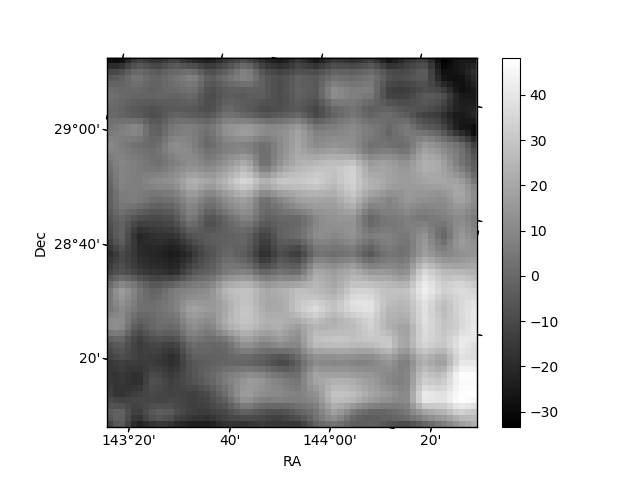
Histogram calculated using DETX and DETY for each event in the final _common_clean file
| Quadrant A |  |
 |
Quadrant B |
|---|---|---|---|
| Quadrant D | 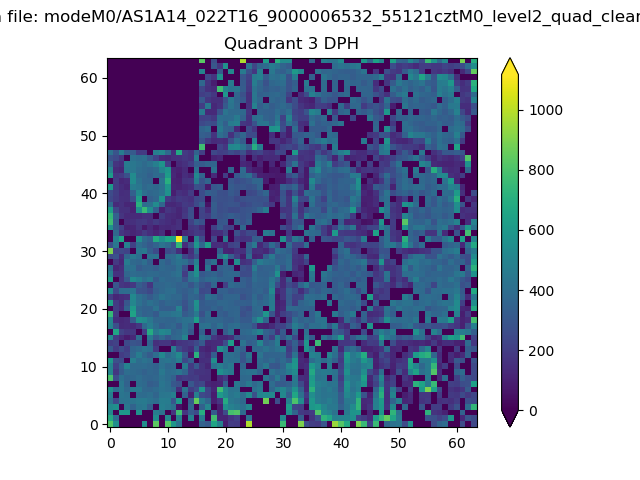 |
 |
Quadrant C |
| Plot type | Count rate plots | Images |
|---|---|---|
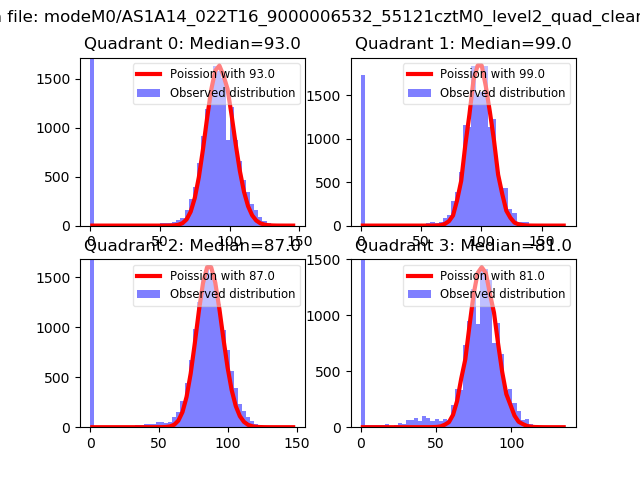
| Comparison with Poisson distribution Blue bars denote a histogram of data divided into 1 sec bins. Red curve is a Poisson curve with rate = median count rate of data. |
 |
 |
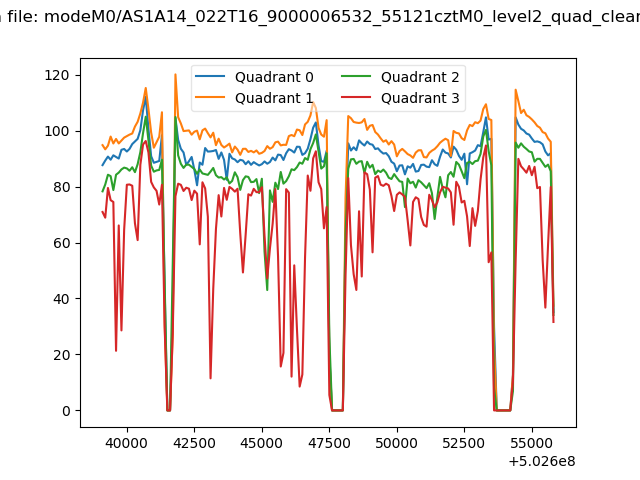
| Quadrant-wise count rates Data is divided into 100 sec bins |
 |
|
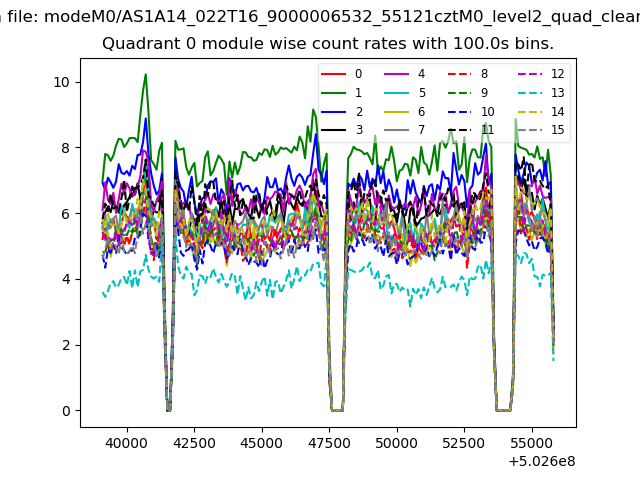
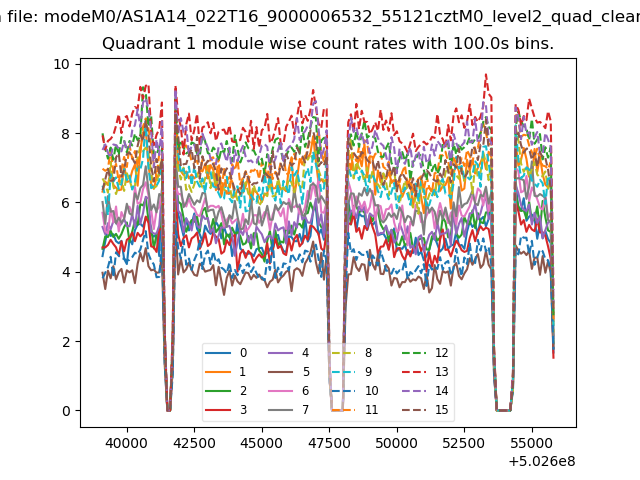
| Module-wise count rates for Quadrant A Data is divided into 100 sec bins |
 |
 |
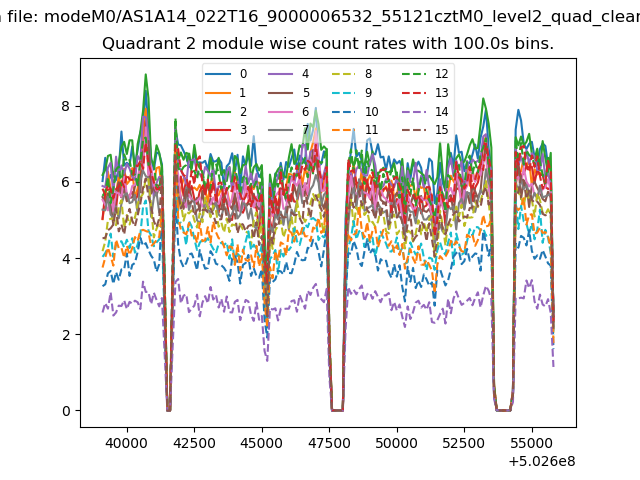
| Module-wise count rates for Quadrant B Data is divided into 100 sec bins |
 |
 |
| Module-wise count rates for Quadrant C Data is divided into 100 sec bins |
 |
 |
| Module-wise count rates for Quadrant D Data is divided into 100 sec bins |
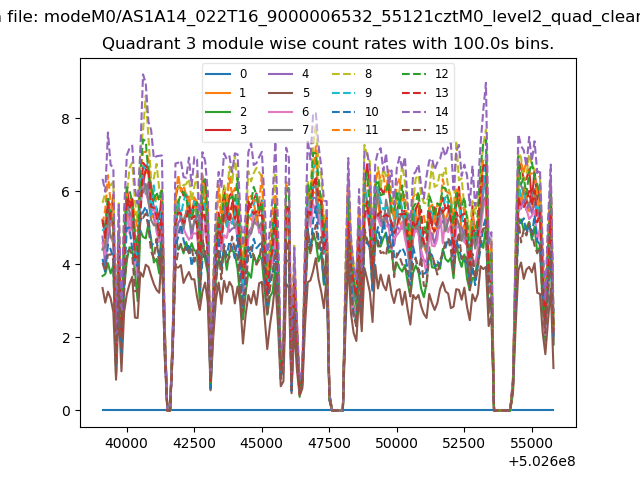 |
 |
| Parameter | Plot |
|---|---|
| CZT HV Monitor | 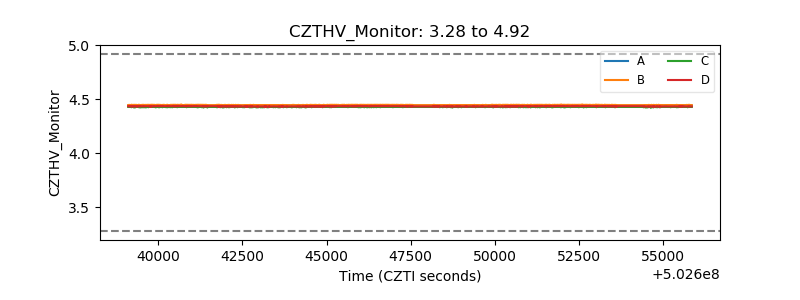 |
| D_VDD | 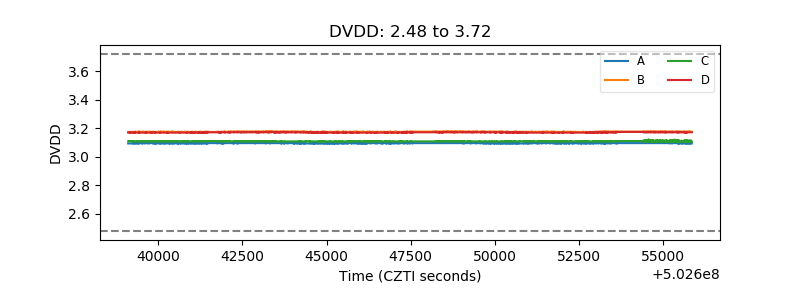 |
| Temperature 1 | 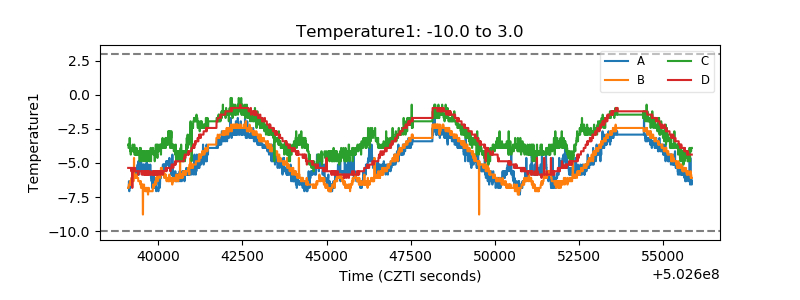 |
| Veto HV Monitor | 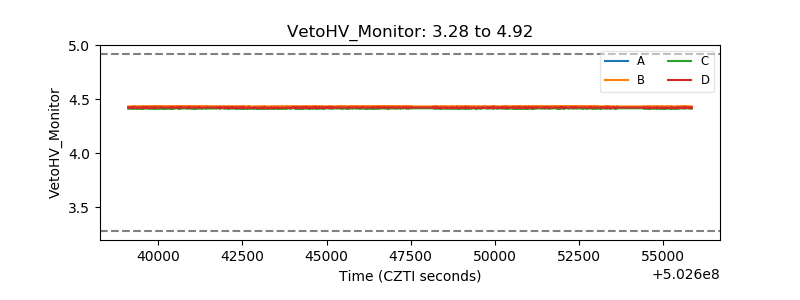 |
| Veto LLD | 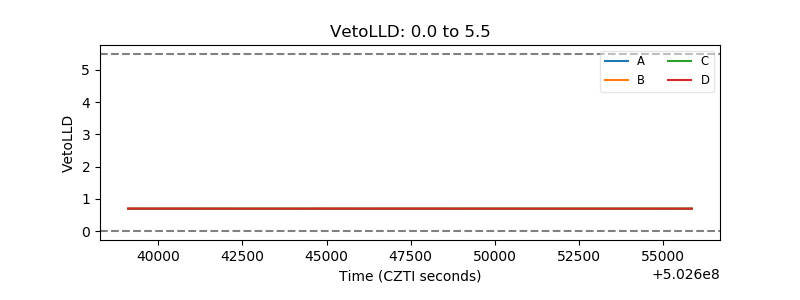 |
| Alpha Counter | 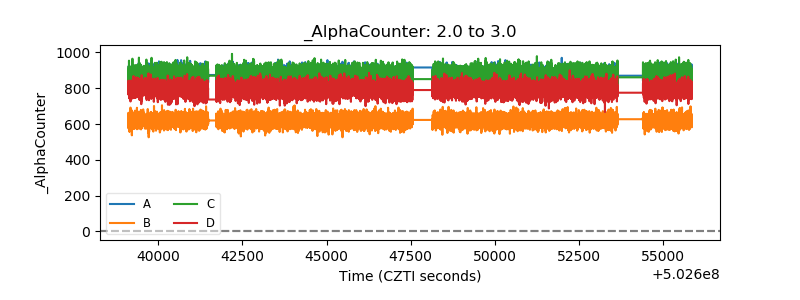 |
| _CPM_Rate | 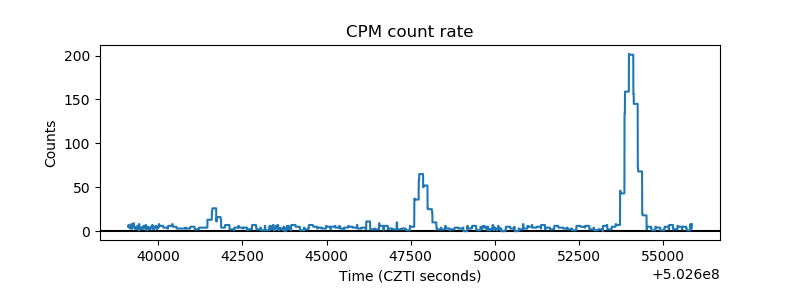 |
| CZT Counter | 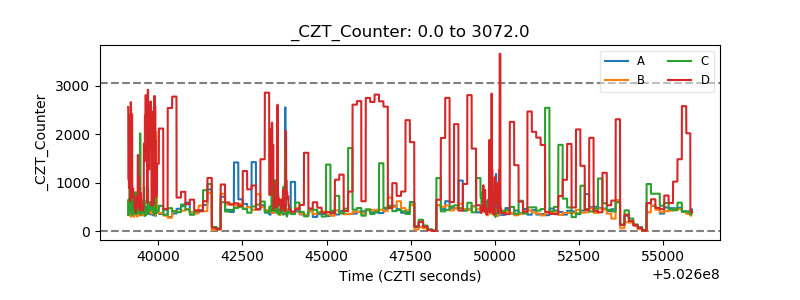 |
| +2.5 Volts monitor |  |
| +5 Volts monitor |  |
| _ROLL_ROT | 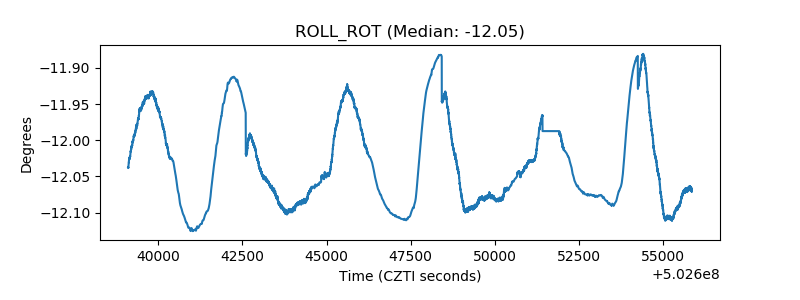 |
| _Roll_DEC | 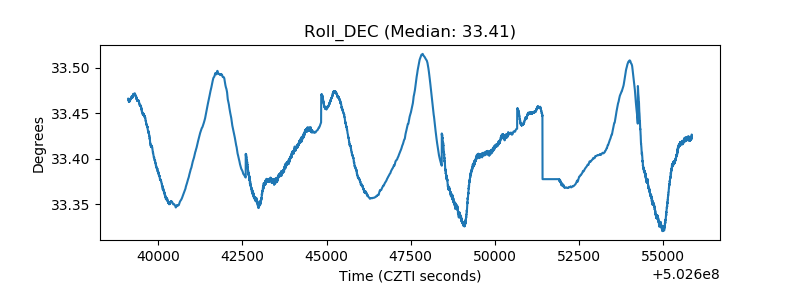 |
| _Roll_RA | 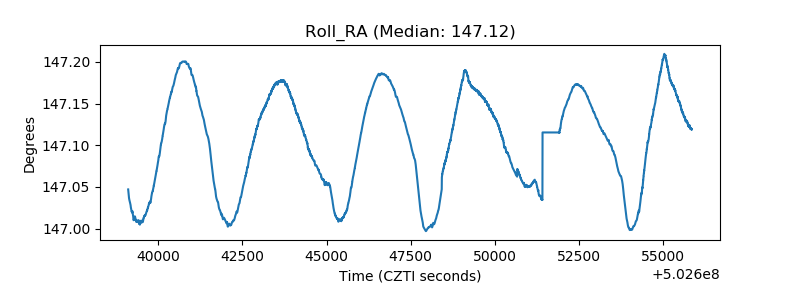 |
| Veto Counter | 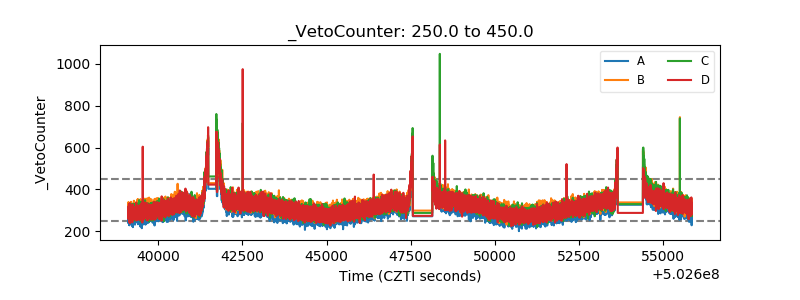 |