| Param | Original file | Final file |
|---|---|---|
| Filename | modeM0/AS1A14_022T16_9000006532_55122cztM0_level2.fits | modeM0/AS1A14_022T16_9000006532_55122cztM0_level2_quad_clean.evt |
| Size (bytes) | 399,476,160 | 90,388,800 |
| Size | 381.0 MB | 86.2 MB |
| Events in quadrant A | 2,780,968 | 595,214 |
| Events in quadrant B | 2,792,524 | 636,766 |
| Events in quadrant C | 3,163,038 | 561,476 |
| Events in quadrant D | 5,555,821 | 499,522 |
| Mode SS | |||
|---|---|---|---|
| Quadrant | BADHDUFLAG | Total packets | Discarded packets |
| A | 0 | 130 | 0 |
| B | 0 | 130 | 0 |
| C | 0 | 130 | 0 |
| D | 0 | 130 | 0 |
| Mode M0 | |||
|---|---|---|---|
| Quadrant | BADHDUFLAG | Total packets | Discarded packets |
| A | 0 | 13122 | 1 |
| B | 0 | 13095 | 1 |
| C | 0 | 14093 | 1 |
| D | 0 | 20944 | 1 |
| Mode M9 | |||
|---|---|---|---|
| Quadrant | BADHDUFLAG | Total packets | Discarded packets |
| A | 0 | 9 | 0 |
| B | 0 | 9 | 0 |
| C | 0 | 9 | 0 |
| D | 0 | 9 | 0 |
| Quadrant | Total seconds | Saturated seconds | Saturation percentage |
|---|---|---|---|
| A | 6360 | 35 | 0.550314% |
| B | 6361 | 49 | 0.770319% |
| C | 6360 | 89 | 1.399371% |
| D | 6360 | 563 | 8.852201% |
Noise dominated data is calculated using 1-second bins in cleaned event files. If a bin has >2000 counts, and if more than 50% of those come from <1% of pixels, then it is considered to be noise-dominated and hence unusable.
| Quadrant | # 1 sec bins | Bins with >0 counts | Bins with >2000 counts | High rate bins dominated by noise | Noise dominated (total time) | Noise dominated (detector-on time) | Marked lightcurve |
|---|---|---|---|---|---|---|---|
| A | 7270 | 6360 | 8 | 8 | 0.11% | 0.13% | 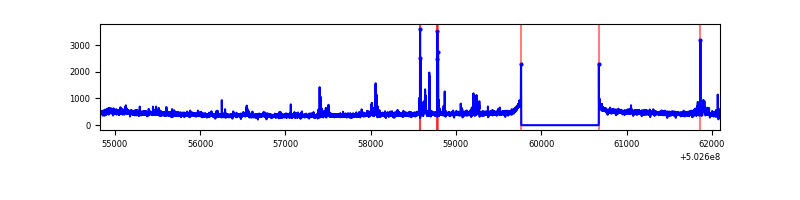 |
| B | 7271 | 6362 | 4 | 4 | 0.06% | 0.06% | 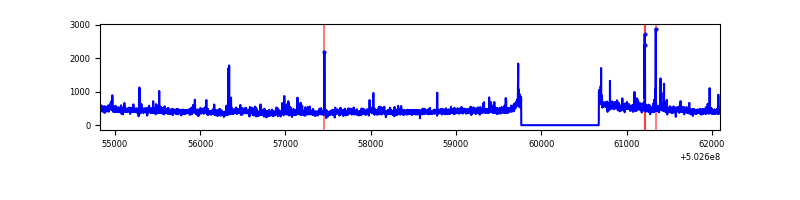 |
| C | 7270 | 6361 | 43 | 43 | 0.59% | 0.68% | 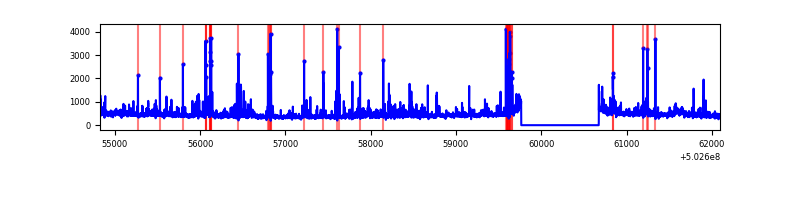 |
| D | 7270 | 6361 | 491 | 491 | 6.75% | 7.72% | 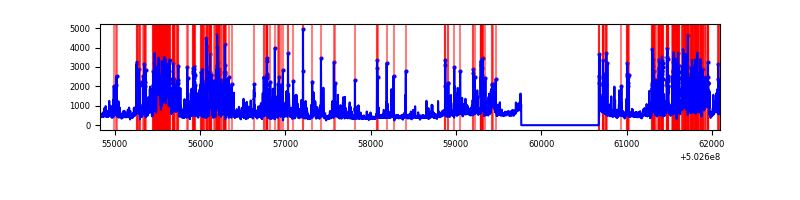 |
Top three noisy pixels from each quadrant. If the there are fewer than three noisy pixels in the level2.evt file, extra rows are filled as -1
| Pixel properties | Quadrant properties | ||||||
|---|---|---|---|---|---|---|---|
| Quadrant | DetID | PixID | Counts | Sigma | Mean | Median | Sigma |
| A | 0 | 8 | 53282 | 317.21 | 664 | 648 | 165.9 |
| A | 12 | 115 | 34689 | 205.15 | 664 | 648 | 165.9 |
| A | 7 | 237 | 26447 | 155.48 | 664 | 648 | 165.9 |
| B | 0 | 63 | 63337 | 442.18 | 658 | 633 | 141.8 |
| B | 5 | 172 | 51233 | 356.82 | 658 | 633 | 141.8 |
| B | 5 | 185 | 27620 | 190.3 | 658 | 633 | 141.8 |
| C | 13 | 3 | 189656 | 1067.71 | 645 | 638 | 177.0 |
| C | 14 | 254 | 127636 | 717.38 | 645 | 638 | 177.0 |
| C | 9 | 38 | 100659 | 564.99 | 645 | 638 | 177.0 |
| D | 11 | 129 | 2244770 | 12744.13 | 621 | 594 | 176.1 |
| D | 3 | 12 | 268087 | 1519.03 | 621 | 594 | 176.1 |
| D | 15 | 94 | 132470 | 748.89 | 621 | 594 | 176.1 |
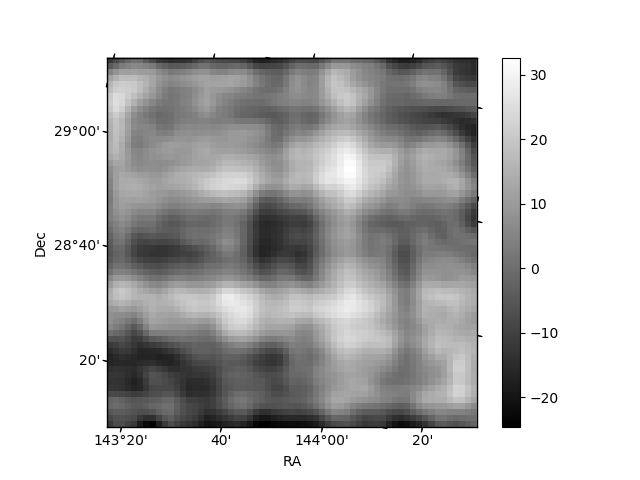
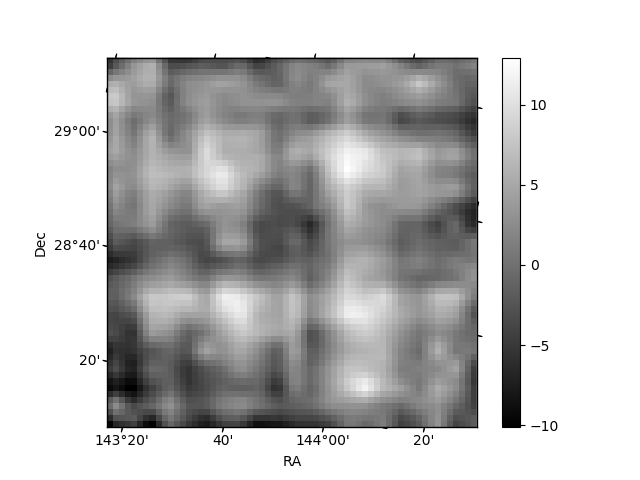
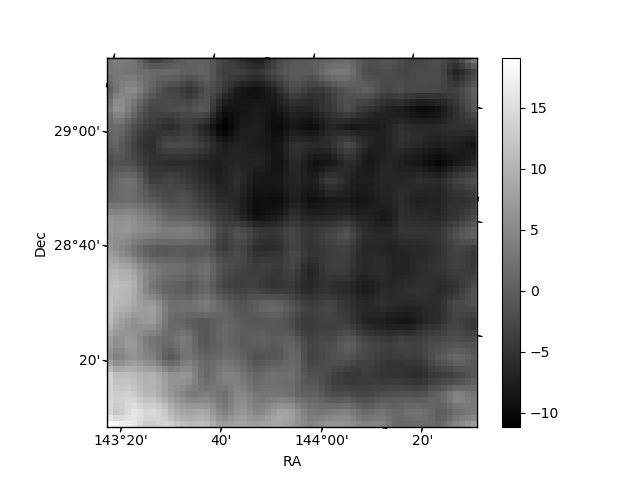
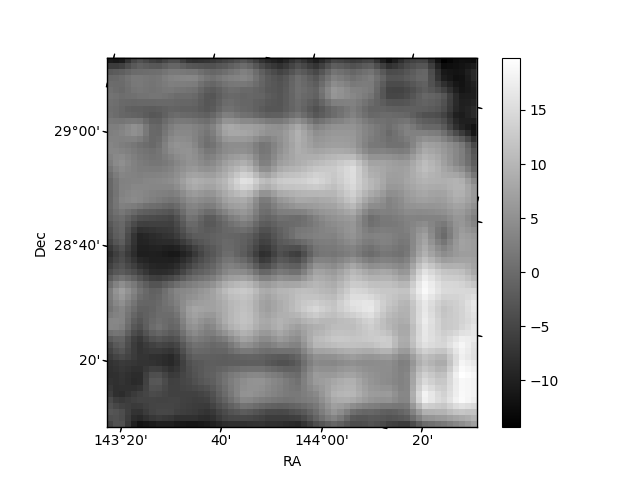
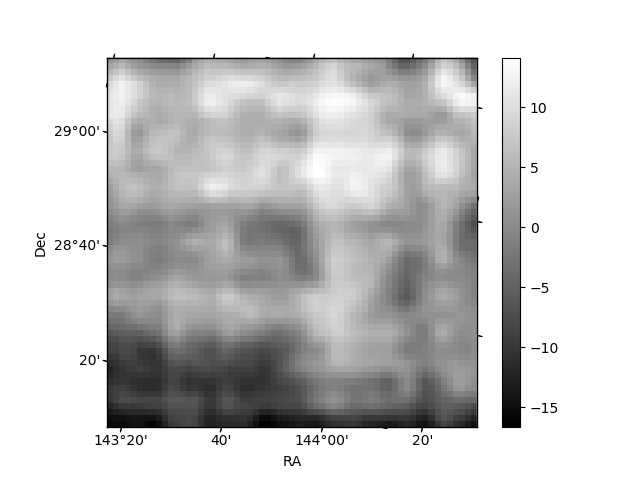
Histogram calculated using DETX and DETY for each event in the final _common_clean file
| Quadrant A | 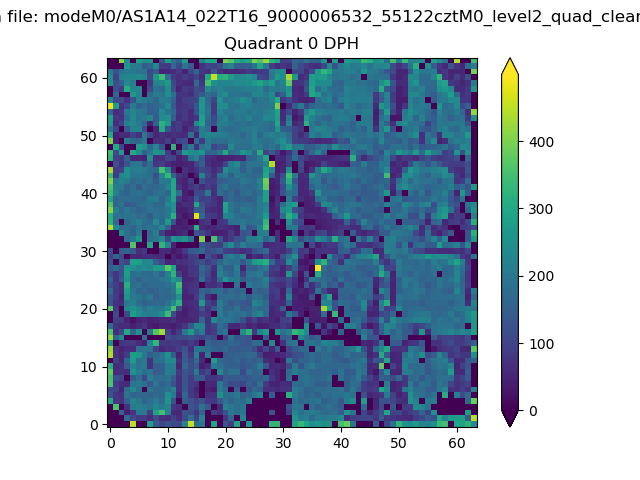 |
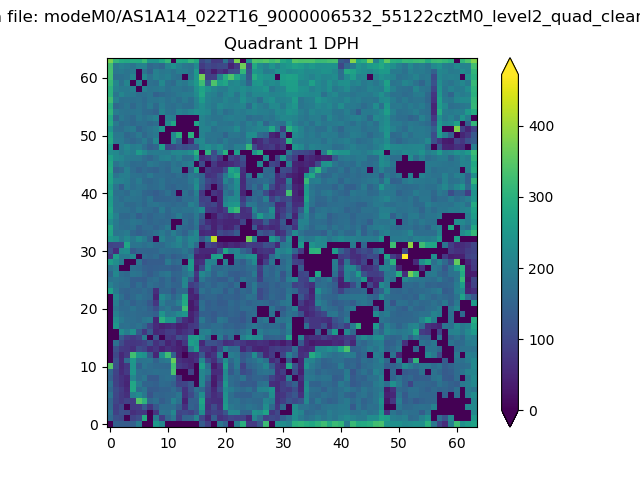 |
Quadrant B |
|---|---|---|---|
| Quadrant D | 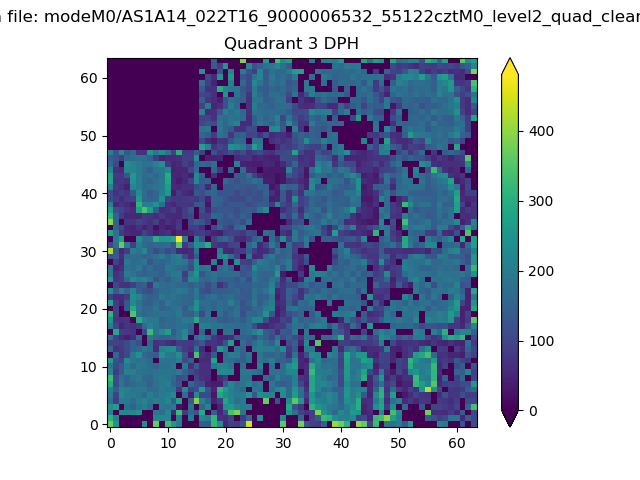 |
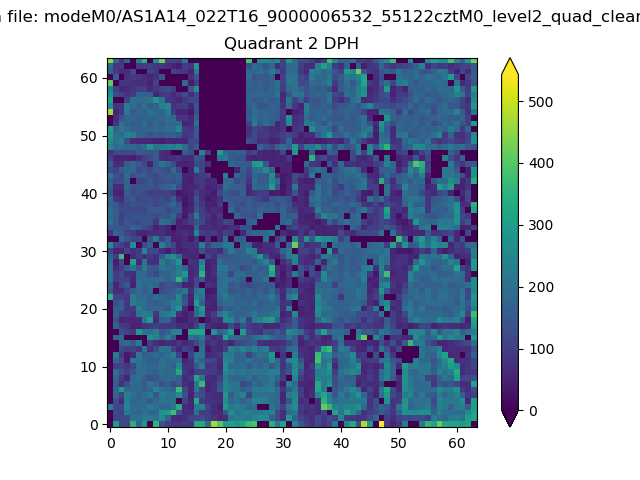 |
Quadrant C |
| Plot type | Count rate plots | Images |
|---|---|---|
| Comparison with Poisson distribution Blue bars denote a histogram of data divided into 1 sec bins. Red curve is a Poisson curve with rate = median count rate of data. |
 |
 |
| Quadrant-wise count rates Data is divided into 100 sec bins |
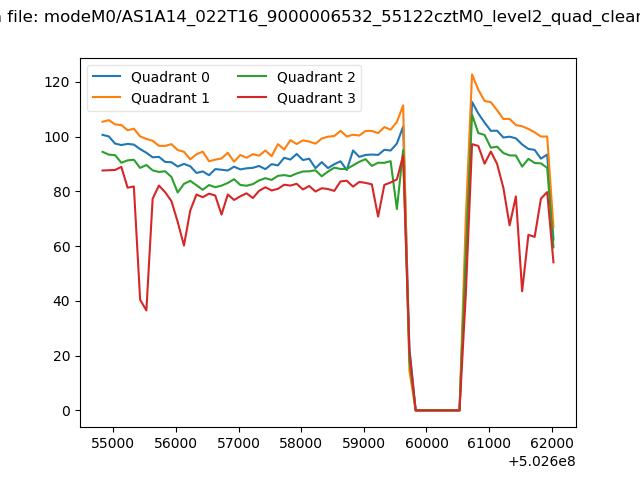 |
|
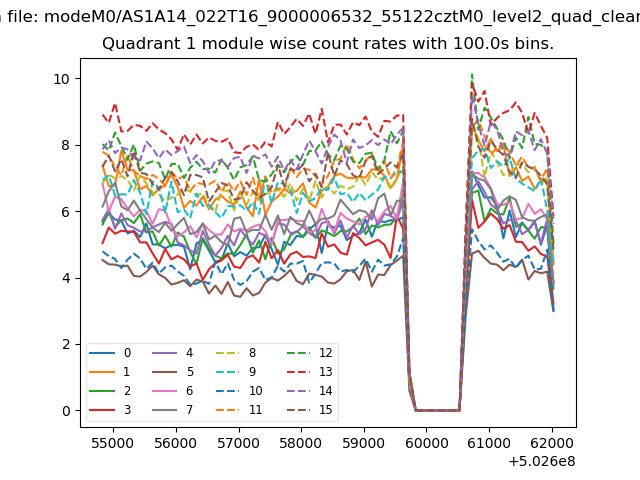
| Module-wise count rates for Quadrant A Data is divided into 100 sec bins |
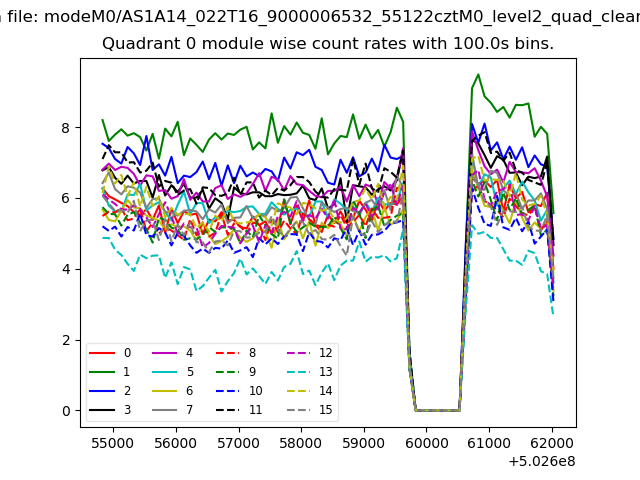 |
 |
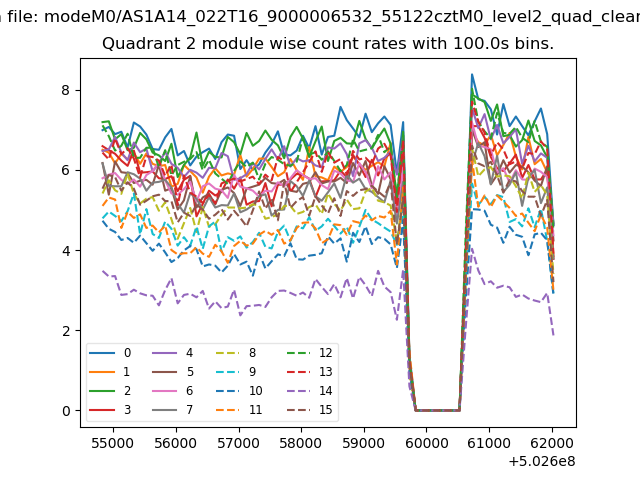
| Module-wise count rates for Quadrant B Data is divided into 100 sec bins |
 |
 |
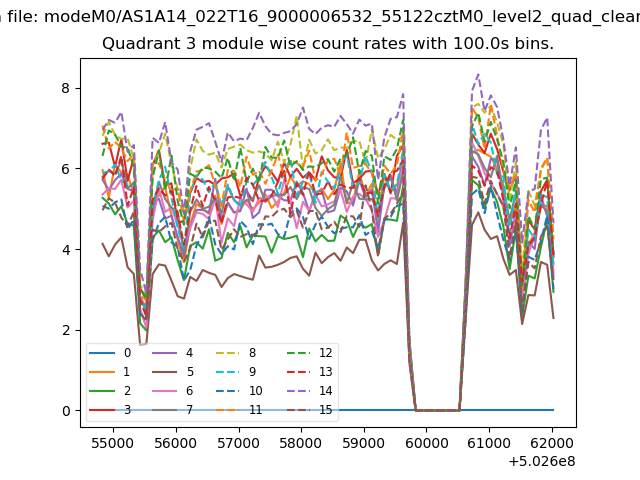
| Module-wise count rates for Quadrant C Data is divided into 100 sec bins |
 |
 |
| Module-wise count rates for Quadrant D Data is divided into 100 sec bins |
 |
 |
| Parameter | Plot |
|---|---|
| CZT HV Monitor | 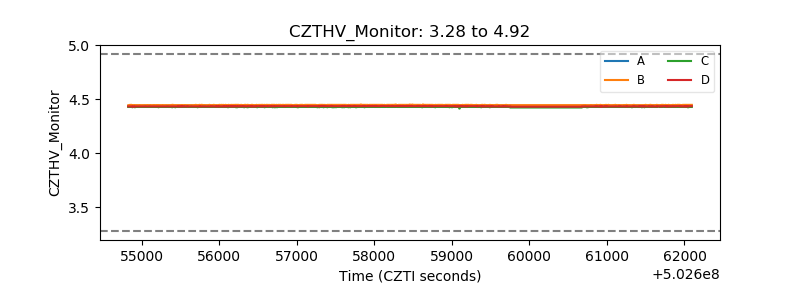 |
| D_VDD | 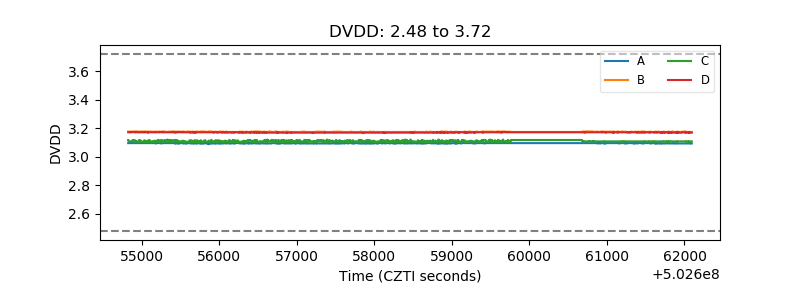 |
| Temperature 1 | 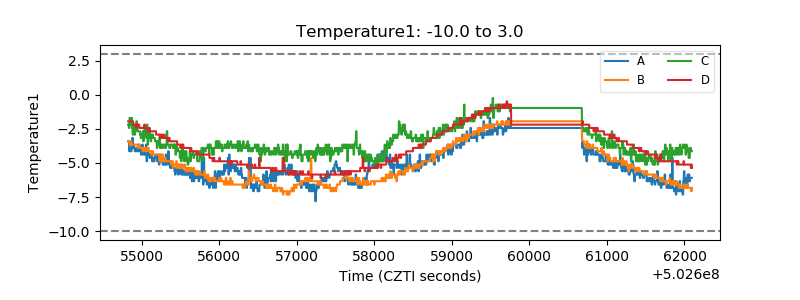 |
| Veto HV Monitor | 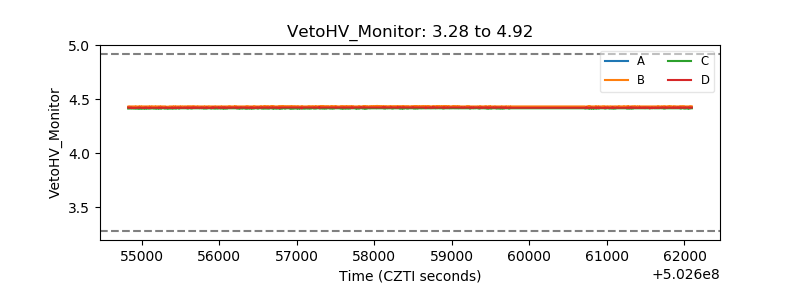 |
| Veto LLD | 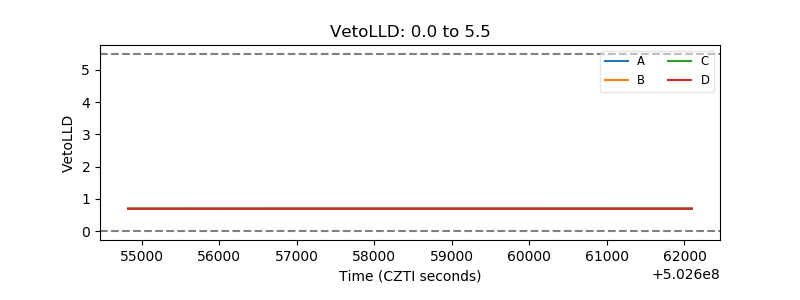 |
| Alpha Counter | 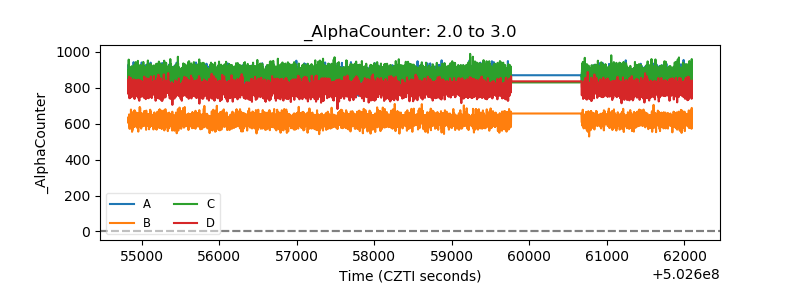 |
| _CPM_Rate | 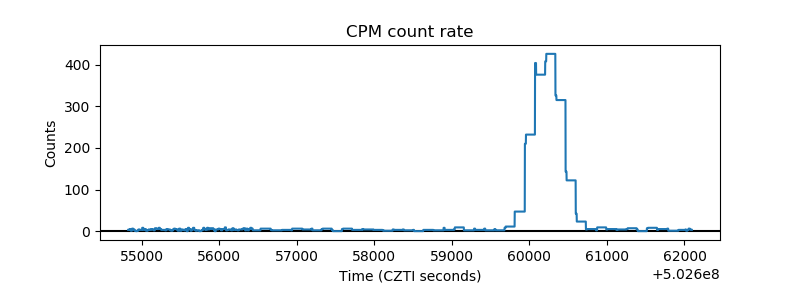 |
| CZT Counter | 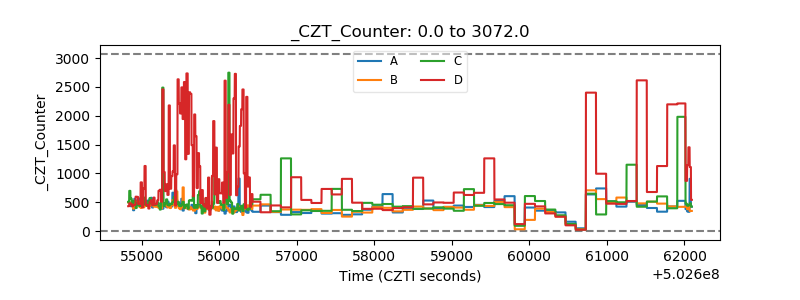 |
| +2.5 Volts monitor |  |
| +5 Volts monitor |  |
| _ROLL_ROT | 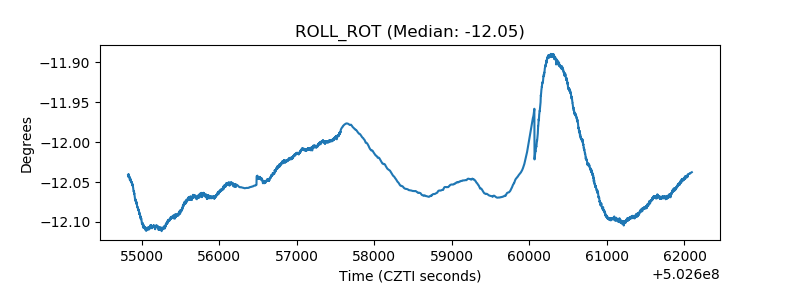 |
| _Roll_DEC |  |
| _Roll_RA | 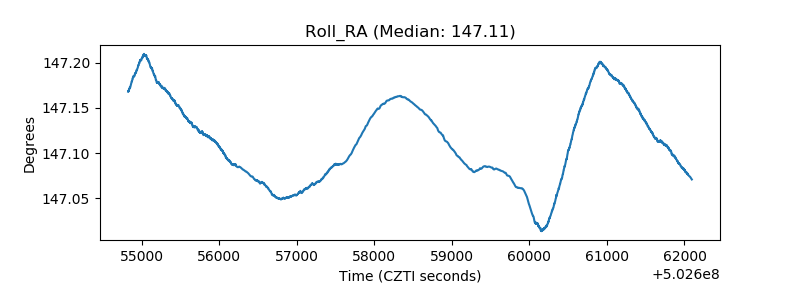 |
| Veto Counter | 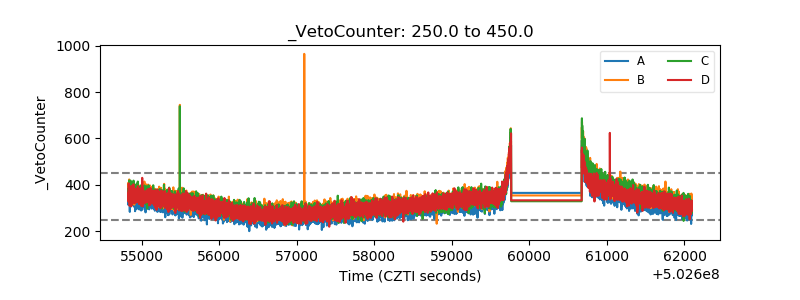 |