| Param | Original file | Final file |
|---|---|---|
| Filename | modeM0/AS1A14_022T16_9000006532_55124cztM0_level2.fits | modeM0/AS1A14_022T16_9000006532_55124cztM0_level2_quad_clean.evt |
| Size (bytes) | 466,240,320 | 96,451,200 |
| Size | 444.6 MB | 92.0 MB |
| Events in quadrant A | 3,020,090 | 655,267 |
| Events in quadrant B | 3,102,391 | 703,464 |
| Events in quadrant C | 3,311,790 | 618,995 |
| Events in quadrant D | 7,292,046 | 465,701 |
| Mode SS | |||
|---|---|---|---|
| Quadrant | BADHDUFLAG | Total packets | Discarded packets |
| A | 0 | 142 | 0 |
| B | 0 | 142 | 0 |
| C | 0 | 142 | 0 |
| D | 0 | 142 | 0 |
| Mode M0 | |||
|---|---|---|---|
| Quadrant | BADHDUFLAG | Total packets | Discarded packets |
| A | 0 | 14193 | 2 |
| B | 0 | 14404 | 2 |
| C | 0 | 14995 | 2 |
| D | 0 | 26614 | 3 |
| Mode M9 | |||
|---|---|---|---|
| Quadrant | BADHDUFLAG | Total packets | Discarded packets |
| A | 0 | 19 | 0 |
| B | 0 | 19 | 0 |
| C | 0 | 19 | 0 |
| D | 0 | 19 | 0 |
| Quadrant | Total seconds | Saturated seconds | Saturation percentage |
|---|---|---|---|
| A | 6840 | 45 | 0.657895% |
| B | 6840 | 85 | 1.242690% |
| C | 6841 | 106 | 1.549481% |
| D | 6840 | 1495 | 21.856725% |
Noise dominated data is calculated using 1-second bins in cleaned event files. If a bin has >2000 counts, and if more than 50% of those come from <1% of pixels, then it is considered to be noise-dominated and hence unusable.
| Quadrant | # 1 sec bins | Bins with >0 counts | Bins with >2000 counts | High rate bins dominated by noise | Noise dominated (total time) | Noise dominated (detector-on time) | Marked lightcurve |
|---|---|---|---|---|---|---|---|
| A | 8800 | 6841 | 3 | 3 | 0.03% | 0.04% | 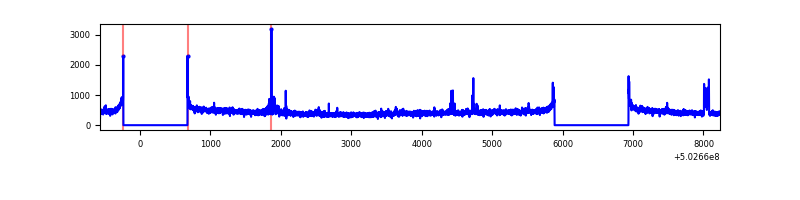 |
| B | 8800 | 6842 | 14 | 14 | 0.16% | 0.20% | 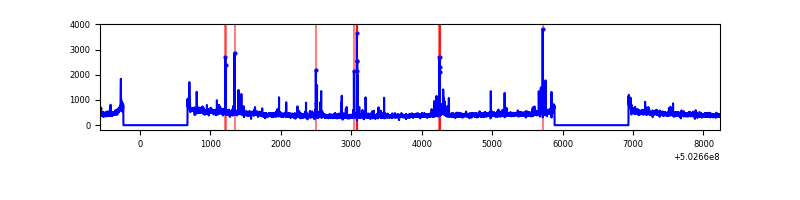 |
| C | 8801 | 6843 | 41 | 41 | 0.47% | 0.60% | 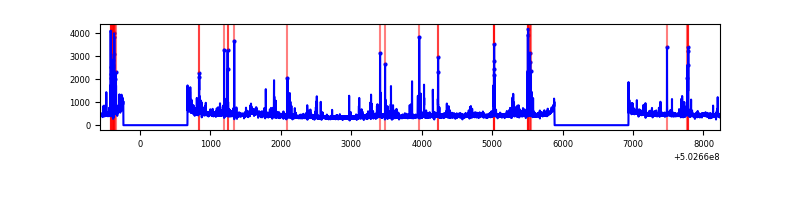 |
| D | 8800 | 6841 | 1248 | 1248 | 14.18% | 18.24% | 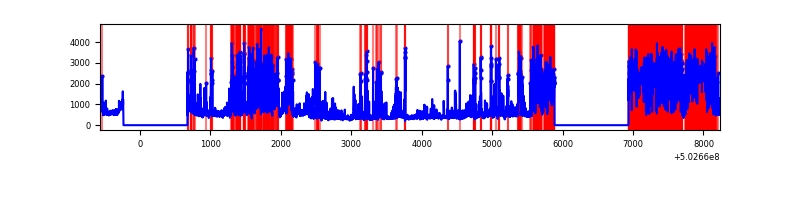 |
Top three noisy pixels from each quadrant. If the there are fewer than three noisy pixels in the level2.evt file, extra rows are filled as -1
| Pixel properties | Quadrant properties | ||||||
|---|---|---|---|---|---|---|---|
| Quadrant | DetID | PixID | Counts | Sigma | Mean | Median | Sigma |
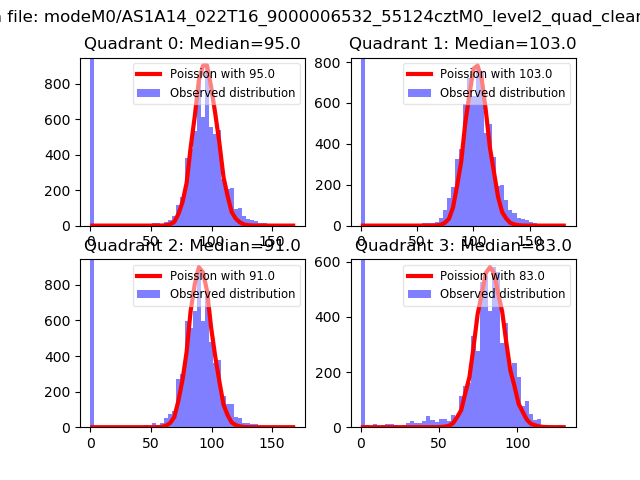
| A | 12 | 115 | 74627 | 405.48 | 732 | 712 | 182.3 |
| A | 7 | 190 | 20220 | 107.02 | 732 | 712 | 182.3 |
| A | 4 | 3 | 19776 | 104.58 | 732 | 712 | 182.3 |
| B | 5 | 185 | 108006 | 681.38 | 726 | 699 | 157.5 |
| B | 0 | 63 | 36234 | 225.64 | 726 | 699 | 157.5 |
| B | 10 | 247 | 25169 | 155.38 | 726 | 699 | 157.5 |
| C | 13 | 3 | 140095 | 707.04 | 713 | 707 | 197.1 |
| C | 14 | 254 | 122203 | 616.29 | 713 | 707 | 197.1 |
| C | 6 | 223 | 75410 | 378.93 | 713 | 707 | 197.1 |
| D | 11 | 129 | 4152389 | 23355.99 | 624 | 598 | 177.8 |
| D | 3 | 12 | 182144 | 1021.29 | 624 | 598 | 177.8 |
| D | 2 | 252 | 115087 | 644.06 | 624 | 598 | 177.8 |
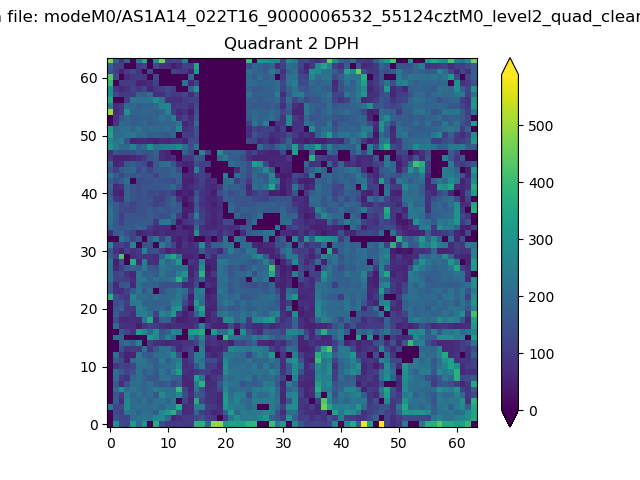
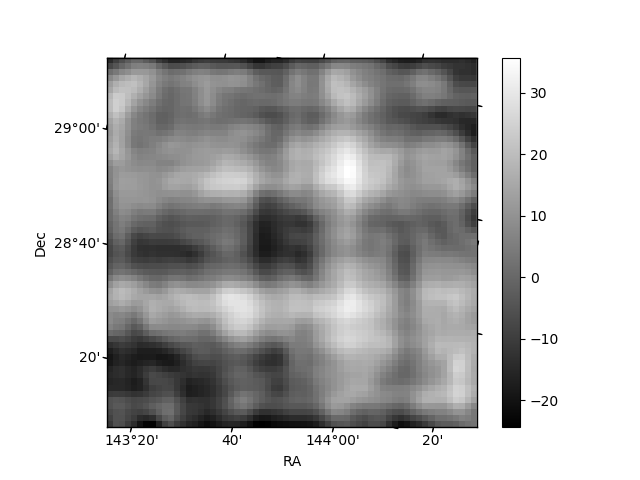
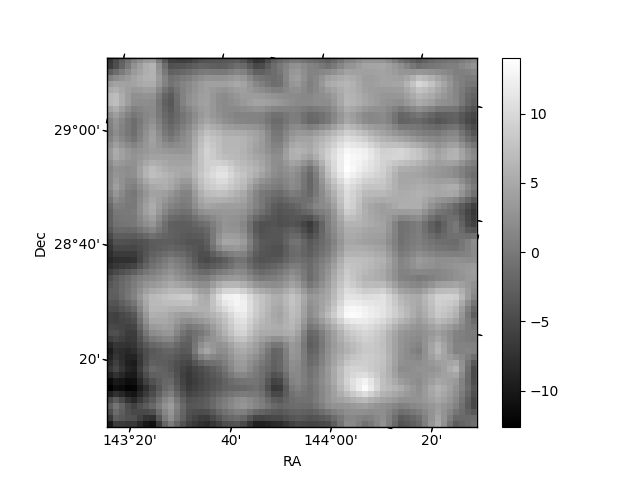
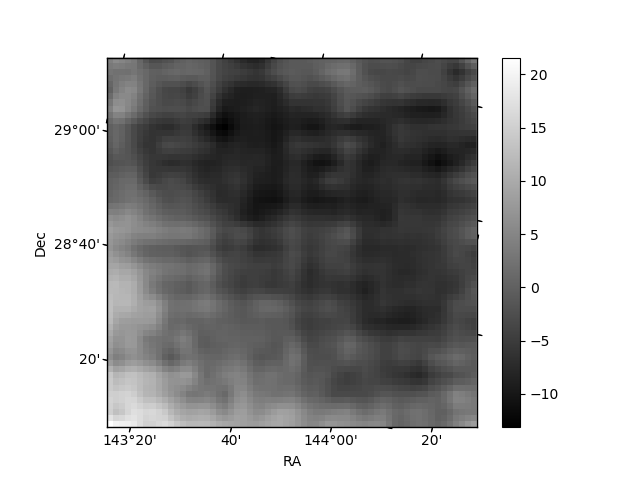
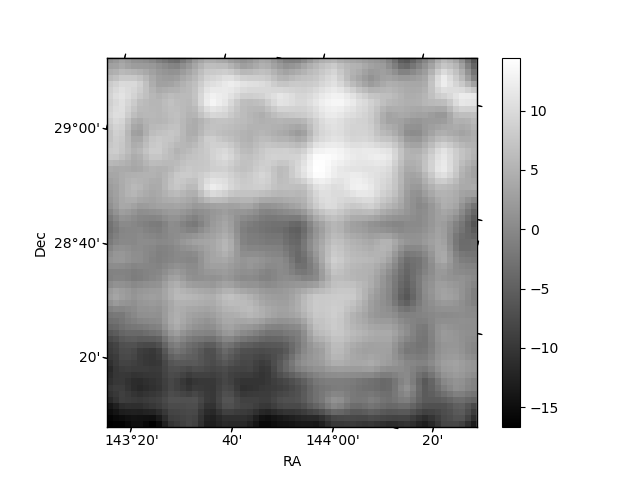
Histogram calculated using DETX and DETY for each event in the final _common_clean file
| Quadrant A | 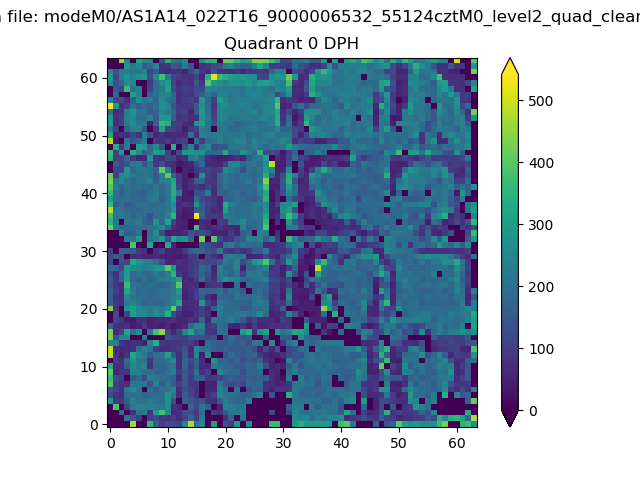 |
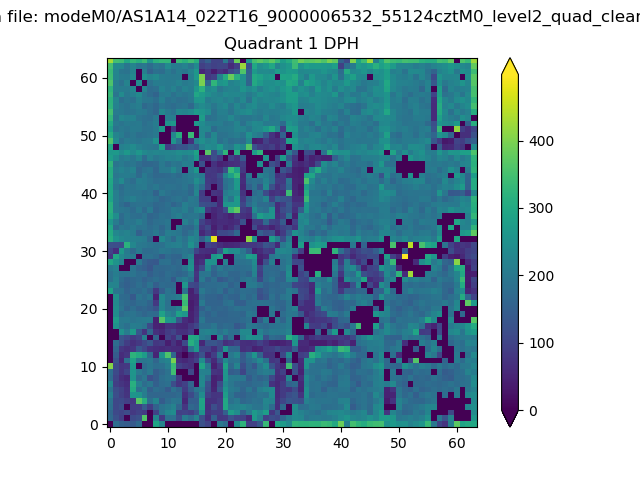 |
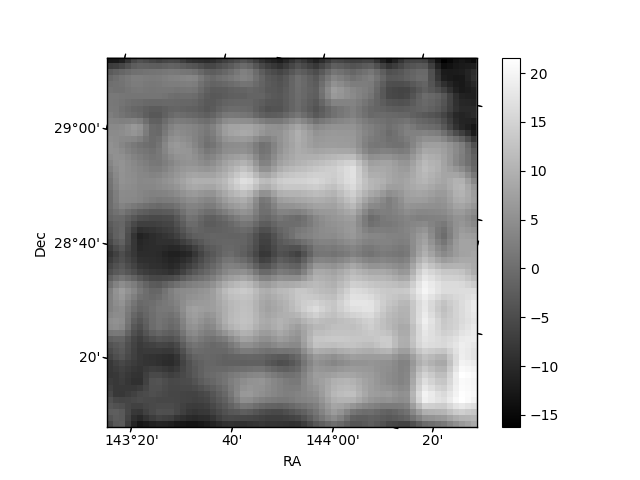
Quadrant B |
|---|---|---|---|
| Quadrant D | 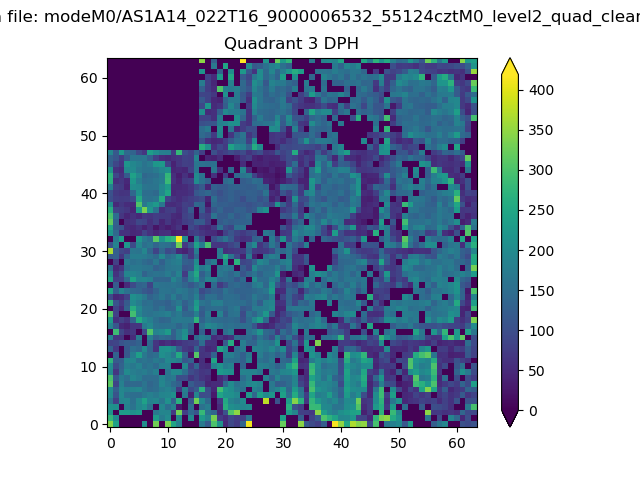 |
 |
Quadrant C |
| Plot type | Count rate plots | Images |
|---|---|---|
| Comparison with Poisson distribution Blue bars denote a histogram of data divided into 1 sec bins. Red curve is a Poisson curve with rate = median count rate of data. |
 |
 |
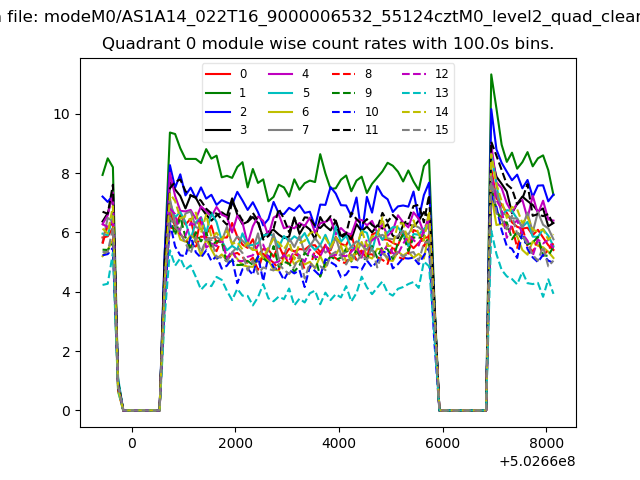
| Quadrant-wise count rates Data is divided into 100 sec bins |
 |
|
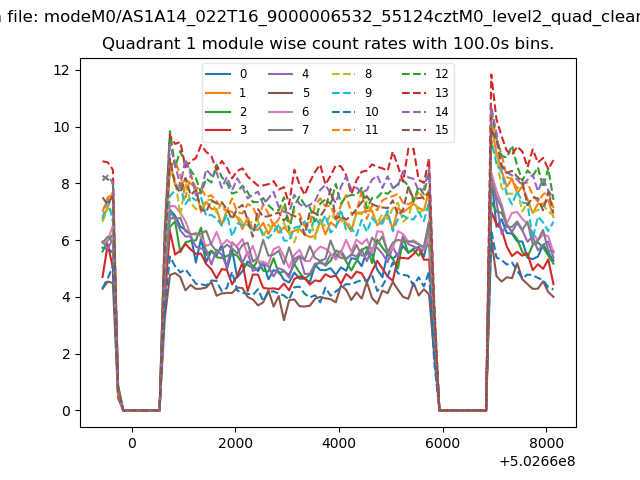
| Module-wise count rates for Quadrant A Data is divided into 100 sec bins |
 |
 |
| Module-wise count rates for Quadrant B Data is divided into 100 sec bins |
 |
 |
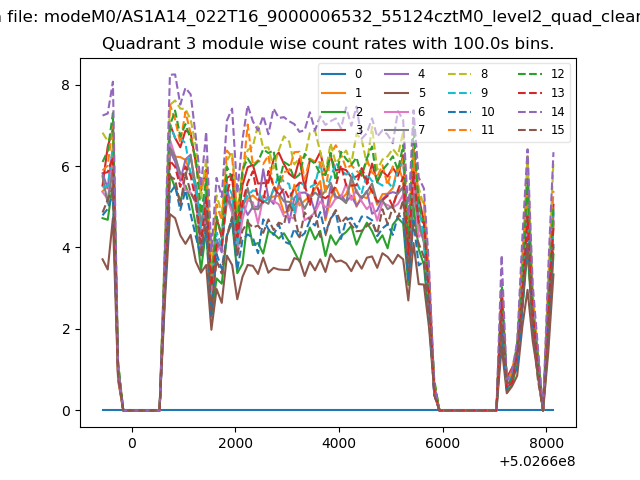
| Module-wise count rates for Quadrant C Data is divided into 100 sec bins |
 |
 |
| Module-wise count rates for Quadrant D Data is divided into 100 sec bins |
 |
 |
| Parameter | Plot |
|---|---|
| CZT HV Monitor | 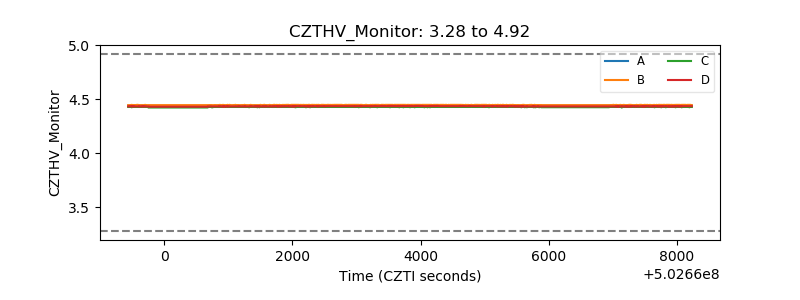 |
| D_VDD | 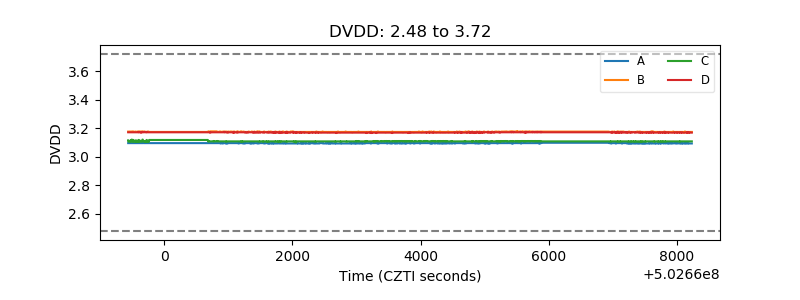 |
| Temperature 1 | 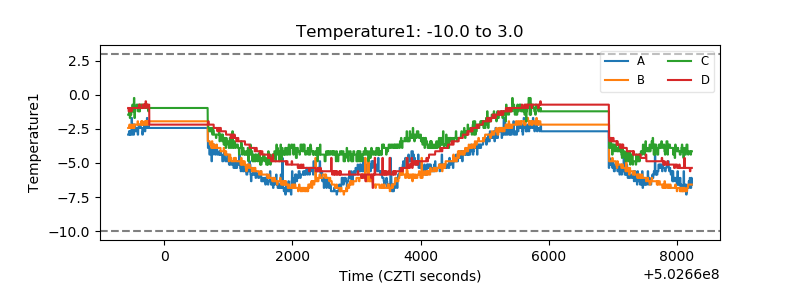 |
| Veto HV Monitor | 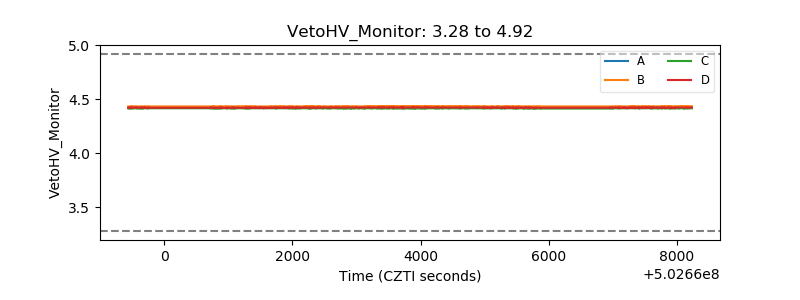 |
| Veto LLD | 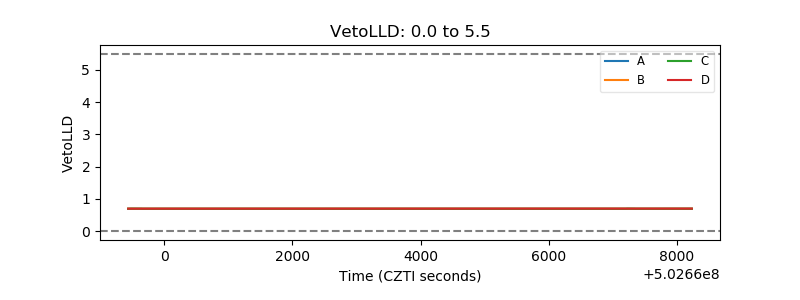 |
| Alpha Counter | 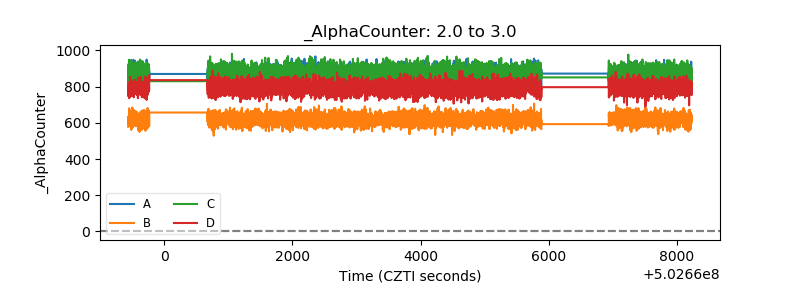 |
| _CPM_Rate | 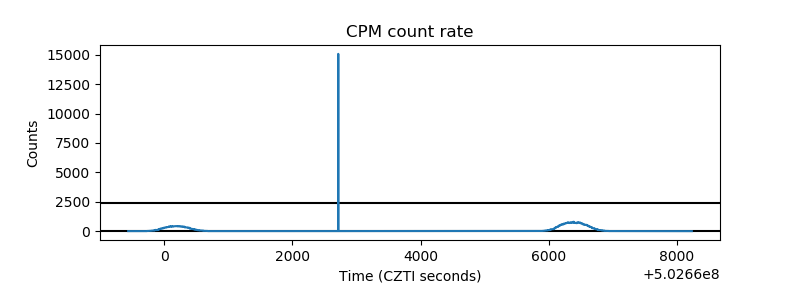 |
| CZT Counter | 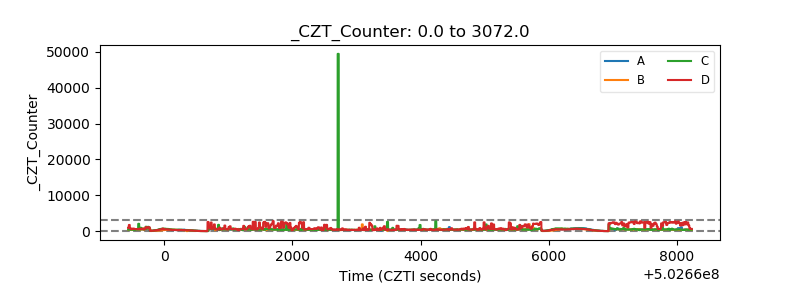 |
| +2.5 Volts monitor |  |
| +5 Volts monitor |  |
| _ROLL_ROT | 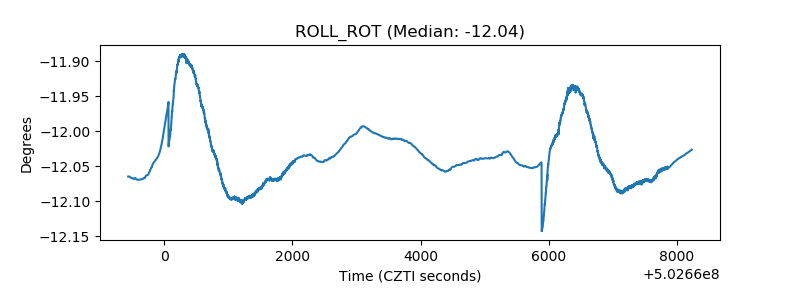 |
| _Roll_DEC | 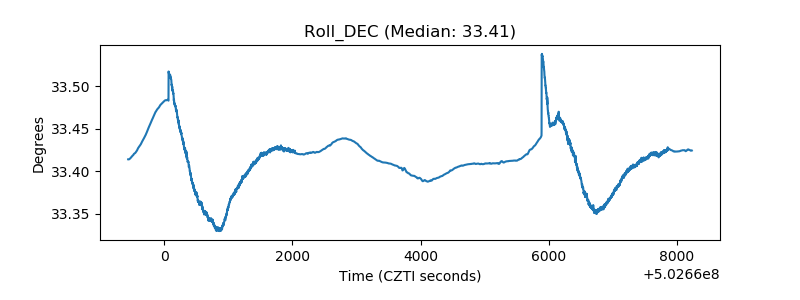 |
| _Roll_RA | 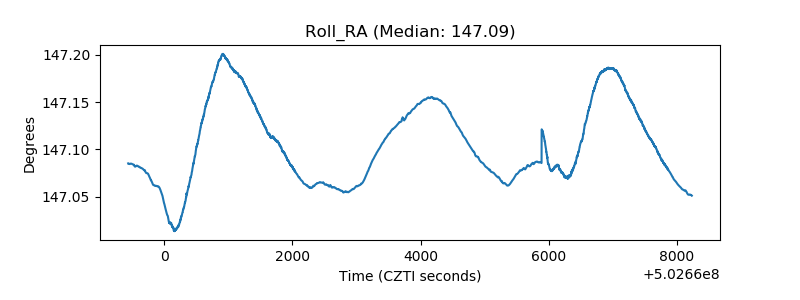 |
| Veto Counter | 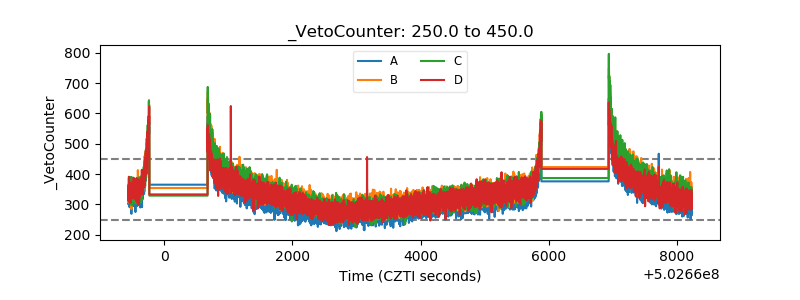 |