| Param | Original file | Final file |
|---|---|---|
| Filename | modeM0/AS1A14_022T16_9000006532_55126cztM0_level2.fits | modeM0/AS1A14_022T16_9000006532_55126cztM0_level2_quad_clean.evt |
| Size (bytes) | 572,670,720 | 96,471,360 |
| Size | 546.1 MB | 92.0 MB |
| Events in quadrant A | 3,717,388 | 660,617 |
| Events in quadrant B | 3,022,011 | 724,726 |
| Events in quadrant C | 3,442,098 | 635,546 |
| Events in quadrant D | 10,488,663 | 425,642 |
| Mode SS | |||
|---|---|---|---|
| Quadrant | BADHDUFLAG | Total packets | Discarded packets |
| A | 0 | 140 | 0 |
| B | 0 | 140 | 0 |
| C | 0 | 140 | 0 |
| D | 0 | 140 | 0 |
| Mode M0 | |||
|---|---|---|---|
| Quadrant | BADHDUFLAG | Total packets | Discarded packets |
| A | 0 | 16267 | 2 |
| B | 0 | 14127 | 2 |
| C | 0 | 15412 | 2 |
| D | 0 | 35925 | 2 |
| Mode M9 | |||
|---|---|---|---|
| Quadrant | BADHDUFLAG | Total packets | Discarded packets |
| A | 0 | 17 | 0 |
| B | 0 | 17 | 0 |
| C | 0 | 18 | 0 |
| D | 0 | 18 | 0 |
| Quadrant | Total seconds | Saturated seconds | Saturation percentage |
|---|---|---|---|
| A | 6802 | 190 | 2.793296% |
| B | 6802 | 52 | 0.764481% |
| C | 6802 | 79 | 1.161423% |
| D | 6802 | 2221 | 32.652161% |
Noise dominated data is calculated using 1-second bins in cleaned event files. If a bin has >2000 counts, and if more than 50% of those come from <1% of pixels, then it is considered to be noise-dominated and hence unusable.
| Quadrant | # 1 sec bins | Bins with >0 counts | Bins with >2000 counts | High rate bins dominated by noise | Noise dominated (total time) | Noise dominated (detector-on time) | Marked lightcurve |
|---|---|---|---|---|---|---|---|
| A | 7962 | 6803 | 116 | 116 | 1.46% | 1.71% | 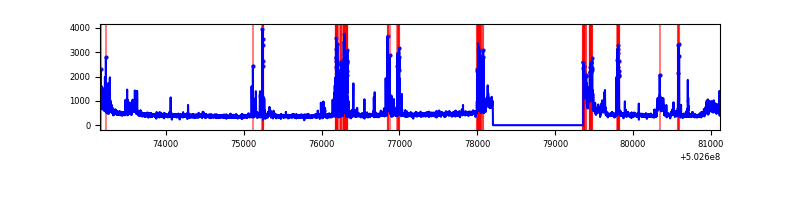 |
| B | 7962 | 6803 | 14 | 14 | 0.18% | 0.21% |  |
| C | 7962 | 6803 | 70 | 70 | 0.88% | 1.03% | 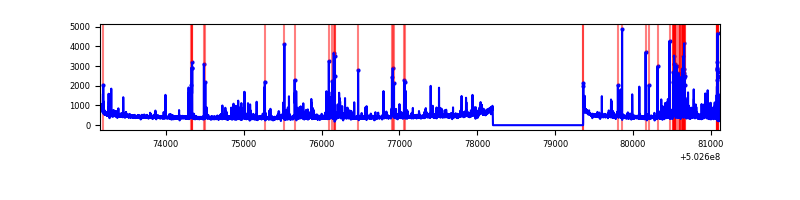 |
| D | 7962 | 6803 | 2244 | 2244 | 28.18% | 32.99% | 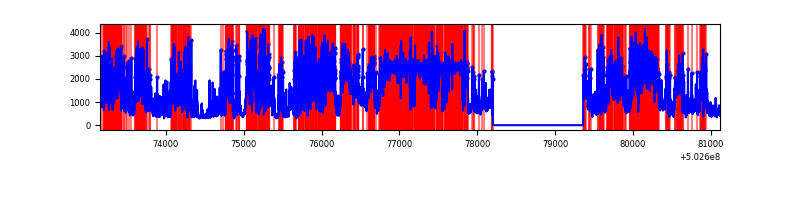 |
Top three noisy pixels from each quadrant. If the there are fewer than three noisy pixels in the level2.evt file, extra rows are filled as -1
| Pixel properties | Quadrant properties | ||||||
|---|---|---|---|---|---|---|---|
| Quadrant | DetID | PixID | Counts | Sigma | Mean | Median | Sigma |
| A | 0 | 8 | 475383 | 2680.12 | 716 | 698 | 177.1 |
| A | 12 | 115 | 309715 | 1744.74 | 716 | 698 | 177.1 |
| A | 5 | 241 | 134743 | 756.83 | 716 | 698 | 177.1 |
| B | 0 | 63 | 60216 | 388.99 | 718 | 693 | 153.0 |
| B | 5 | 172 | 58408 | 377.18 | 718 | 693 | 153.0 |
| B | 12 | 111 | 18424 | 115.88 | 718 | 693 | 153.0 |
| C | 13 | 3 | 396676 | 2045.62 | 701 | 695 | 193.6 |
| C | 12 | 252 | 85257 | 436.84 | 701 | 695 | 193.6 |
| C | 15 | 178 | 82241 | 421.26 | 701 | 695 | 193.6 |
| D | 11 | 129 | 7730676 | 46220.14 | 586 | 562 | 167.2 |
| D | 2 | 249 | 58587 | 346.94 | 586 | 562 | 167.2 |
| D | 2 | 31 | 54014 | 319.6 | 586 | 562 | 167.2 |
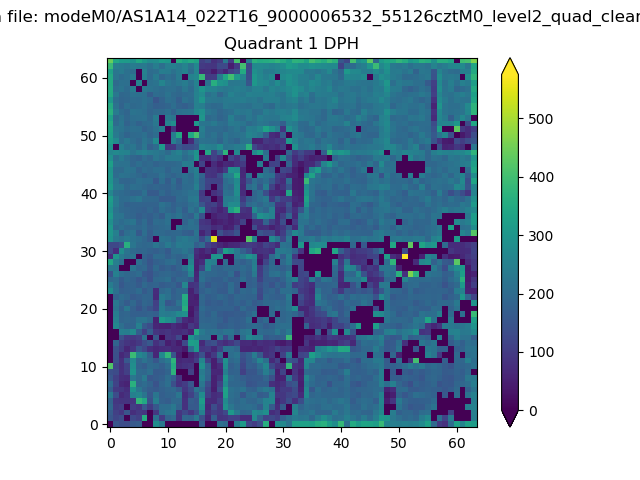
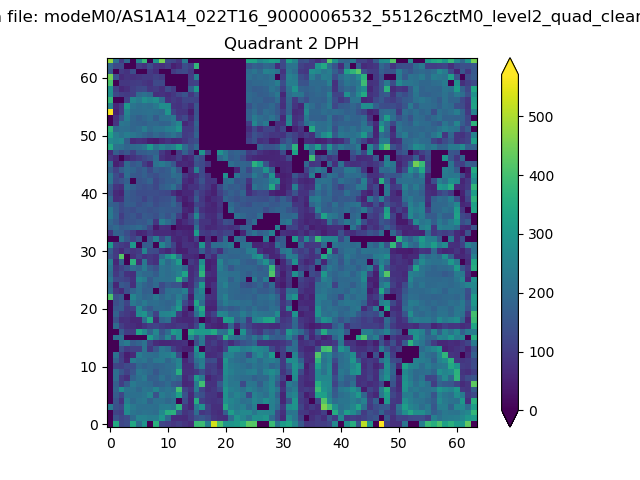
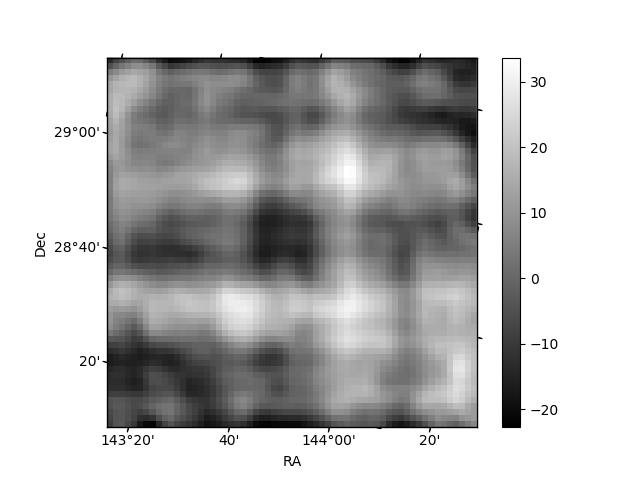
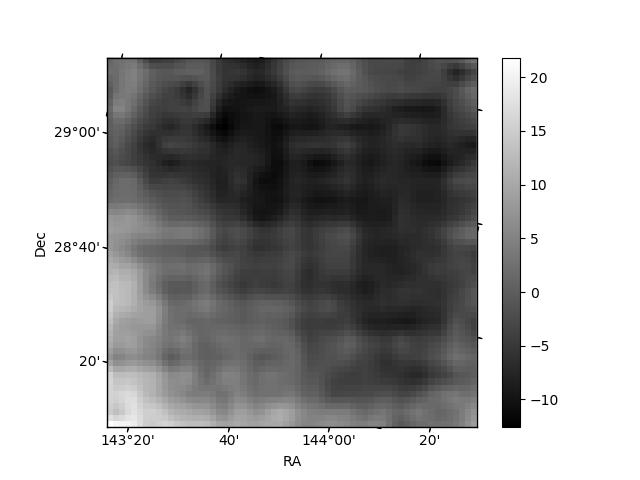
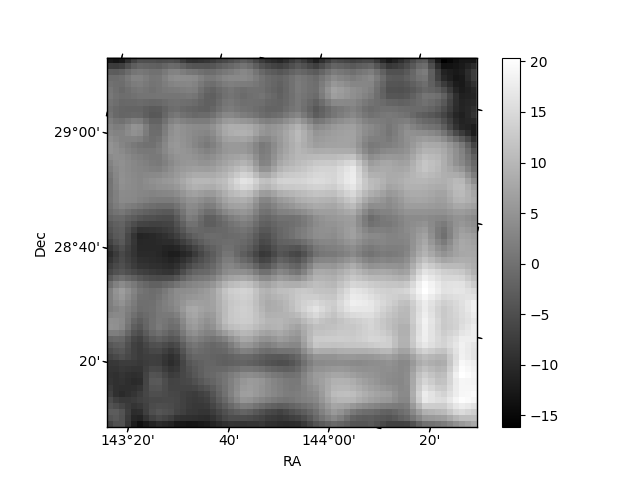
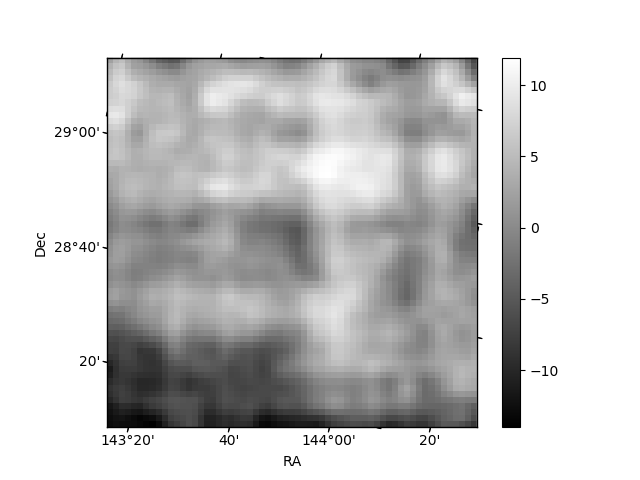
Histogram calculated using DETX and DETY for each event in the final _common_clean file
| Quadrant A | 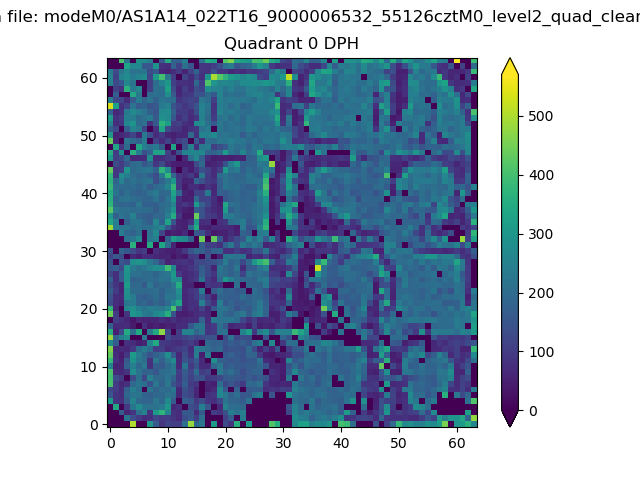 |
 |
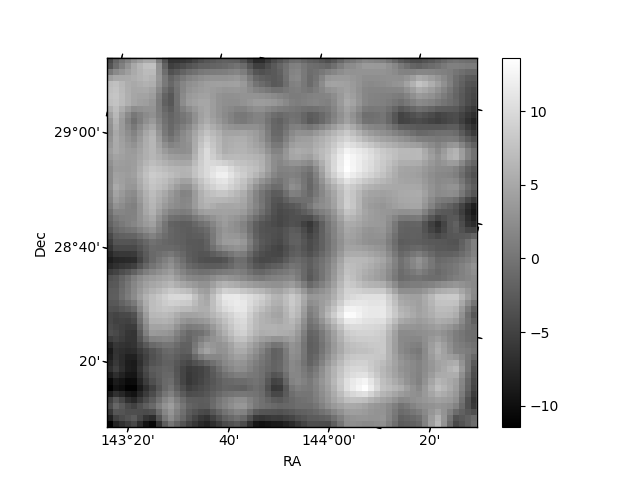
Quadrant B |
|---|---|---|---|
| Quadrant D | 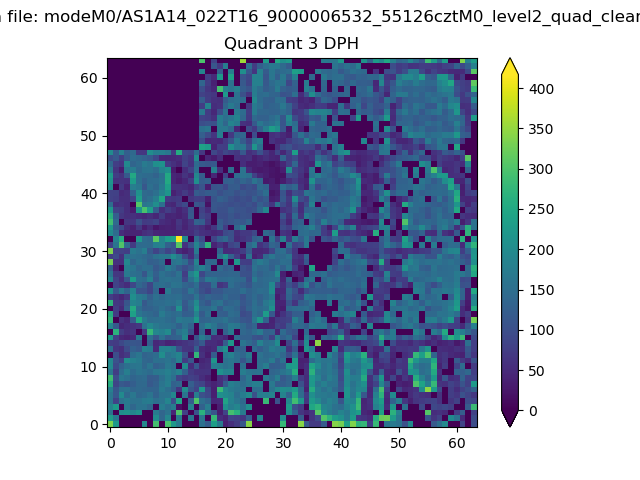 |
 |
Quadrant C |
| Plot type | Count rate plots | Images |
|---|---|---|
| Comparison with Poisson distribution Blue bars denote a histogram of data divided into 1 sec bins. Red curve is a Poisson curve with rate = median count rate of data. |
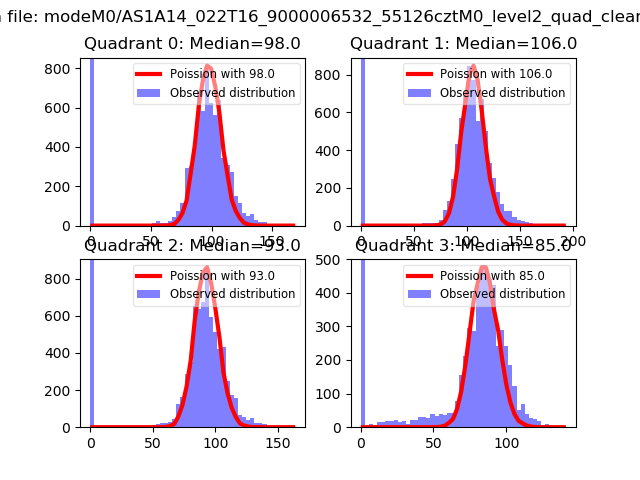 |
 |
| Quadrant-wise count rates Data is divided into 100 sec bins |
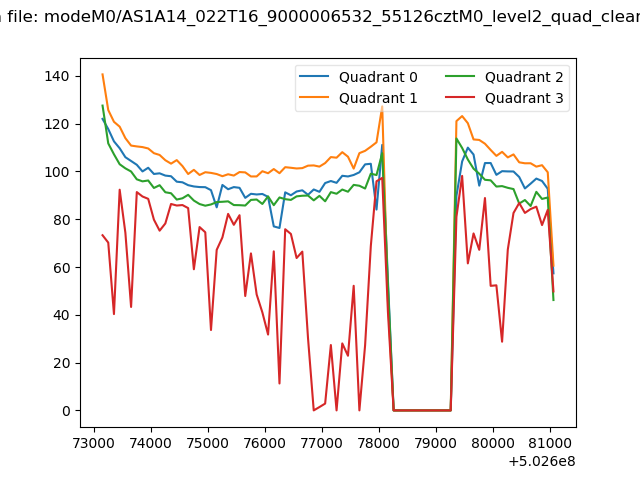 |
|
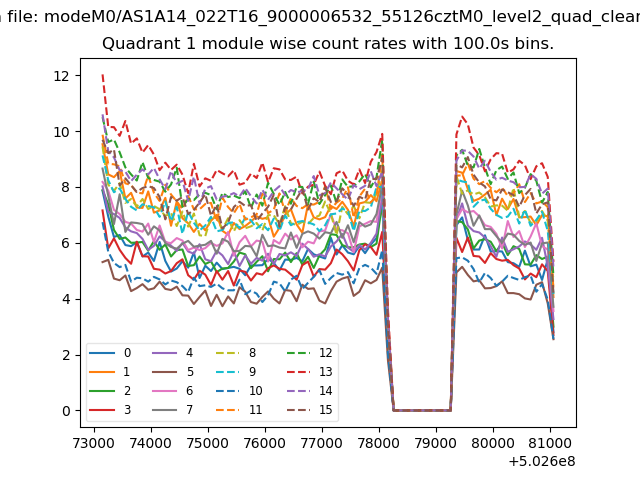
| Module-wise count rates for Quadrant A Data is divided into 100 sec bins |
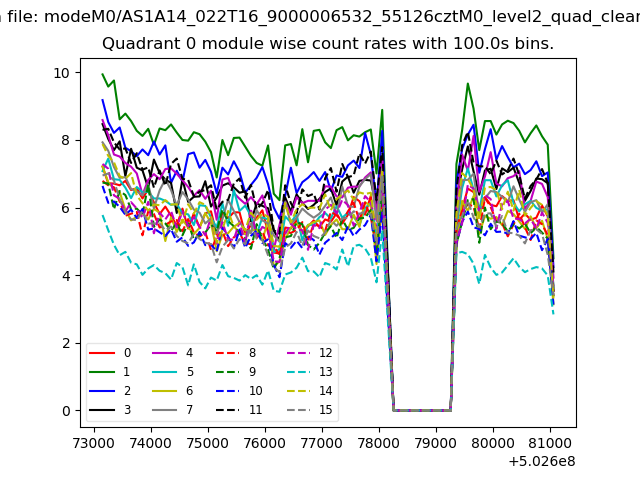 |
 |
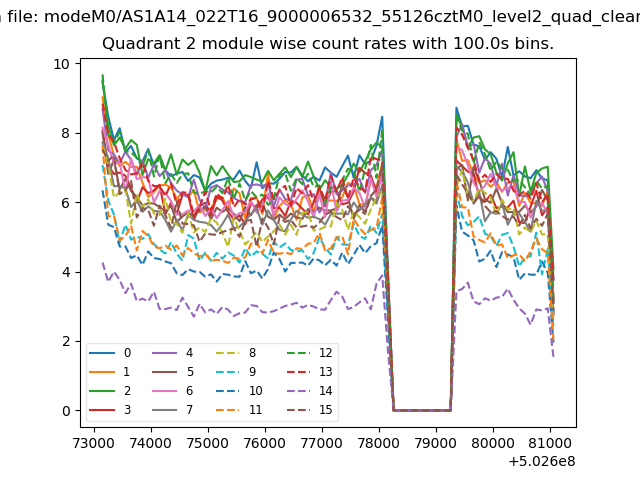
| Module-wise count rates for Quadrant B Data is divided into 100 sec bins |
 |
 |
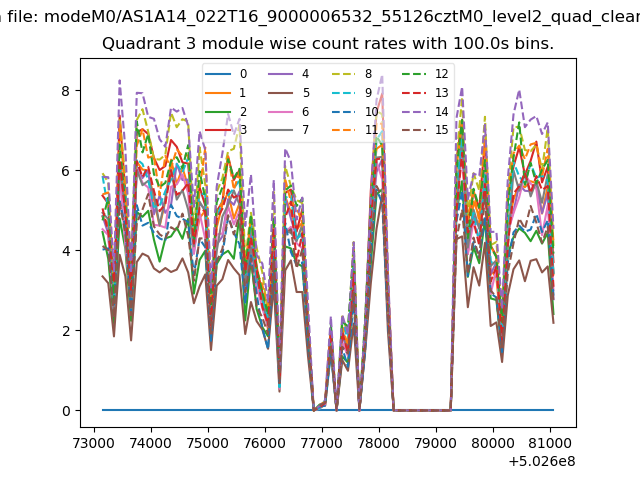
| Module-wise count rates for Quadrant C Data is divided into 100 sec bins |
 |
 |
| Module-wise count rates for Quadrant D Data is divided into 100 sec bins |
 |
 |
| Parameter | Plot |
|---|---|
| CZT HV Monitor | 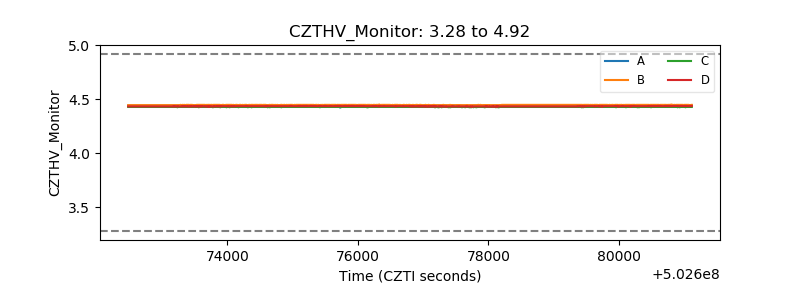 |
| D_VDD |  |
| Temperature 1 | 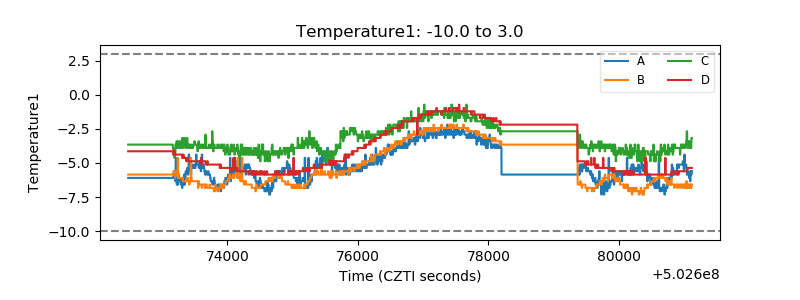 |
| Veto HV Monitor |  |
| Veto LLD | 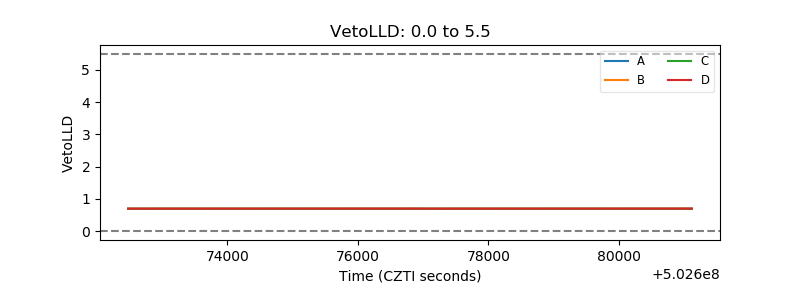 |
| Alpha Counter | 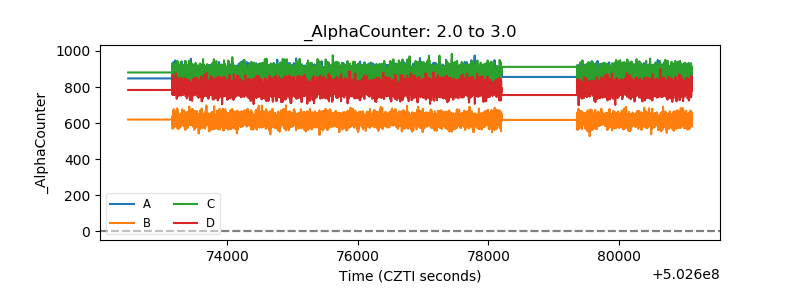 |
| _CPM_Rate | 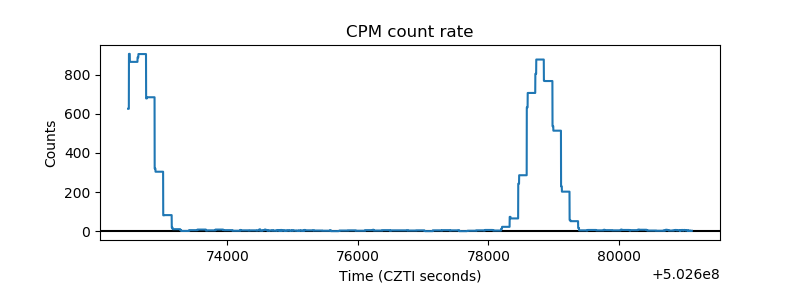 |
| CZT Counter | 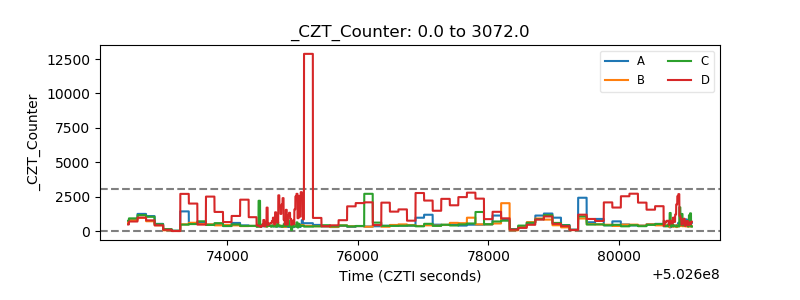 |
| +2.5 Volts monitor |  |
| +5 Volts monitor |  |
| _ROLL_ROT | 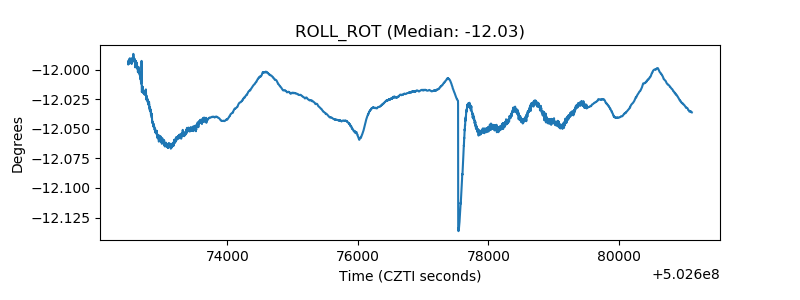 |
| _Roll_DEC | 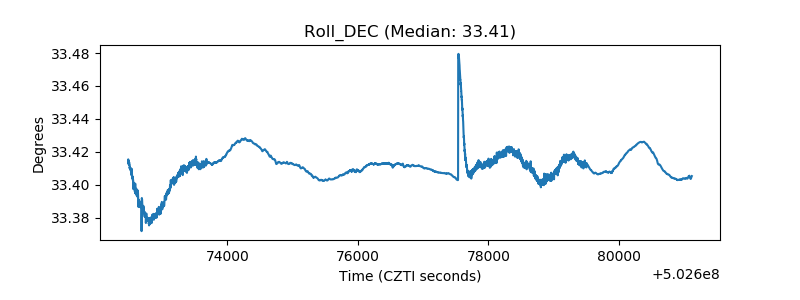 |
| _Roll_RA | 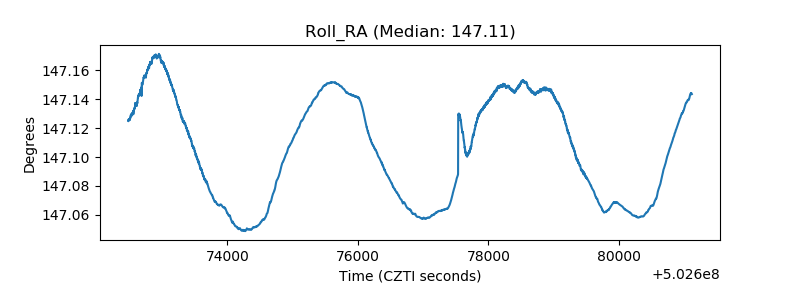 |
| Veto Counter | 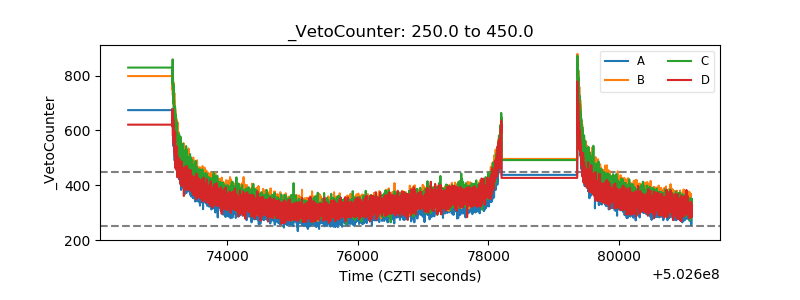 |