| Param | Original file | Final file |
|---|---|---|
| Filename | modeM0/AS1A14_022T16_9000006532_55128cztM0_level2.fits | modeM0/AS1A14_022T16_9000006532_55128cztM0_level2_quad_clean.evt |
| Size (bytes) | 1,659,545,280 | 294,560,640 |
| Size | 1.5 GB | 280.9 MB |
| Events in quadrant A | 12,179,839 | 2,013,156 |
| Events in quadrant B | 9,420,959 | 2,205,041 |
| Events in quadrant C | 10,705,277 | 1,928,205 |
| Events in quadrant D | 27,483,646 | 1,310,418 |
| Mode SS | |||
|---|---|---|---|
| Quadrant | BADHDUFLAG | Total packets | Discarded packets |
| A | 0 | 442 | 8 |
| B | 0 | 442 | 4 |
| C | 0 | 442 | 4 |
| D | 0 | 442 | 10 |
| Mode M0 | |||
|---|---|---|---|
| Quadrant | BADHDUFLAG | Total packets | Discarded packets |
| A | 0 | 52871 | 641 |
| B | 0 | 45068 | 653 |
| C | 0 | 48685 | 780 |
| D | 0 | 97568 | 934 |
| Mode M9 | |||
|---|---|---|---|
| Quadrant | BADHDUFLAG | Total packets | Discarded packets |
| A | 0 | 43 | 0 |
| B | 0 | 43 | 0 |
| C | 0 | 43 | 0 |
| D | 0 | 43 | 0 |
| Quadrant | Total seconds | Saturated seconds | Saturation percentage |
|---|---|---|---|
| A | 21230 | 493 | 2.322186% |
| B | 21223 | 184 | 0.866984% |
| C | 21225 | 270 | 1.272085% |
| D | 21197 | 5531 | 26.093315% |
Noise dominated data is calculated using 1-second bins in cleaned event files. If a bin has >2000 counts, and if more than 50% of those come from <1% of pixels, then it is considered to be noise-dominated and hence unusable.
| Quadrant | # 1 sec bins | Bins with >0 counts | Bins with >2000 counts | High rate bins dominated by noise | Noise dominated (total time) | Noise dominated (detector-on time) | Marked lightcurve |
|---|---|---|---|---|---|---|---|
| A | 25999 | 21335 | 303 | 303 | 1.17% | 1.42% | 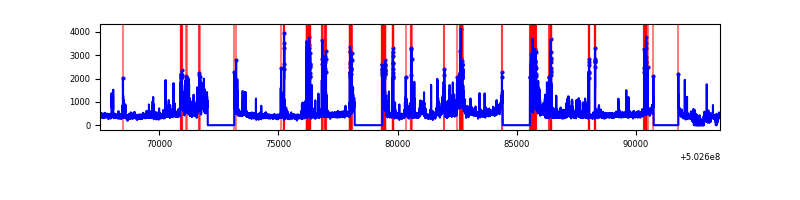 |
| B | 25999 | 21337 | 48 | 48 | 0.18% | 0.22% | 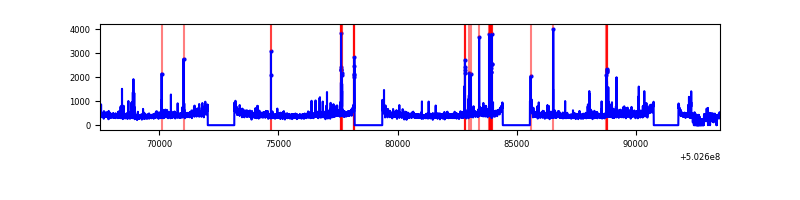 |
| C | 25999 | 21320 | 210 | 210 | 0.81% | 0.98% | 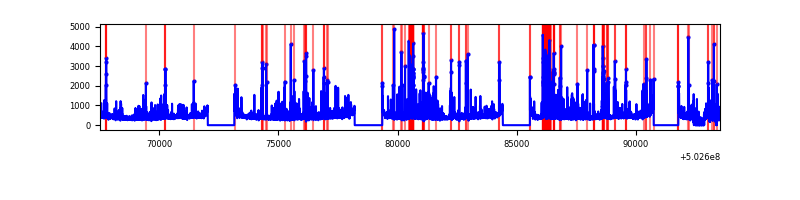 |
| D | 25999 | 21311 | 5238 | 5238 | 20.15% | 24.58% | 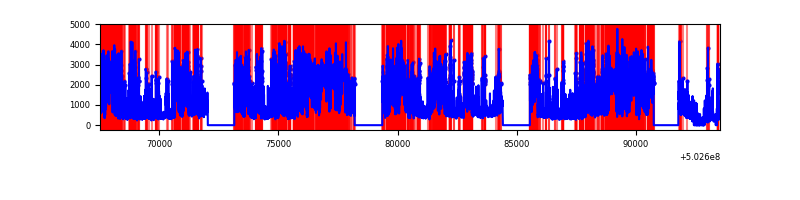 |
Top three noisy pixels from each quadrant. If the there are fewer than three noisy pixels in the level2.evt file, extra rows are filled as -1
| Pixel properties | Quadrant properties | ||||||
|---|---|---|---|---|---|---|---|
| Quadrant | DetID | PixID | Counts | Sigma | Mean | Median | Sigma |
| A | 12 | 115 | 1278872 | 2331.26 | 2227 | 2169 | 547.6 |
| A | 5 | 241 | 1072149 | 1953.78 | 2227 | 2169 | 547.6 |
| A | 0 | 8 | 1047074 | 1907.99 | 2227 | 2169 | 547.6 |
| B | 2 | 249 | 168919 | 350.47 | 2221 | 2136 | 475.9 |
| B | 0 | 182 | 124792 | 257.75 | 2221 | 2136 | 475.9 |
| B | 5 | 185 | 113402 | 233.81 | 2221 | 2136 | 475.9 |
| C | 13 | 3 | 1198667 | 2031.44 | 2165 | 2150 | 589.0 |
| C | 15 | 178 | 232479 | 391.05 | 2165 | 2150 | 589.0 |
| C | 6 | 223 | 218778 | 367.79 | 2165 | 2150 | 589.0 |
| D | 11 | 129 | 19038039 | 36216.52 | 1872 | 1792 | 525.6 |
| D | 3 | 176 | 173358 | 326.4 | 1872 | 1792 | 525.6 |
| D | 15 | 94 | 145619 | 273.63 | 1872 | 1792 | 525.6 |
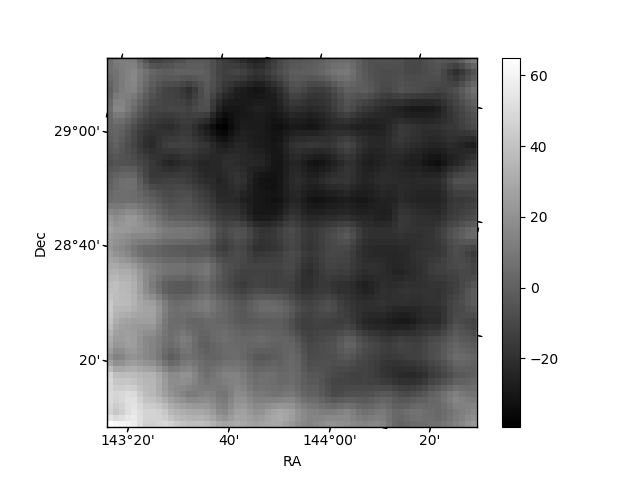
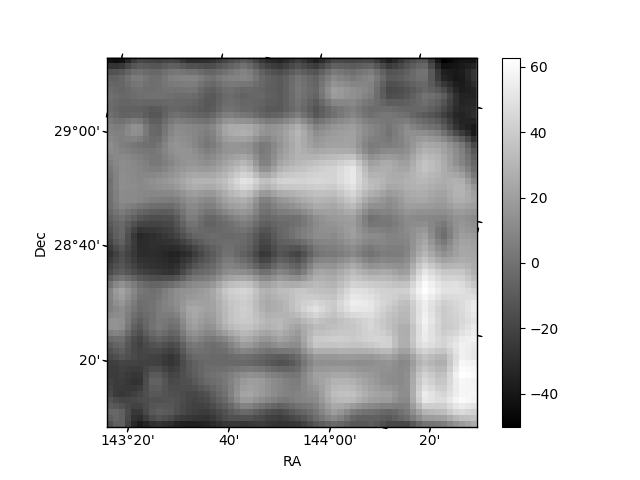
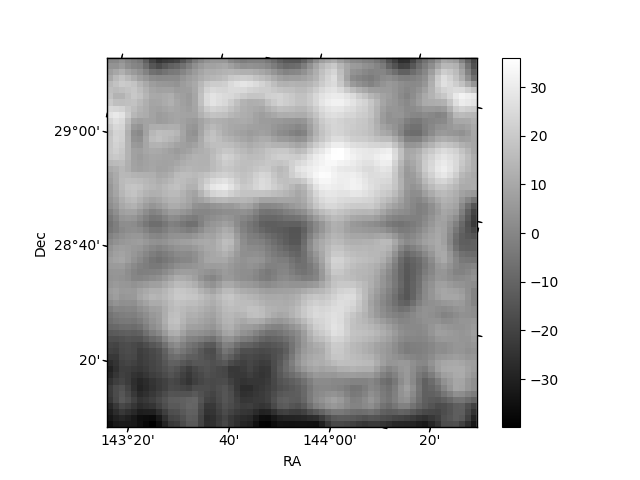
Histogram calculated using DETX and DETY for each event in the final _common_clean file
| Quadrant A | 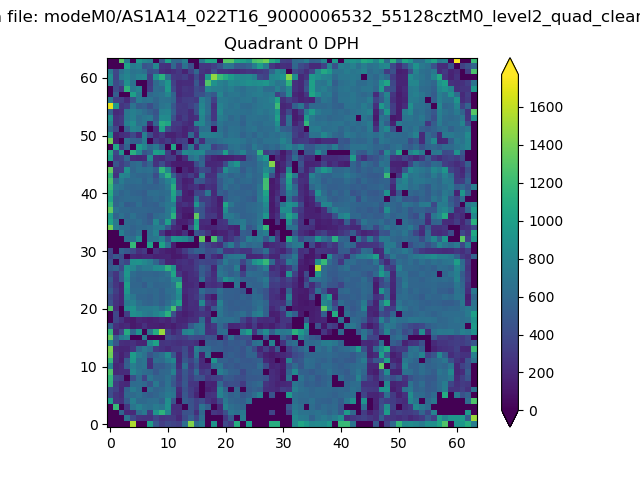 |
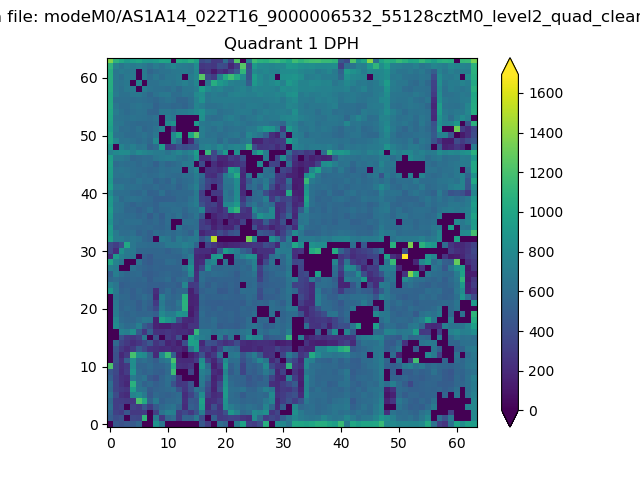 |
Quadrant B |
|---|---|---|---|
| Quadrant D | 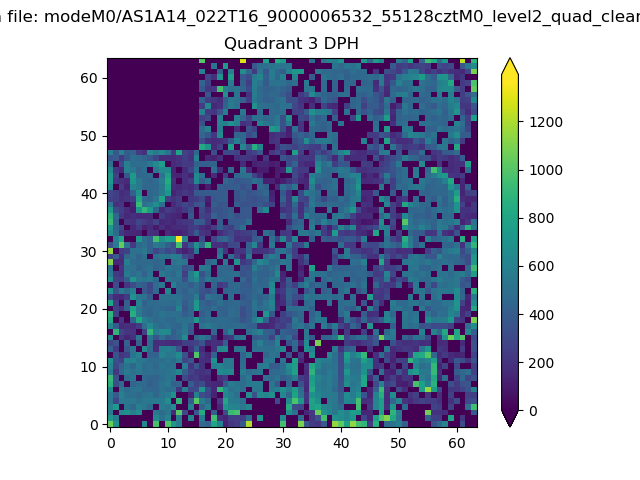 |
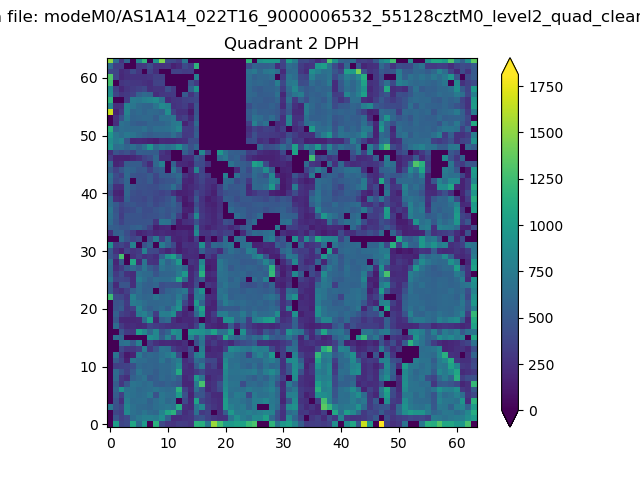 |
Quadrant C |
| Plot type | Count rate plots | Images |
|---|---|---|
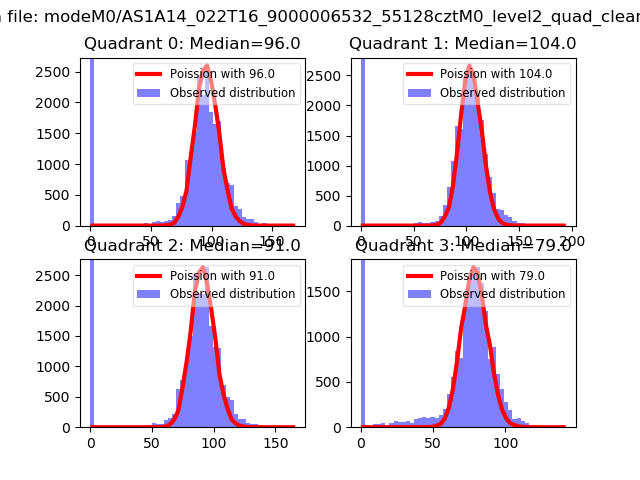
| Comparison with Poisson distribution Blue bars denote a histogram of data divided into 1 sec bins. Red curve is a Poisson curve with rate = median count rate of data. |
 |
 |
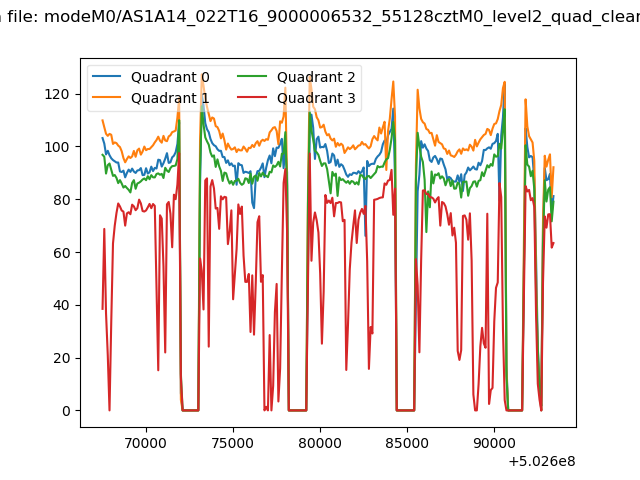
| Quadrant-wise count rates Data is divided into 100 sec bins |
 |
|
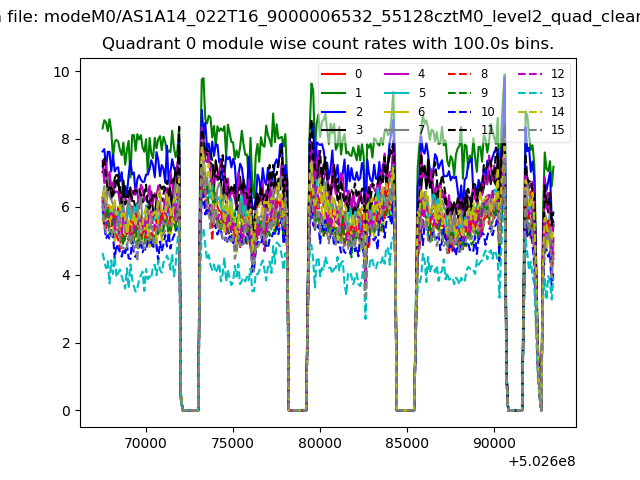
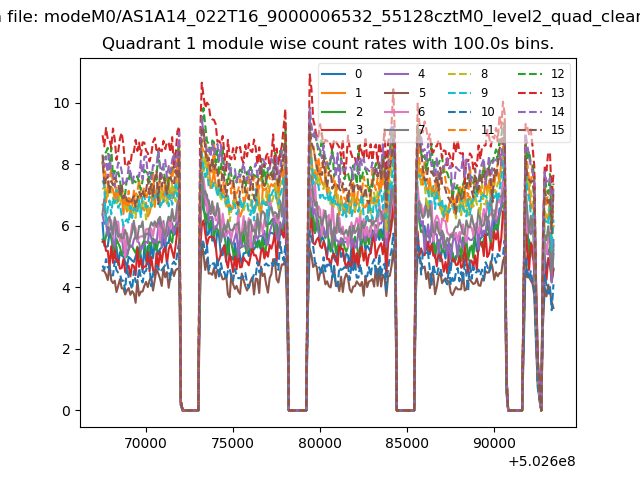
| Module-wise count rates for Quadrant A Data is divided into 100 sec bins |
 |
 |
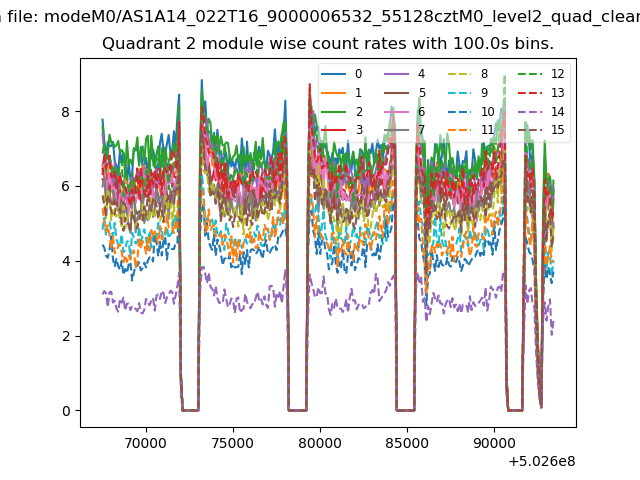
| Module-wise count rates for Quadrant B Data is divided into 100 sec bins |
 |
 |
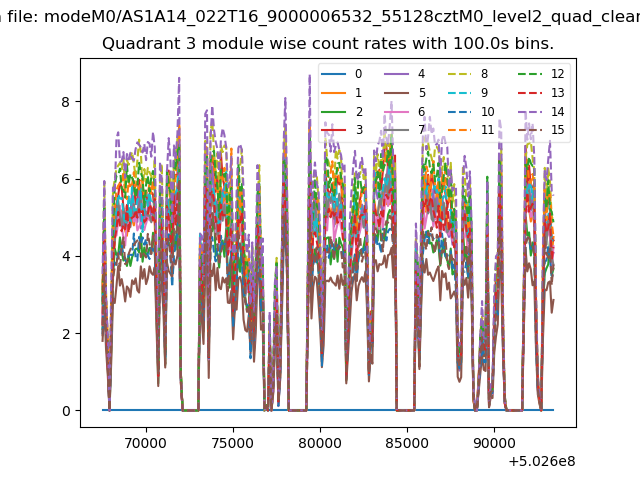
| Module-wise count rates for Quadrant C Data is divided into 100 sec bins |
 |
 |
| Module-wise count rates for Quadrant D Data is divided into 100 sec bins |
 |
 |
| Parameter | Plot |
|---|---|
| CZT HV Monitor | 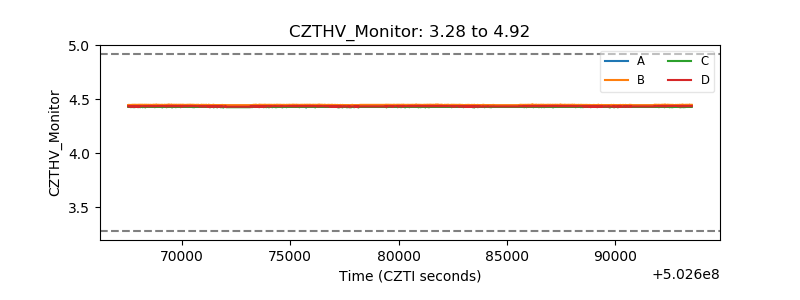 |
| D_VDD | 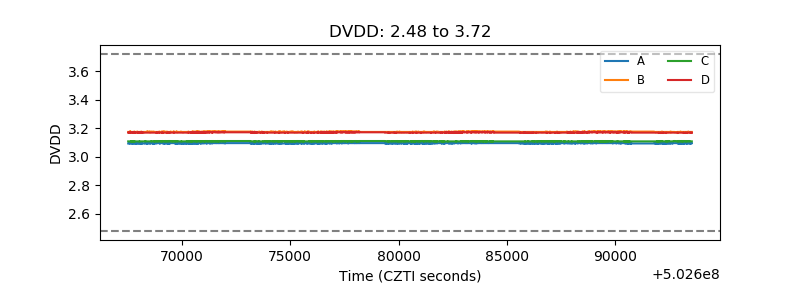 |
| Temperature 1 | 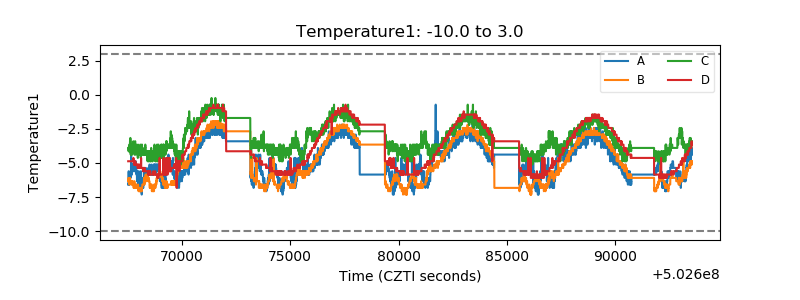 |
| Veto HV Monitor | 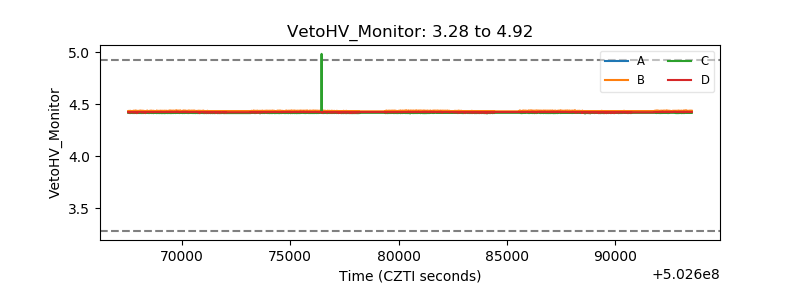 |
| Veto LLD |  |
| Alpha Counter |  |
| _CPM_Rate | 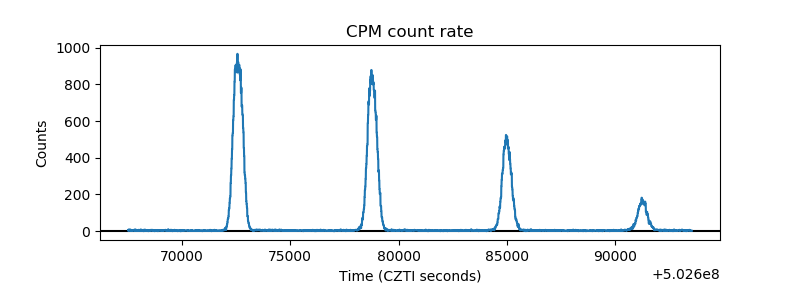 |
| CZT Counter | 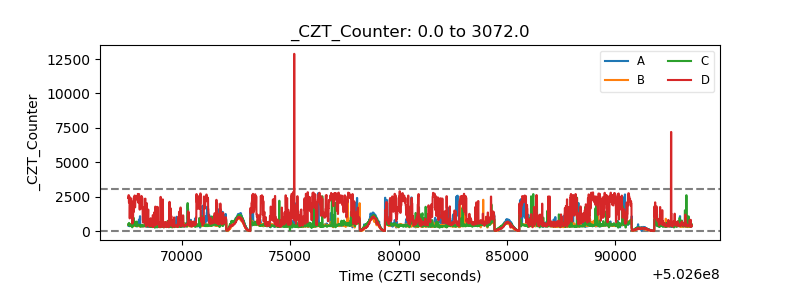 |
| +2.5 Volts monitor |  |
| +5 Volts monitor | 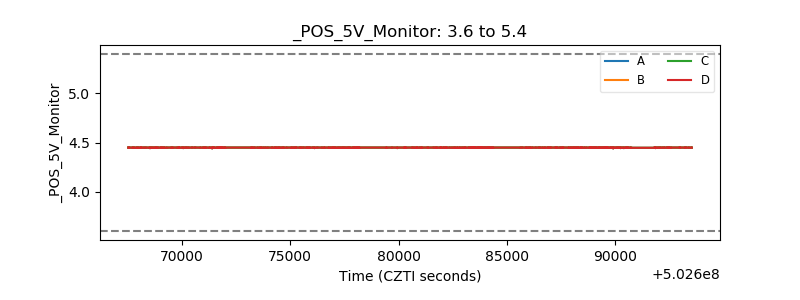 |
| _ROLL_ROT | 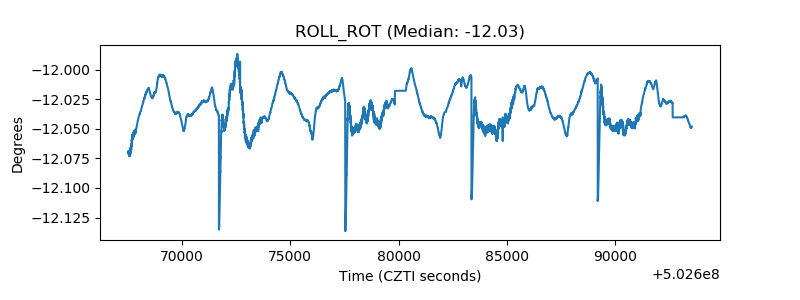 |
| _Roll_DEC | 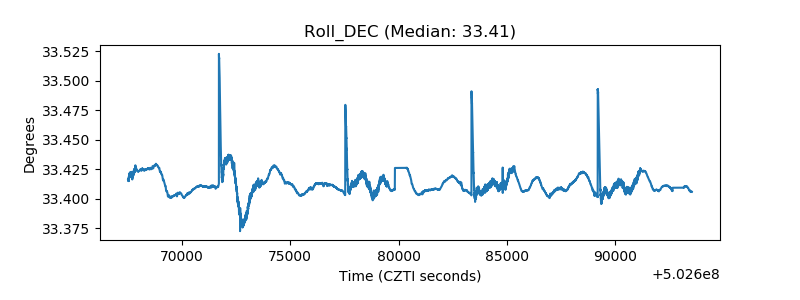 |
| _Roll_RA | 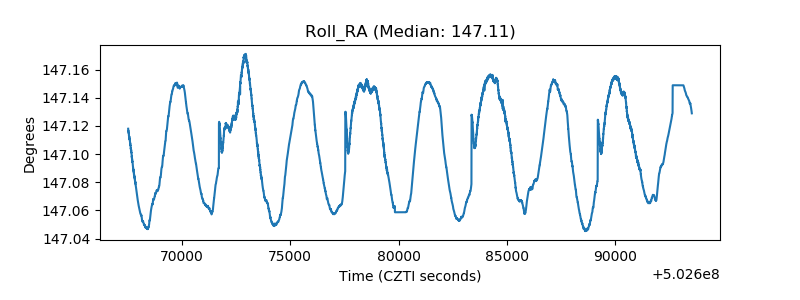 |
| Veto Counter | 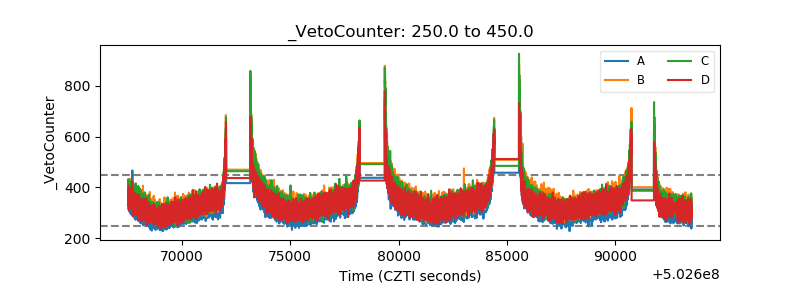 |