| Param | Original file | Final file |
|---|---|---|
| Filename | modeM0/AS1A14_022T16_9000006532_55131cztM0_level2.fits | modeM0/AS1A14_022T16_9000006532_55131cztM0_level2_quad_clean.evt |
| Size (bytes) | 479,177,280 | 94,610,880 |
| Size | 457.0 MB | 90.2 MB |
| Events in quadrant A | 6,348,111 | 566,733 |
| Events in quadrant B | 2,895,880 | 681,815 |
| Events in quadrant C | 3,366,628 | 595,023 |
| Events in quadrant D | 4,591,838 | 541,500 |
| Mode SS | |||
|---|---|---|---|
| Quadrant | BADHDUFLAG | Total packets | Discarded packets |
| A | 0 | 138 | 0 |
| B | 0 | 138 | 0 |
| C | 0 | 138 | 0 |
| D | 0 | 138 | 0 |
| Mode M0 | |||
|---|---|---|---|
| Quadrant | BADHDUFLAG | Total packets | Discarded packets |
| A | 0 | 23755 | 0 |
| B | 0 | 14016 | 9 |
| C | 0 | 15246 | 0 |
| D | 0 | 18581 | 4 |
| Quadrant | Total seconds | Saturated seconds | Saturation percentage |
|---|---|---|---|
| A | 6885 | 949 | 13.783588% |
| B | 6881 | 14 | 0.203459% |
| C | 6885 | 59 | 0.856935% |
| D | 6883 | 291 | 4.227808% |
Noise dominated data is calculated using 1-second bins in cleaned event files. If a bin has >2000 counts, and if more than 50% of those come from <1% of pixels, then it is considered to be noise-dominated and hence unusable.
| Quadrant | # 1 sec bins | Bins with >0 counts | Bins with >2000 counts | High rate bins dominated by noise | Noise dominated (total time) | Noise dominated (detector-on time) | Marked lightcurve |
|---|---|---|---|---|---|---|---|
| A | 6885 | 6885 | 747 | 747 | 10.85% | 10.85% | 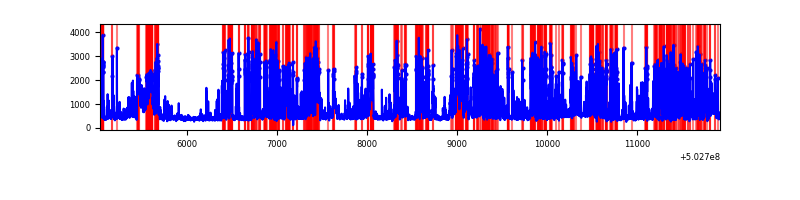 |
| B | 6886 | 6883 | 2 | 2 | 0.03% | 0.03% | 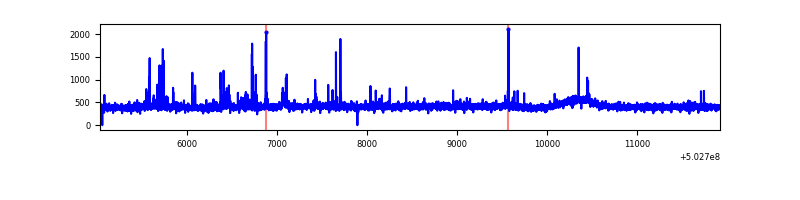 |
| C | 6885 | 6885 | 53 | 53 | 0.77% | 0.77% | 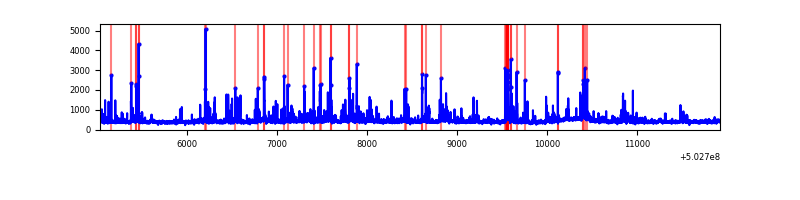 |
| D | 6885 | 6884 | 283 | 283 | 4.11% | 4.11% | 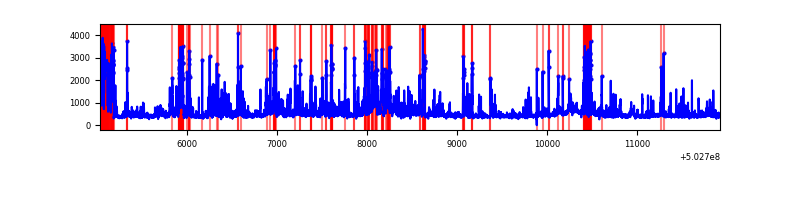 |
Top three noisy pixels from each quadrant. If the there are fewer than three noisy pixels in the level2.evt file, extra rows are filled as -1
| Pixel properties | Quadrant properties | ||||||
|---|---|---|---|---|---|---|---|
| Quadrant | DetID | PixID | Counts | Sigma | Mean | Median | Sigma |
| A | 7 | 190 | 2500514 | 15008.26 | 673 | 655 | 166.6 |
| A | 4 | 206 | 465258 | 2789.31 | 673 | 655 | 166.6 |
| A | 15 | 32 | 368354 | 2207.53 | 673 | 655 | 166.6 |
| B | 0 | 182 | 40042 | 259.15 | 702 | 676 | 151.9 |
| B | 5 | 185 | 28572 | 183.64 | 702 | 676 | 151.9 |
| B | 2 | 249 | 22503 | 143.69 | 702 | 676 | 151.9 |
| C | 13 | 3 | 284735 | 1519.65 | 686 | 680 | 186.9 |
| C | 6 | 223 | 170095 | 906.35 | 686 | 680 | 186.9 |
| C | 14 | 254 | 84464 | 448.23 | 686 | 680 | 186.9 |
| D | 11 | 129 | 842862 | 4424.63 | 674 | 647 | 190.3 |
| D | 15 | 94 | 567641 | 2978.74 | 674 | 647 | 190.3 |
| D | 11 | 176 | 132538 | 692.9 | 674 | 647 | 190.3 |
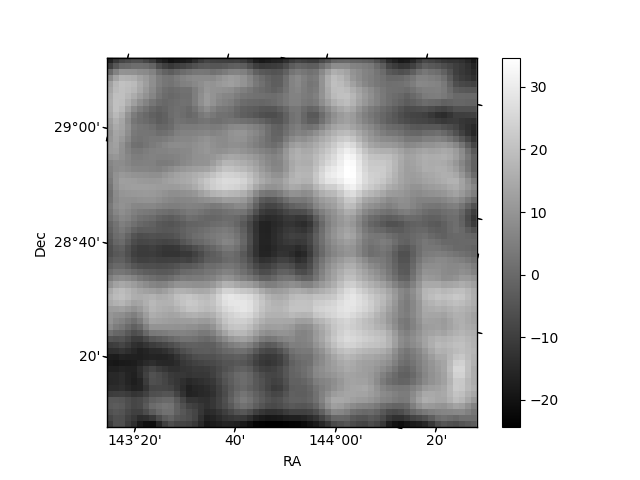
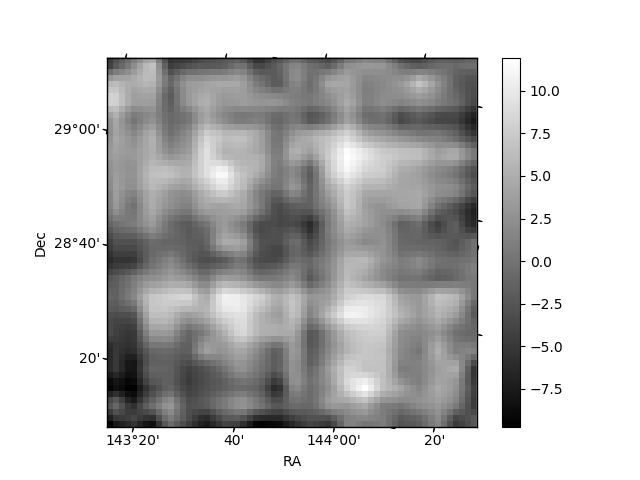
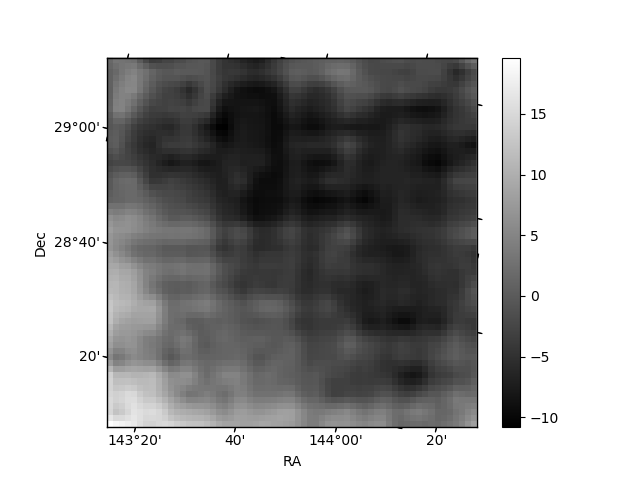
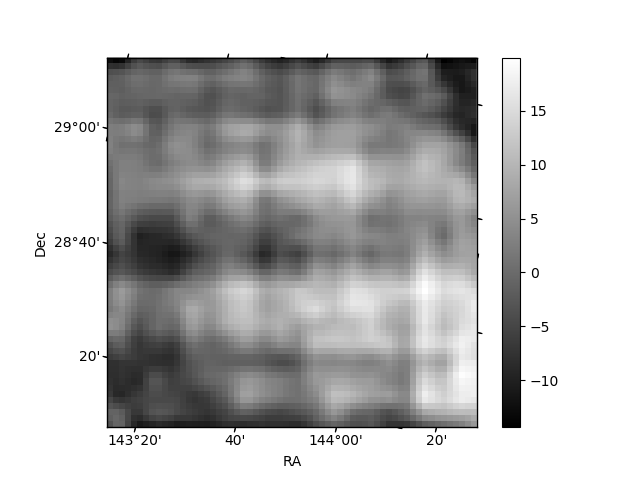
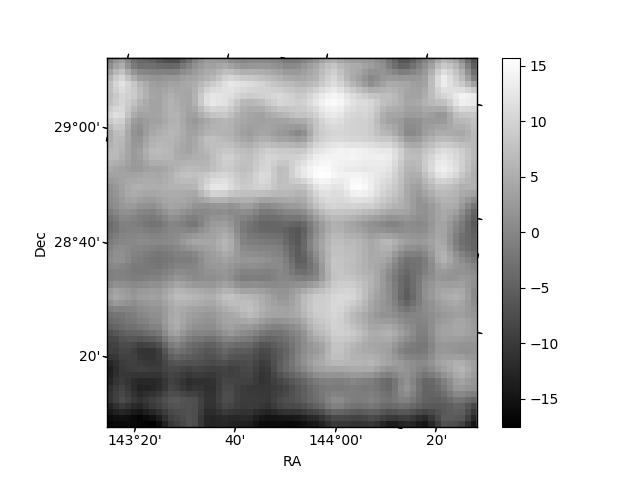
Histogram calculated using DETX and DETY for each event in the final _common_clean file
| Quadrant A | 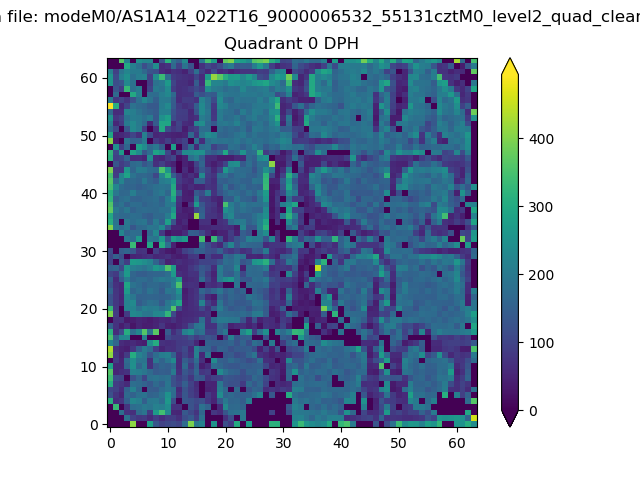 |
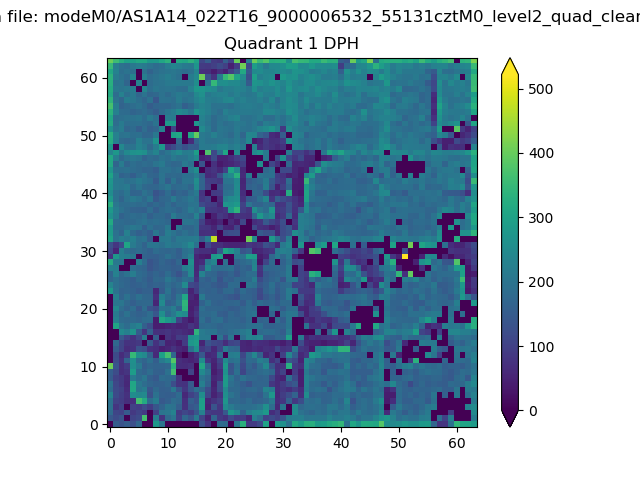 |
Quadrant B |
|---|---|---|---|
| Quadrant D | 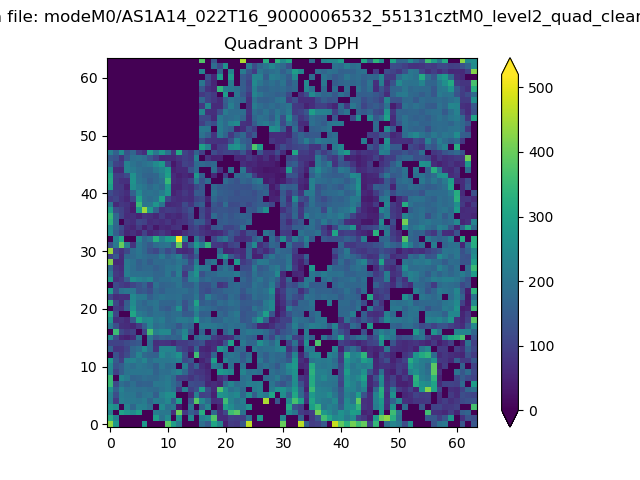 |
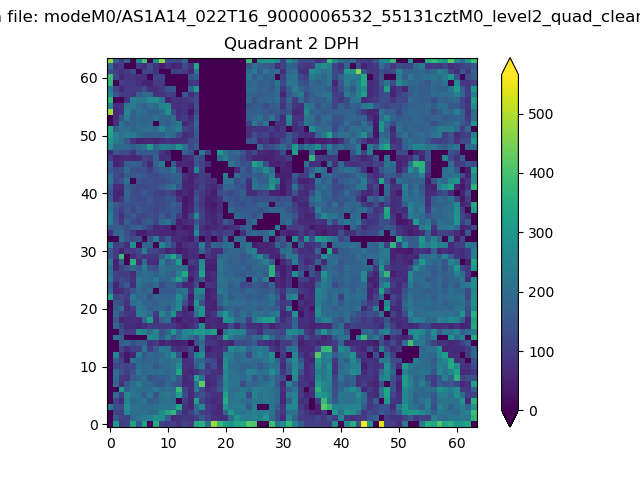 |
Quadrant C |
| Plot type | Count rate plots | Images |
|---|---|---|
| Comparison with Poisson distribution Blue bars denote a histogram of data divided into 1 sec bins. Red curve is a Poisson curve with rate = median count rate of data. |
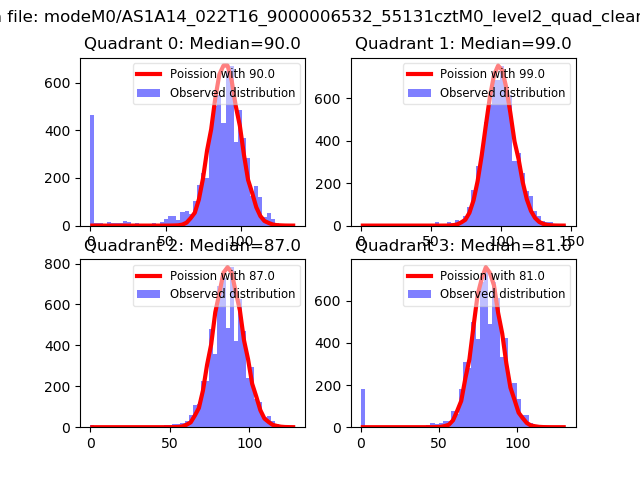 |
 |
| Quadrant-wise count rates Data is divided into 100 sec bins |
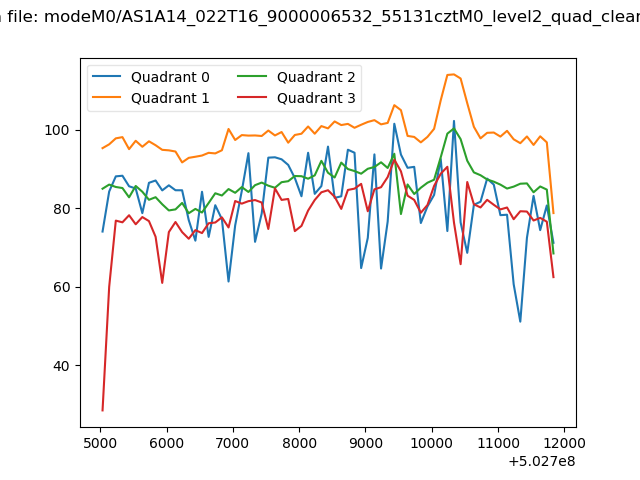 |
|
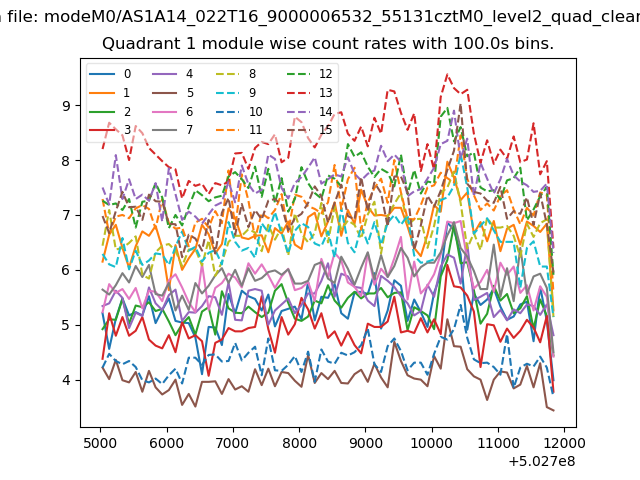
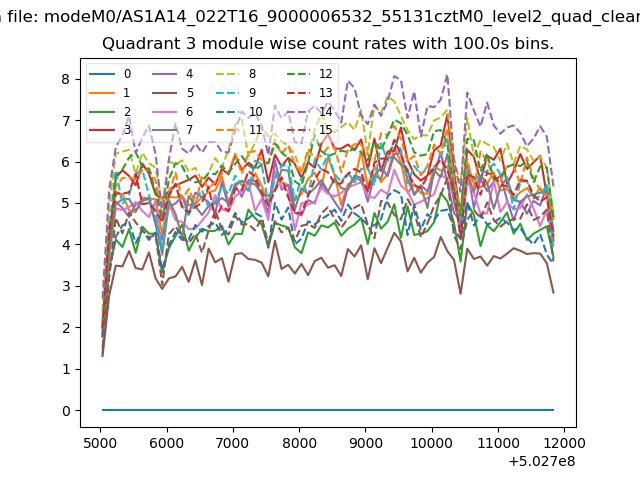
| Module-wise count rates for Quadrant A Data is divided into 100 sec bins |
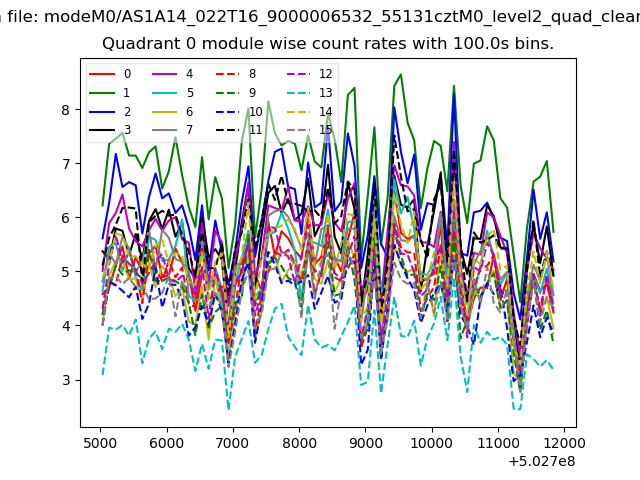 |
 |
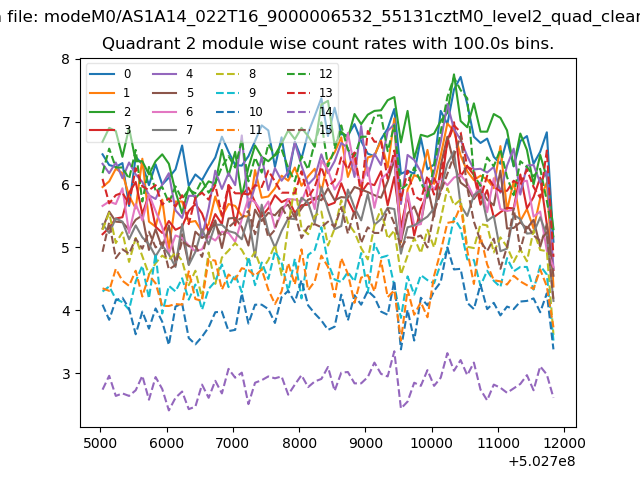
| Module-wise count rates for Quadrant B Data is divided into 100 sec bins |
 |
 |
| Module-wise count rates for Quadrant C Data is divided into 100 sec bins |
 |
 |
| Module-wise count rates for Quadrant D Data is divided into 100 sec bins |
 |
 |
| Parameter | Plot |
|---|---|
| CZT HV Monitor | 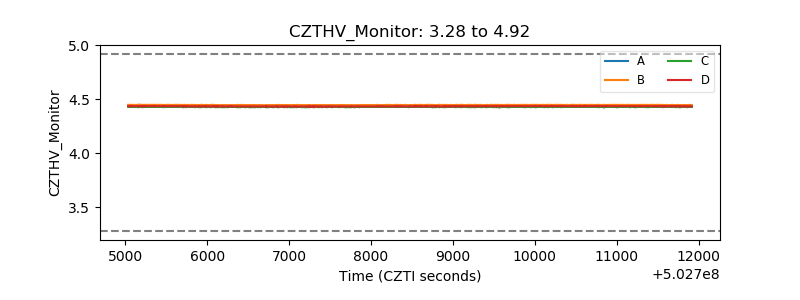 |
| D_VDD | 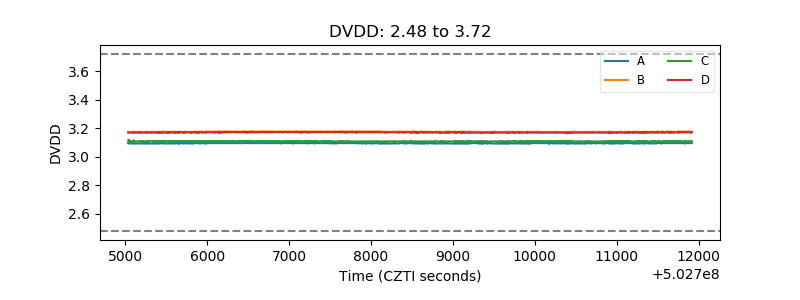 |
| Temperature 1 | 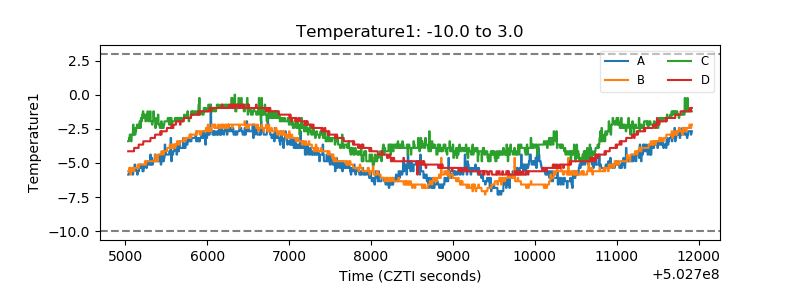 |
| Veto HV Monitor | 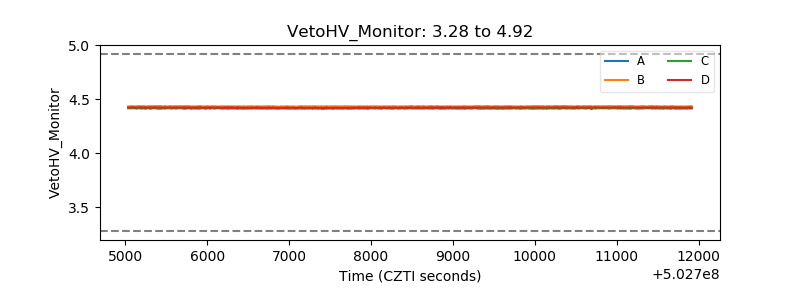 |
| Veto LLD | 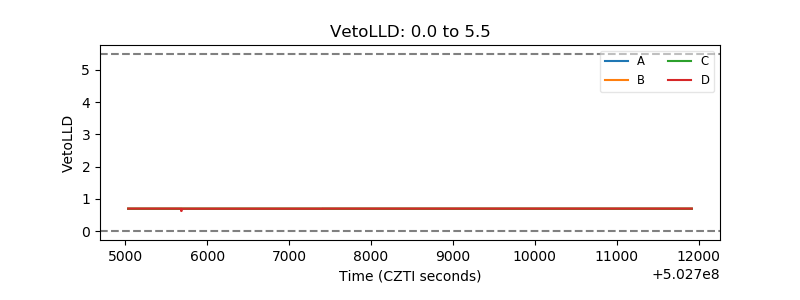 |
| Alpha Counter | 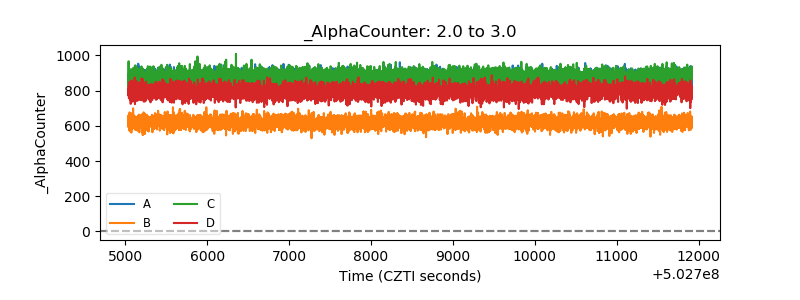 |
| _CPM_Rate | 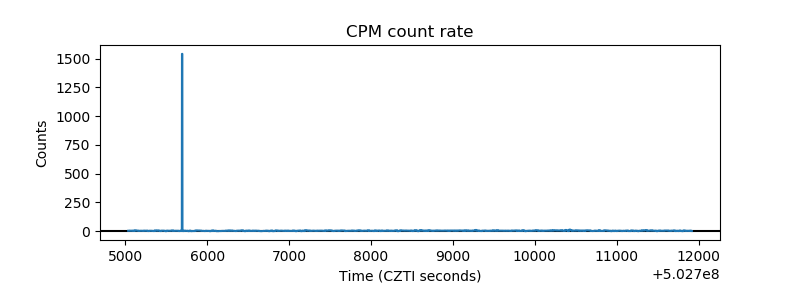 |
| CZT Counter | 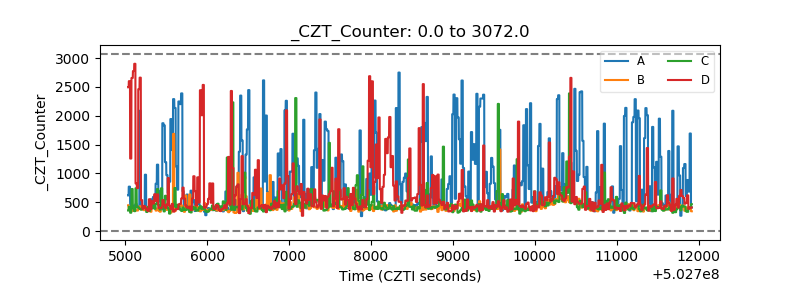 |
| +2.5 Volts monitor | 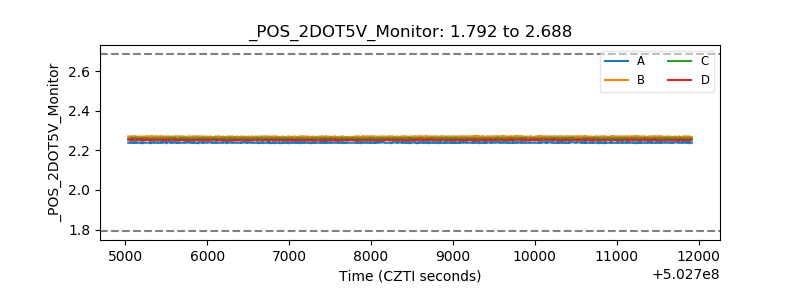 |
| +5 Volts monitor |  |
| _ROLL_ROT | 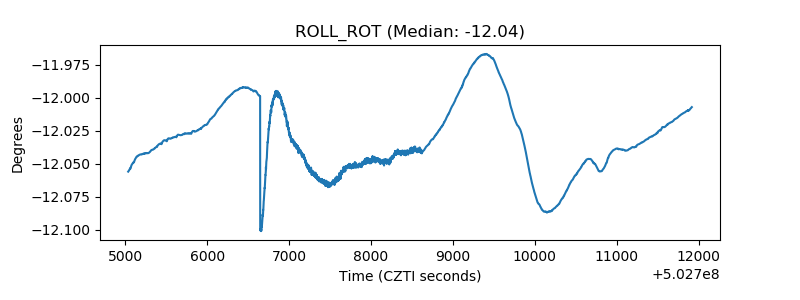 |
| _Roll_DEC | 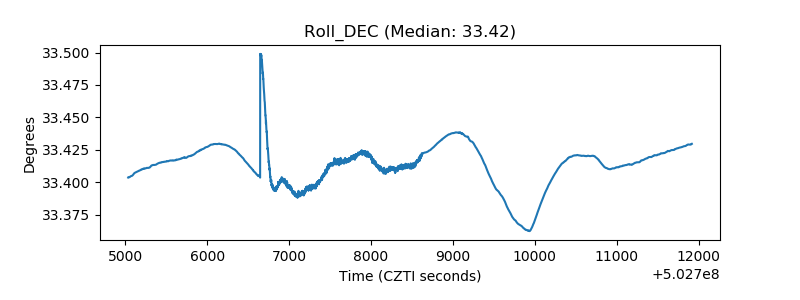 |
| _Roll_RA | 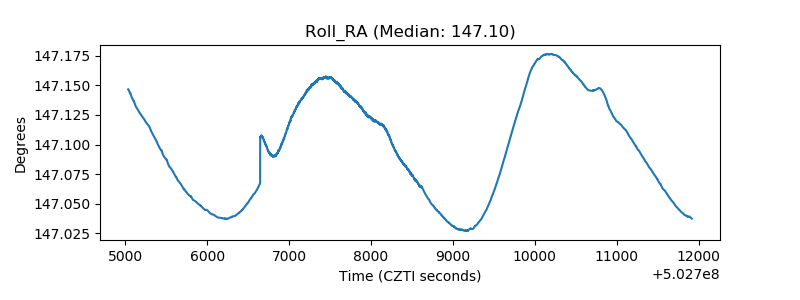 |
| Veto Counter | 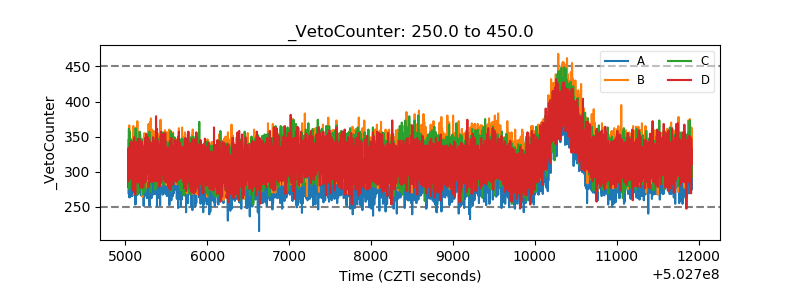 |