| Param | Original file | Final file |
|---|---|---|
| Filename | modeM0/AS1A14_022T16_9000006532_55132cztM0_level2.fits | modeM0/AS1A14_022T16_9000006532_55132cztM0_level2_quad_clean.evt |
| Size (bytes) | 470,975,040 | 102,427,200 |
| Size | 449.2 MB | 97.7 MB |
| Events in quadrant A | 5,801,148 | 613,789 |
| Events in quadrant B | 3,360,799 | 731,053 |
| Events in quadrant C | 3,482,352 | 639,761 |
| Events in quadrant D | 4,215,333 | 602,793 |
| Mode SS | |||
|---|---|---|---|
| Quadrant | BADHDUFLAG | Total packets | Discarded packets |
| A | 0 | 148 | 0 |
| B | 0 | 148 | 0 |
| C | 0 | 148 | 0 |
| D | 0 | 148 | 0 |
| Mode M0 | |||
|---|---|---|---|
| Quadrant | BADHDUFLAG | Total packets | Discarded packets |
| A | 0 | 22571 | 0 |
| B | 0 | 15642 | 5 |
| C | 0 | 16031 | 10 |
| D | 0 | 17888 | 5 |
| Quadrant | Total seconds | Saturated seconds | Saturation percentage |
|---|---|---|---|
| A | 7386 | 894 | 12.103981% |
| B | 7382 | 50 | 0.677323% |
| C | 7380 | 77 | 1.043360% |
| D | 7386 | 124 | 1.678852% |
Noise dominated data is calculated using 1-second bins in cleaned event files. If a bin has >2000 counts, and if more than 50% of those come from <1% of pixels, then it is considered to be noise-dominated and hence unusable.
| Quadrant | # 1 sec bins | Bins with >0 counts | Bins with >2000 counts | High rate bins dominated by noise | Noise dominated (total time) | Noise dominated (detector-on time) | Marked lightcurve |
|---|---|---|---|---|---|---|---|
| A | 7386 | 7386 | 698 | 698 | 9.45% | 9.45% | 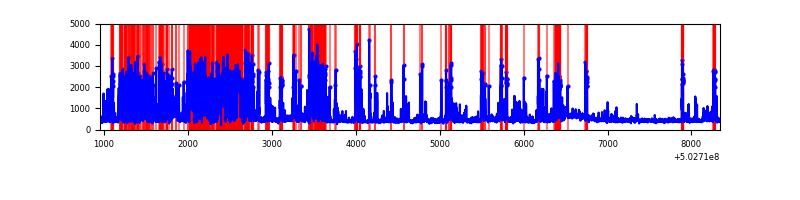 |
| B | 7386 | 7385 | 24 | 24 | 0.32% | 0.32% | 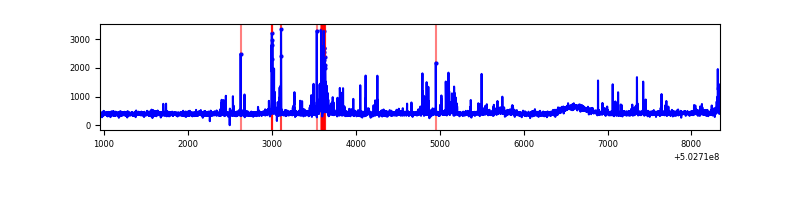 |
| C | 7386 | 7383 | 52 | 52 | 0.70% | 0.70% | 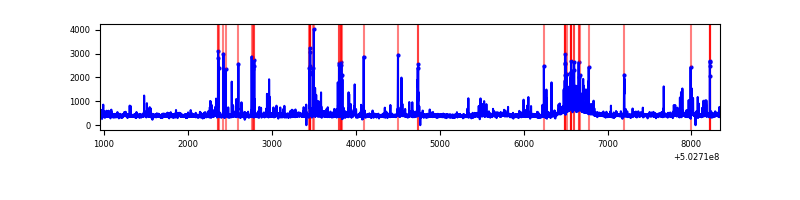 |
| D | 7387 | 7387 | 108 | 108 | 1.46% | 1.46% | 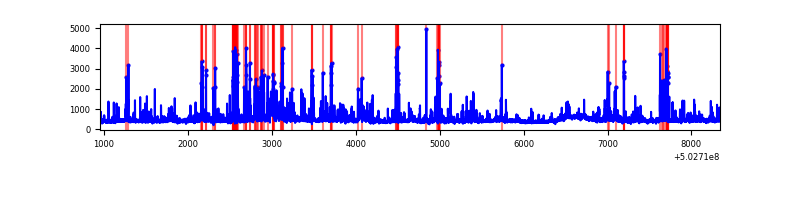 |
Top three noisy pixels from each quadrant. If the there are fewer than three noisy pixels in the level2.evt file, extra rows are filled as -1
| Pixel properties | Quadrant properties | ||||||
|---|---|---|---|---|---|---|---|
| Quadrant | DetID | PixID | Counts | Sigma | Mean | Median | Sigma |
| A | 7 | 190 | 2371890 | 13088.65 | 730 | 711 | 181.2 |
| A | 0 | 8 | 318481 | 1754.06 | 730 | 711 | 181.2 |
| A | 15 | 32 | 179204 | 985.26 | 730 | 711 | 181.2 |
| B | 4 | 81 | 90213 | 542.63 | 760 | 733 | 164.9 |
| B | 2 | 249 | 88672 | 533.28 | 760 | 733 | 164.9 |
| B | 5 | 185 | 56207 | 336.41 | 760 | 733 | 164.9 |
| C | 6 | 223 | 247950 | 1215.53 | 744 | 739 | 203.4 |
| C | 13 | 3 | 99503 | 485.62 | 744 | 739 | 203.4 |
| C | 1 | 16 | 69229 | 336.76 | 744 | 739 | 203.4 |
| D | 11 | 129 | 674655 | 3218.79 | 743 | 709 | 209.4 |
| D | 15 | 94 | 335418 | 1598.58 | 743 | 709 | 209.4 |
| D | 7 | 129 | 81423 | 385.49 | 743 | 709 | 209.4 |
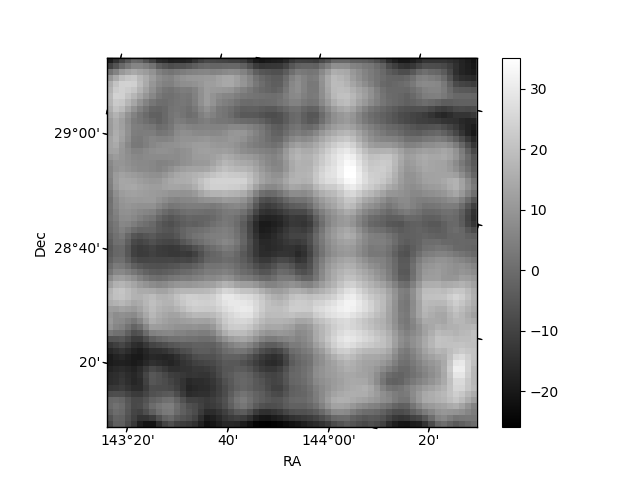
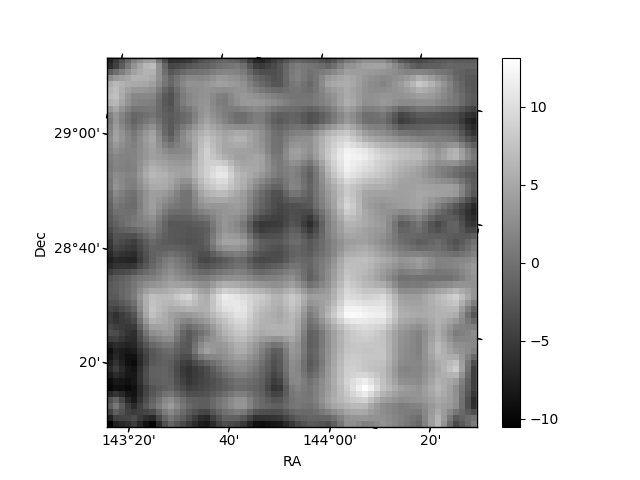
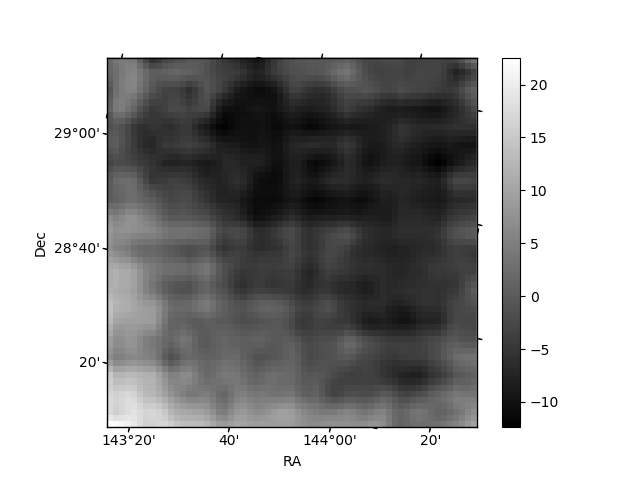
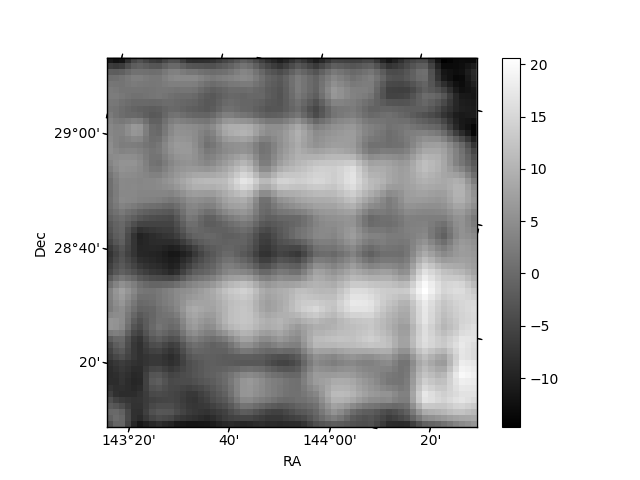
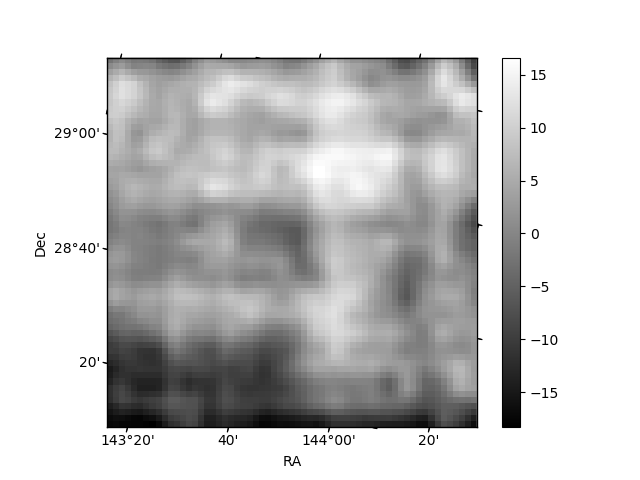
Histogram calculated using DETX and DETY for each event in the final _common_clean file
| Quadrant A | 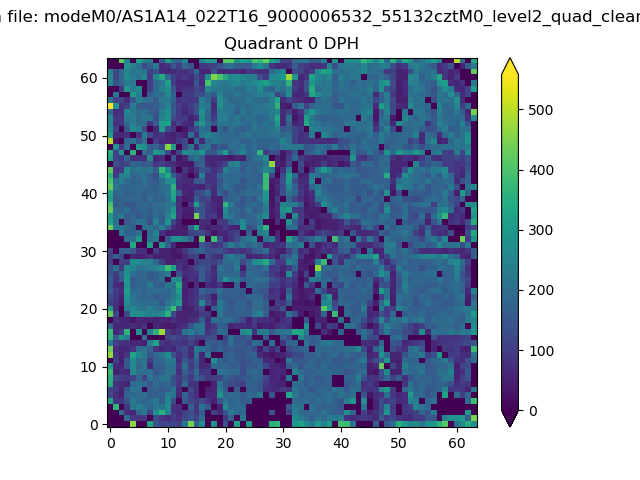 |
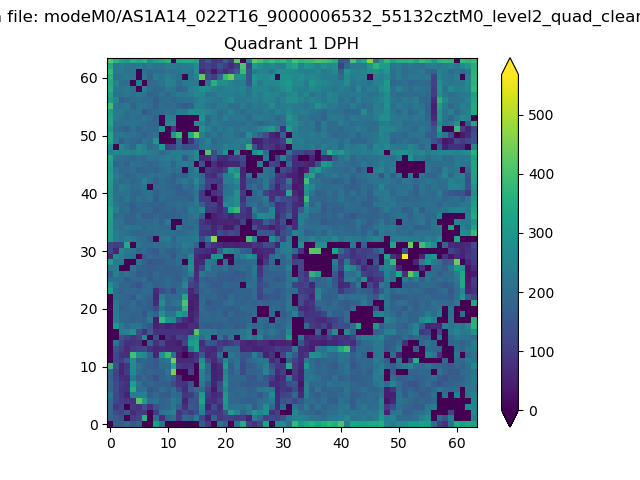 |
Quadrant B |
|---|---|---|---|
| Quadrant D | 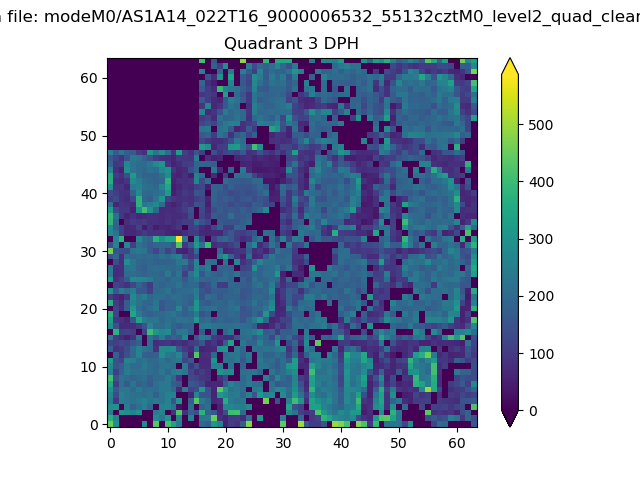 |
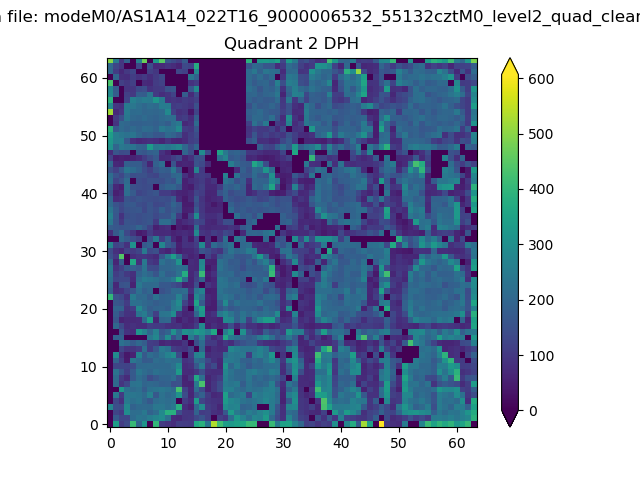 |
Quadrant C |
| Plot type | Count rate plots | Images |
|---|---|---|
| Comparison with Poisson distribution Blue bars denote a histogram of data divided into 1 sec bins. Red curve is a Poisson curve with rate = median count rate of data. |
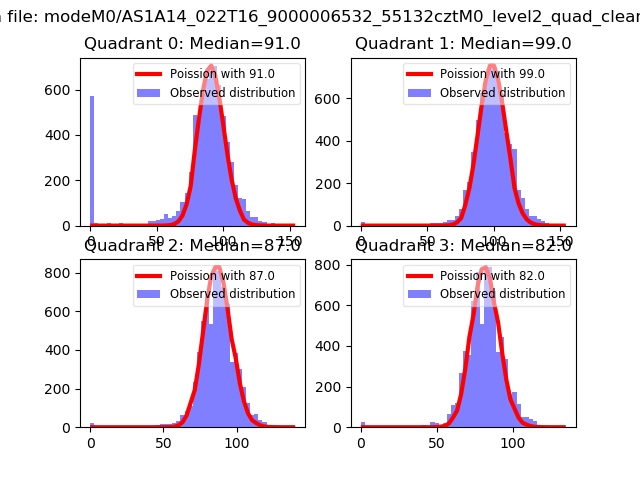 |
 |
| Quadrant-wise count rates Data is divided into 100 sec bins |
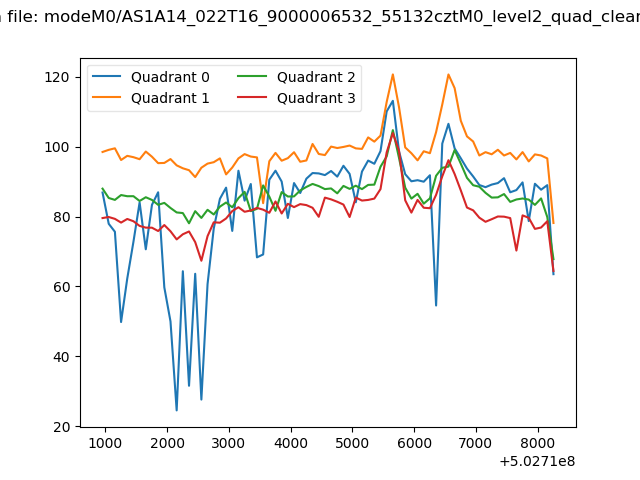 |
|
| Module-wise count rates for Quadrant A Data is divided into 100 sec bins |
 |
 |
| Module-wise count rates for Quadrant B Data is divided into 100 sec bins |
 |
 |
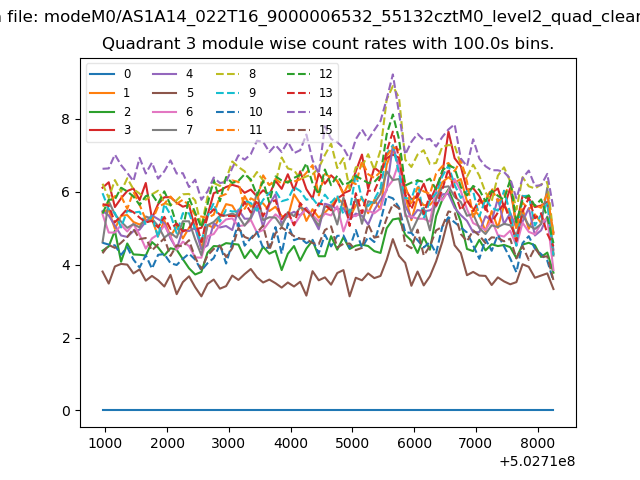
| Module-wise count rates for Quadrant C Data is divided into 100 sec bins |
 |
 |
| Module-wise count rates for Quadrant D Data is divided into 100 sec bins |
 |
 |
| Parameter | Plot |
|---|---|
| CZT HV Monitor | 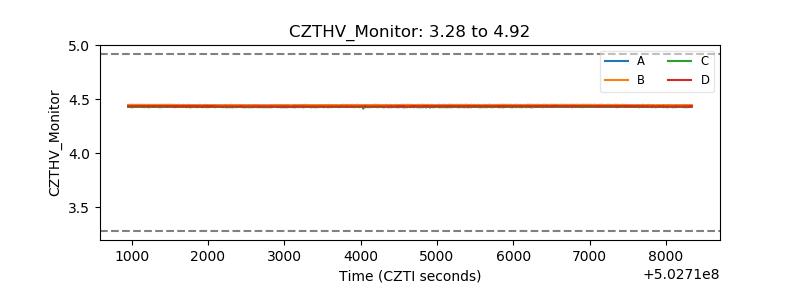 |
| D_VDD | 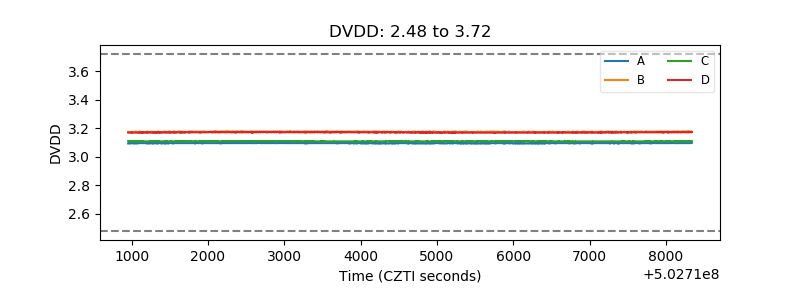 |
| Temperature 1 | 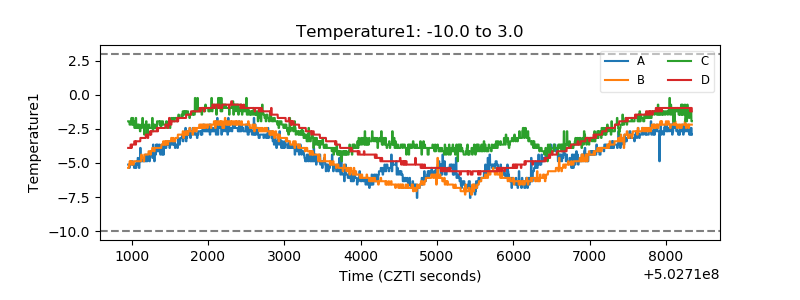 |
| Veto HV Monitor |  |
| Veto LLD |  |
| Alpha Counter | 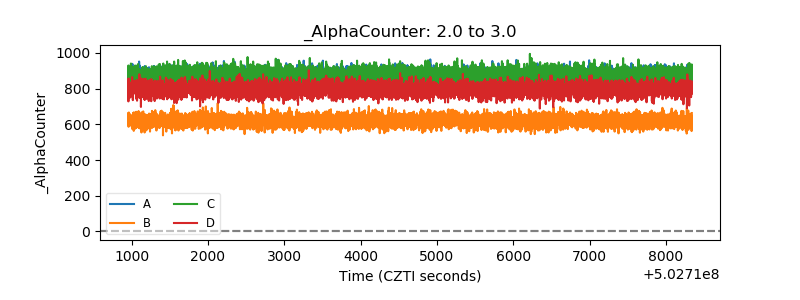 |
| _CPM_Rate | 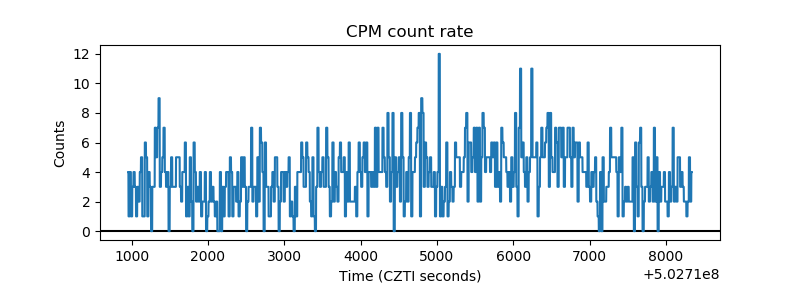 |
| CZT Counter | 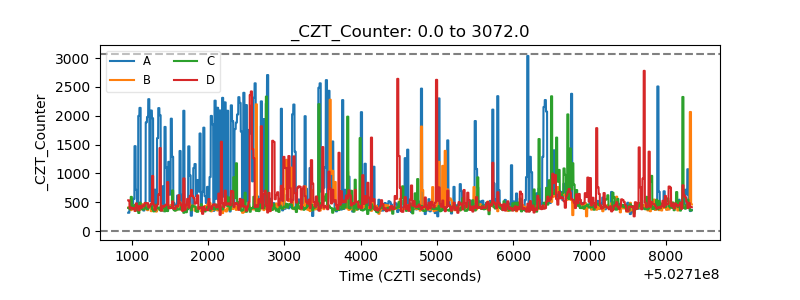 |
| +2.5 Volts monitor |  |
| +5 Volts monitor | 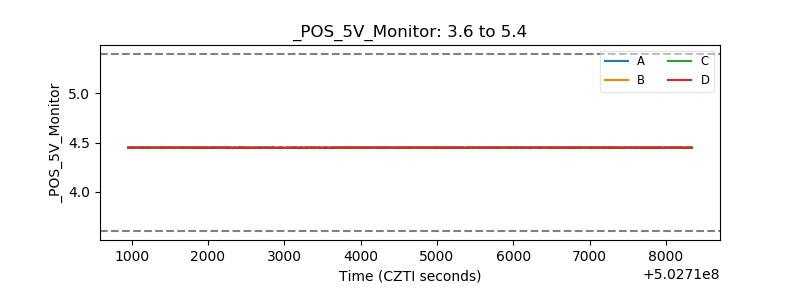 |
| _ROLL_ROT | 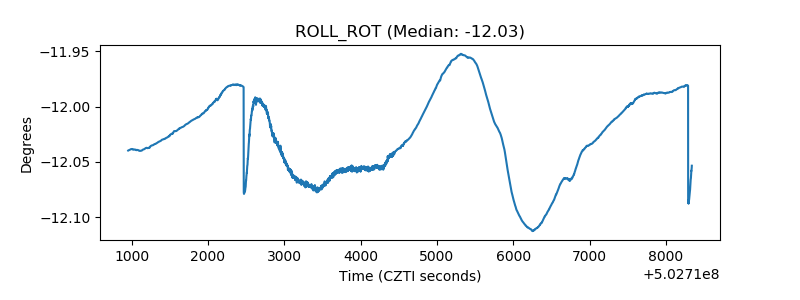 |
| _Roll_DEC | 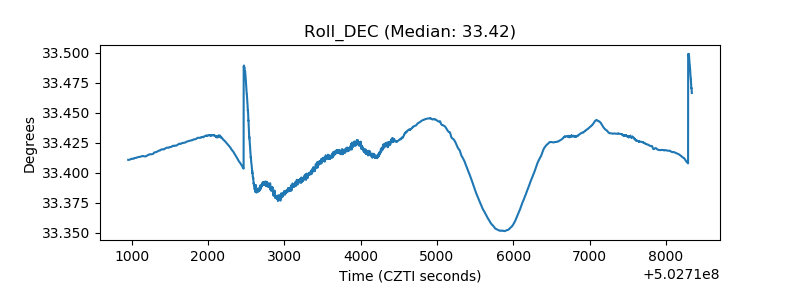 |
| _Roll_RA | 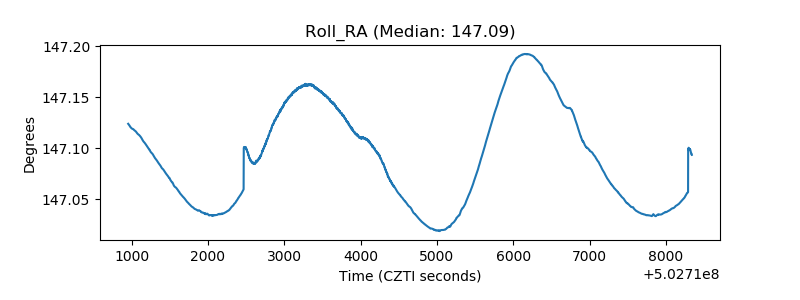 |
| Veto Counter |  |