| Param | Original file | Final file |
|---|---|---|
| Filename | modeM0/AS1A14_022T16_9000006532_55136cztM0_level2.fits | modeM0/AS1A14_022T16_9000006532_55136cztM0_level2_quad_clean.evt |
| Size (bytes) | 465,788,160 | 91,866,240 |
| Size | 444.2 MB | 87.6 MB |
| Events in quadrant A | 3,666,246 | 606,839 |
| Events in quadrant B | 3,692,510 | 630,864 |
| Events in quadrant C | 3,223,556 | 587,926 |
| Events in quadrant D | 6,144,469 | 493,860 |
| Mode SS | |||
|---|---|---|---|
| Quadrant | BADHDUFLAG | Total packets | Discarded packets |
| A | 0 | 136 | 0 |
| B | 0 | 136 | 0 |
| C | 0 | 136 | 0 |
| D | 0 | 136 | 0 |
| Mode M0 | |||
|---|---|---|---|
| Quadrant | BADHDUFLAG | Total packets | Discarded packets |
| A | 0 | 15772 | 22 |
| B | 0 | 15876 | 11 |
| C | 0 | 14498 | 11 |
| D | 0 | 23046 | 22 |
| Mode M9 | |||
|---|---|---|---|
| Quadrant | BADHDUFLAG | Total packets | Discarded packets |
| A | 0 | 8 | 0 |
| B | 0 | 8 | 0 |
| C | 0 | 8 | 0 |
| D | 0 | 8 | 0 |
| Quadrant | Total seconds | Saturated seconds | Saturation percentage |
|---|---|---|---|
| A | 6620 | 220 | 3.323263% |
| B | 6625 | 349 | 5.267925% |
| C | 6624 | 62 | 0.935990% |
| D | 6621 | 896 | 13.532699% |
Noise dominated data is calculated using 1-second bins in cleaned event files. If a bin has >2000 counts, and if more than 50% of those come from <1% of pixels, then it is considered to be noise-dominated and hence unusable.
| Quadrant | # 1 sec bins | Bins with >0 counts | Bins with >2000 counts | High rate bins dominated by noise | Noise dominated (total time) | Noise dominated (detector-on time) | Marked lightcurve |
|---|---|---|---|---|---|---|---|
| A | 7500 | 6627 | 167 | 167 | 2.23% | 2.52% | 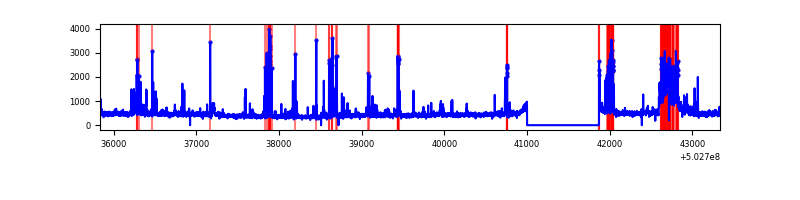 |
| B | 7501 | 6629 | 295 | 295 | 3.93% | 4.45% | 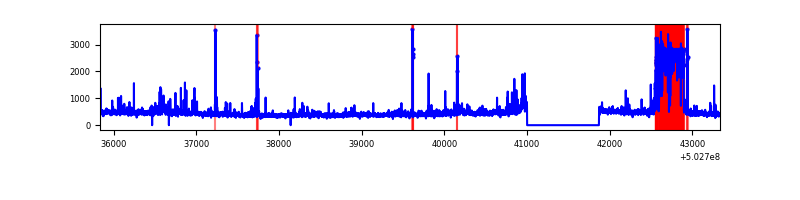 |
| C | 7501 | 6630 | 35 | 35 | 0.47% | 0.53% |  |
| D | 7499 | 6625 | 825 | 825 | 11.00% | 12.45% | 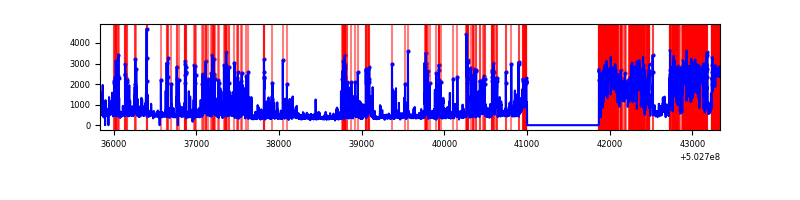 |
Top three noisy pixels from each quadrant. If the there are fewer than three noisy pixels in the level2.evt file, extra rows are filled as -1
| Pixel properties | Quadrant properties | ||||||
|---|---|---|---|---|---|---|---|
| Quadrant | DetID | PixID | Counts | Sigma | Mean | Median | Sigma |
| A | 0 | 8 | 407603 | 2360.96 | 691 | 672 | 172.4 |
| A | 12 | 115 | 382436 | 2214.94 | 691 | 672 | 172.4 |
| A | 15 | 32 | 108734 | 626.96 | 691 | 672 | 172.4 |
| B | 2 | 249 | 782799 | 5407.99 | 668 | 642 | 144.6 |
| B | 4 | 21 | 107282 | 737.33 | 668 | 642 | 144.6 |
| B | 10 | 247 | 64761 | 443.33 | 668 | 642 | 144.6 |
| C | 6 | 223 | 148367 | 796.77 | 678 | 673 | 185.4 |
| C | 14 | 254 | 105435 | 565.16 | 678 | 673 | 185.4 |
| C | 9 | 38 | 81898 | 438.19 | 678 | 673 | 185.4 |
| D | 11 | 129 | 2918672 | 16189.3 | 636 | 610 | 180.2 |
| D | 8 | 245 | 248898 | 1377.49 | 636 | 610 | 180.2 |
| D | 11 | 176 | 109058 | 601.67 | 636 | 610 | 180.2 |
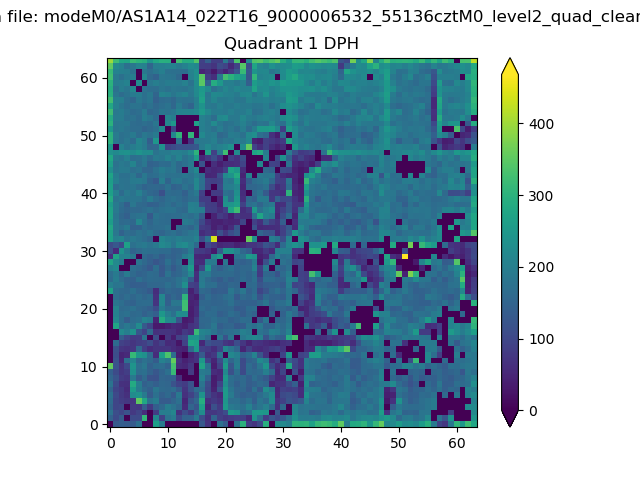
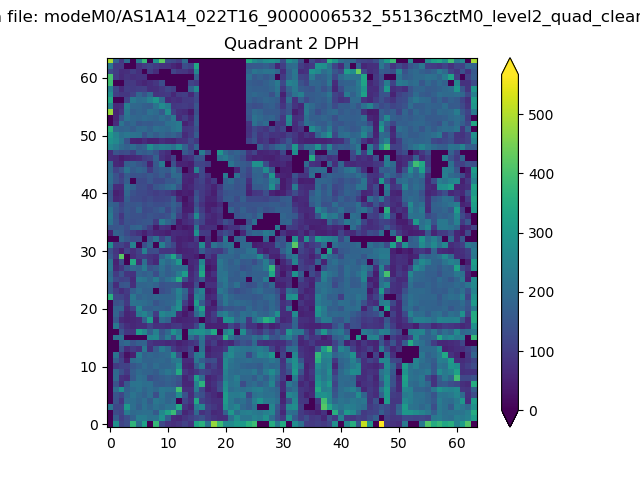
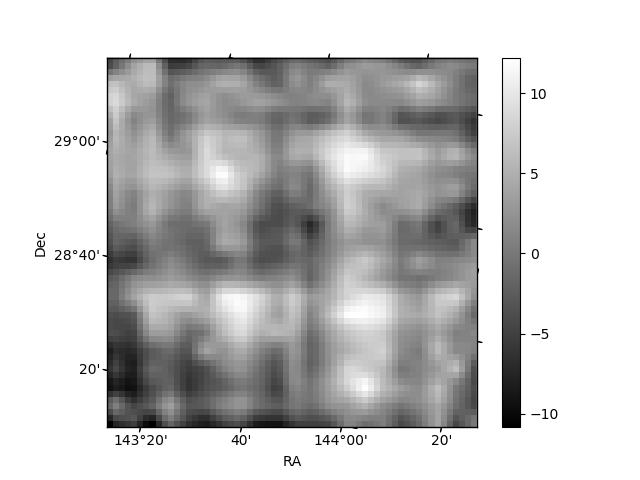
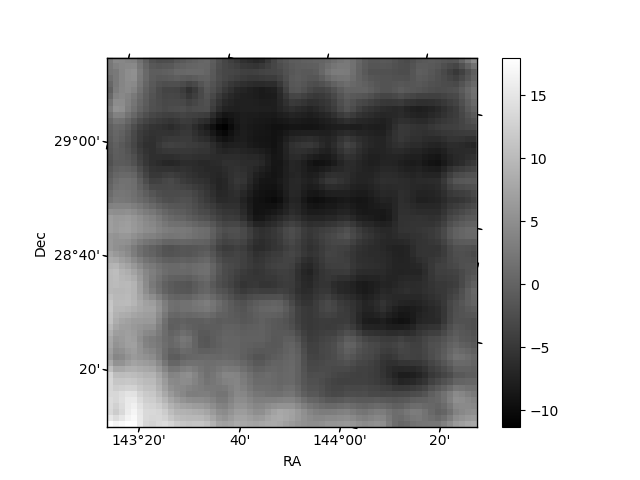
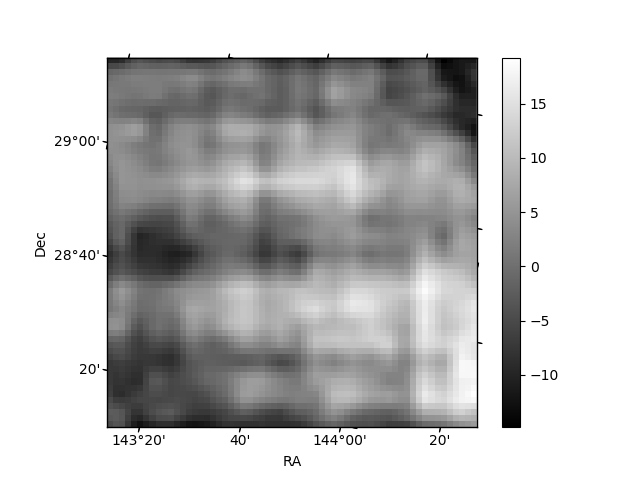
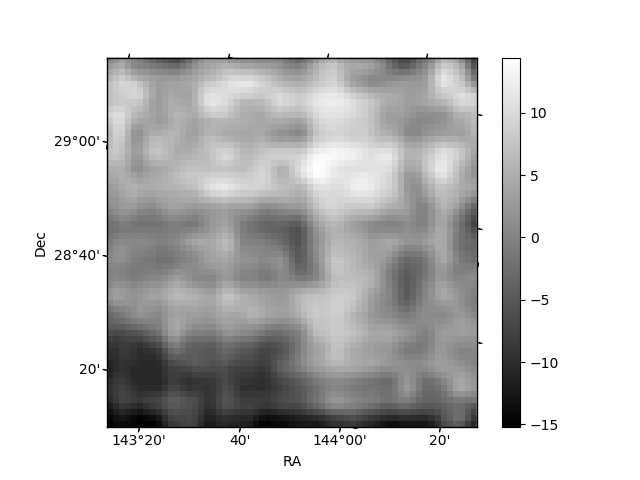
Histogram calculated using DETX and DETY for each event in the final _common_clean file
| Quadrant A | 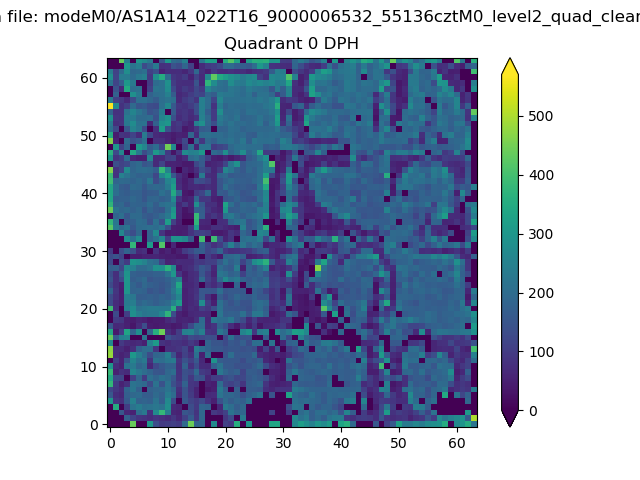 |
 |
Quadrant B |
|---|---|---|---|
| Quadrant D | 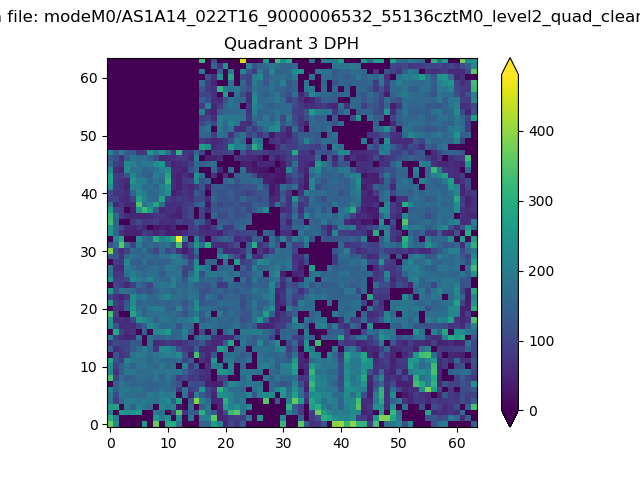 |
 |
Quadrant C |
| Plot type | Count rate plots | Images |
|---|---|---|
| Comparison with Poisson distribution Blue bars denote a histogram of data divided into 1 sec bins. Red curve is a Poisson curve with rate = median count rate of data. |
 |
 |
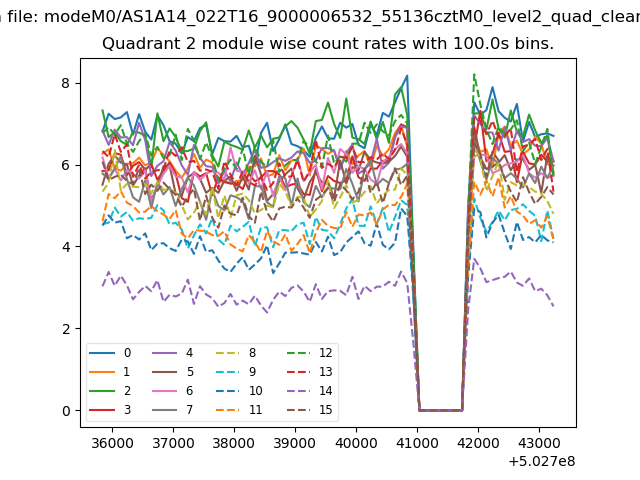
| Quadrant-wise count rates Data is divided into 100 sec bins |
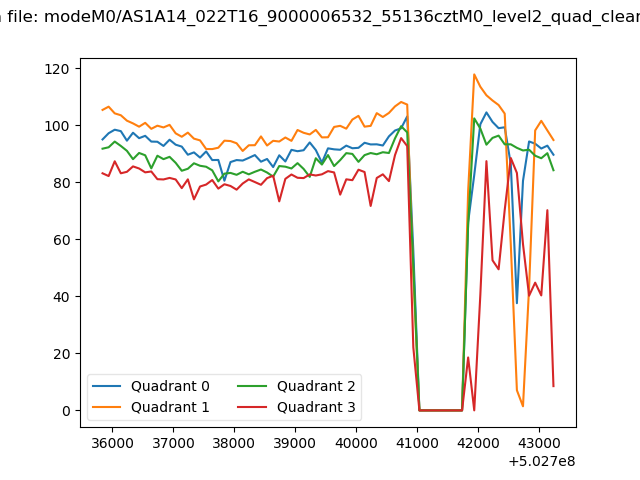 |
|
| Module-wise count rates for Quadrant A Data is divided into 100 sec bins |
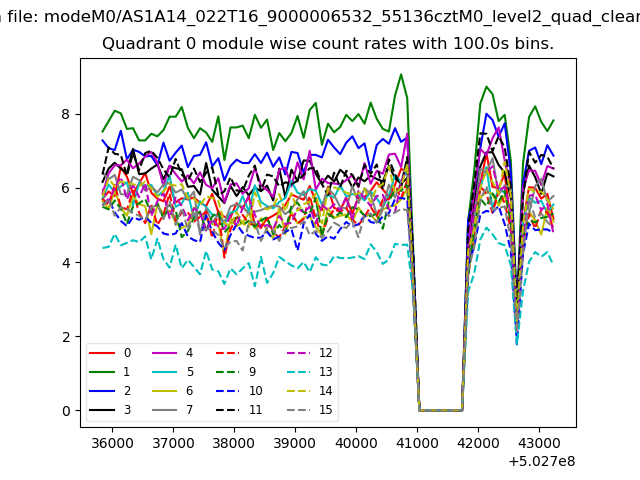 |
 |
| Module-wise count rates for Quadrant B Data is divided into 100 sec bins |
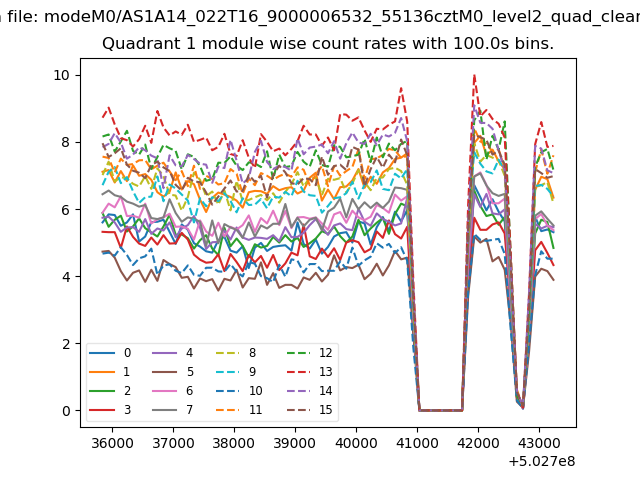 |
 |
| Module-wise count rates for Quadrant C Data is divided into 100 sec bins |
 |
 |
| Module-wise count rates for Quadrant D Data is divided into 100 sec bins |
 |
 |
| Parameter | Plot |
|---|---|
| CZT HV Monitor |  |
| D_VDD | 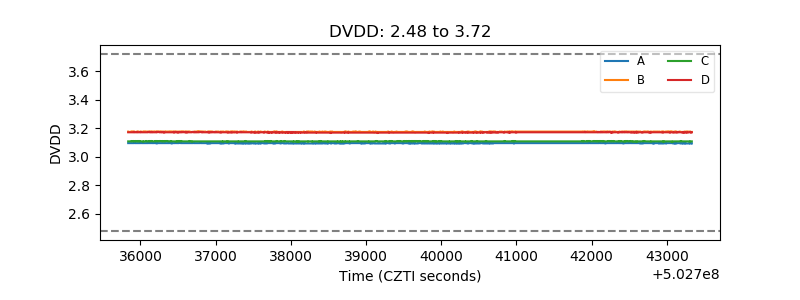 |
| Temperature 1 | 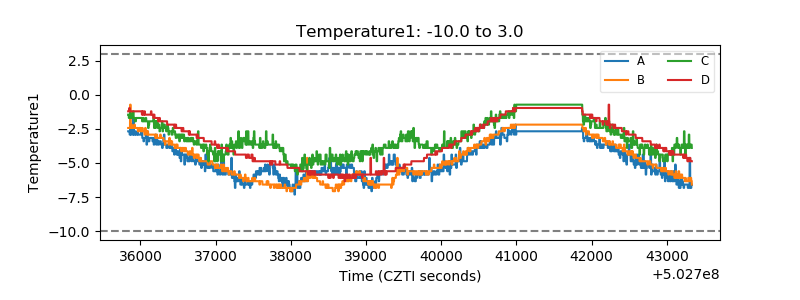 |
| Veto HV Monitor | 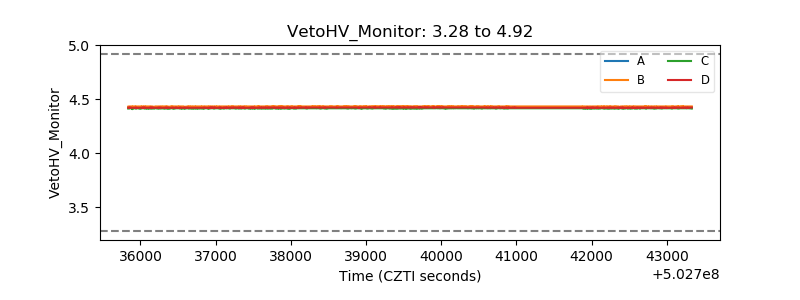 |
| Veto LLD | 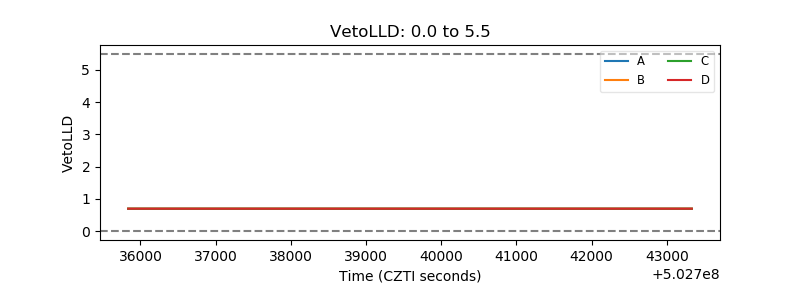 |
| Alpha Counter | 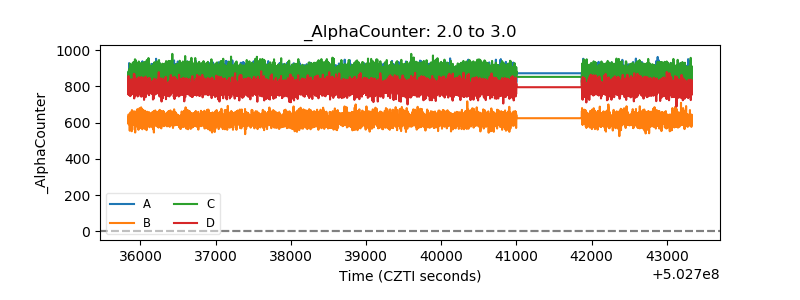 |
| _CPM_Rate | 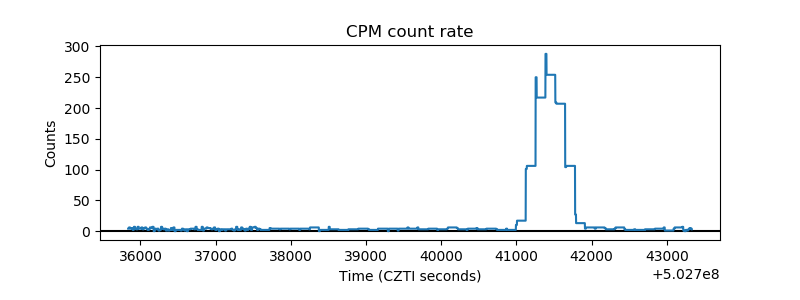 |
| CZT Counter | 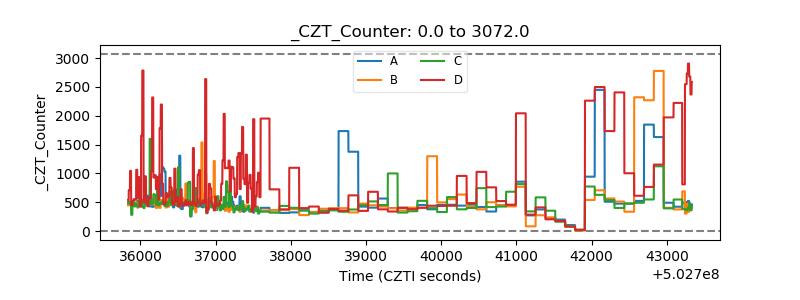 |
| +2.5 Volts monitor | 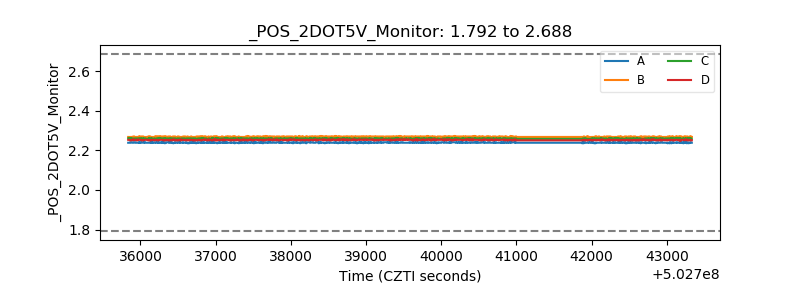 |
| +5 Volts monitor |  |
| _ROLL_ROT | 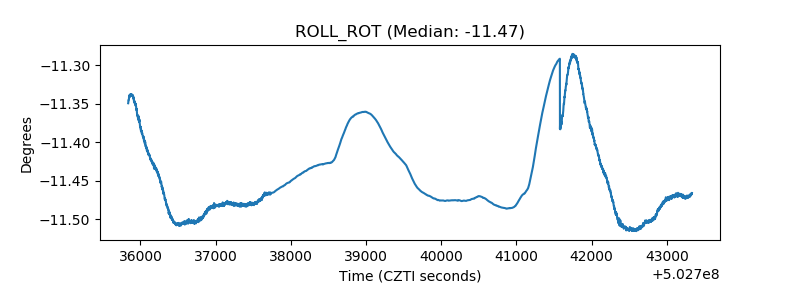 |
| _Roll_DEC | 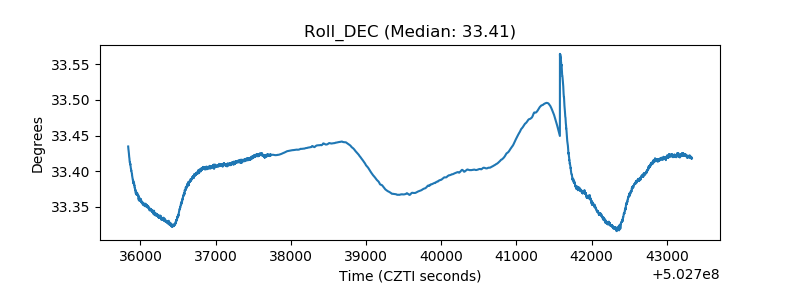 |
| _Roll_RA | 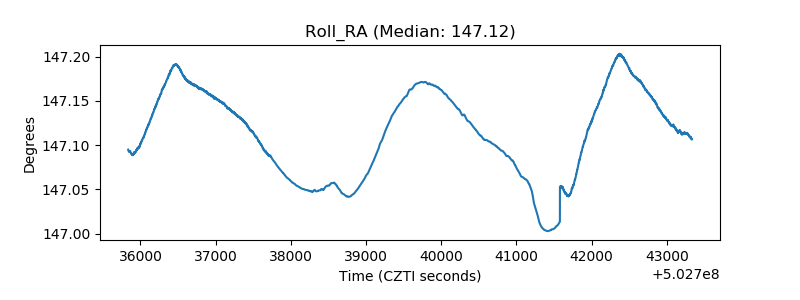 |
| Veto Counter | 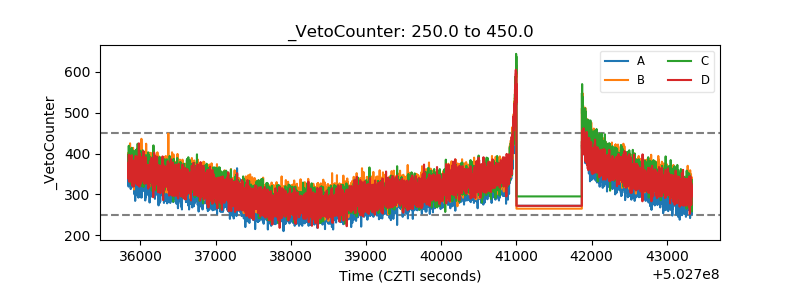 |