| Param | Original file | Final file |
|---|---|---|
| Filename | modeM0/AS1A14_022T16_9000006532_55138cztM0_level2.fits | modeM0/AS1A14_022T16_9000006532_55138cztM0_level2_quad_clean.evt |
| Size (bytes) | 514,543,680 | 84,695,040 |
| Size | 490.7 MB | 80.8 MB |
| Events in quadrant A | 3,664,904 | 571,679 |
| Events in quadrant B | 3,502,716 | 599,408 |
| Events in quadrant C | 3,047,660 | 560,432 |
| Events in quadrant D | 8,344,418 | 395,970 |
| Mode SS | |||
|---|---|---|---|
| Quadrant | BADHDUFLAG | Total packets | Discarded packets |
| A | 0 | 126 | 0 |
| B | 0 | 126 | 0 |
| C | 0 | 126 | 0 |
| D | 0 | 126 | 0 |
| Mode M0 | |||
|---|---|---|---|
| Quadrant | BADHDUFLAG | Total packets | Discarded packets |
| A | 0 | 15439 | 1 |
| B | 0 | 15143 | 2 |
| C | 0 | 13882 | 5 |
| D | 0 | 29239 | 1 |
| Mode M9 | |||
|---|---|---|---|
| Quadrant | BADHDUFLAG | Total packets | Discarded packets |
| A | 0 | 10 | 0 |
| B | 0 | 10 | 0 |
| C | 0 | 10 | 0 |
| D | 0 | 10 | 0 |
| Quadrant | Total seconds | Saturated seconds | Saturation percentage |
|---|---|---|---|
| A | 6266 | 254 | 4.053623% |
| B | 6265 | 362 | 5.778132% |
| C | 6263 | 59 | 0.942041% |
| D | 6266 | 1754 | 27.992340% |
Noise dominated data is calculated using 1-second bins in cleaned event files. If a bin has >2000 counts, and if more than 50% of those come from <1% of pixels, then it is considered to be noise-dominated and hence unusable.
| Quadrant | # 1 sec bins | Bins with >0 counts | Bins with >2000 counts | High rate bins dominated by noise | Noise dominated (total time) | Noise dominated (detector-on time) | Marked lightcurve |
|---|---|---|---|---|---|---|---|
| A | 7276 | 6267 | 204 | 204 | 2.80% | 3.26% | 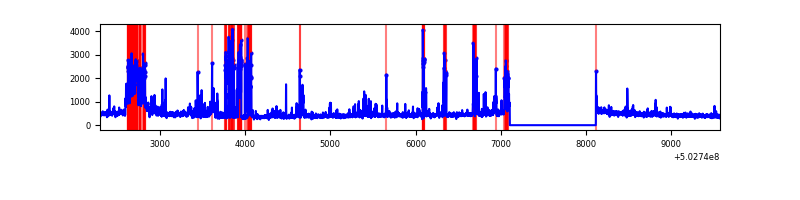 |
| B | 7276 | 6267 | 304 | 304 | 4.18% | 4.85% | 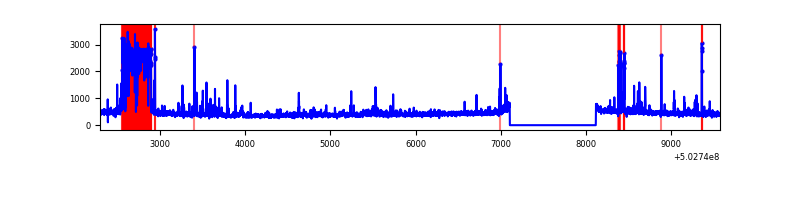 |
| C | 7276 | 6266 | 35 | 35 | 0.48% | 0.56% | 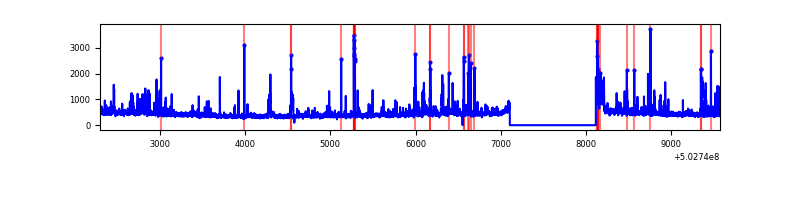 |
| D | 7276 | 6267 | 1747 | 1747 | 24.01% | 27.88% | 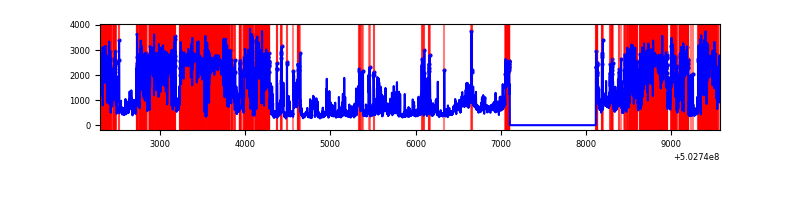 |
Top three noisy pixels from each quadrant. If the there are fewer than three noisy pixels in the level2.evt file, extra rows are filled as -1
| Pixel properties | Quadrant properties | ||||||
|---|---|---|---|---|---|---|---|
| Quadrant | DetID | PixID | Counts | Sigma | Mean | Median | Sigma |
| A | 0 | 8 | 406187 | 2543.21 | 642 | 626 | 159.5 |
| A | 12 | 115 | 390375 | 2444.05 | 642 | 626 | 159.5 |
| A | 15 | 32 | 312569 | 1956.14 | 642 | 626 | 159.5 |
| B | 2 | 249 | 764398 | 5619.49 | 625 | 601 | 135.9 |
| B | 10 | 247 | 87618 | 640.21 | 625 | 601 | 135.9 |
| B | 0 | 182 | 58993 | 429.61 | 625 | 601 | 135.9 |
| C | 6 | 223 | 118928 | 676.77 | 634 | 628 | 174.8 |
| C | 14 | 254 | 100805 | 573.09 | 634 | 628 | 174.8 |
| C | 13 | 3 | 93478 | 531.18 | 634 | 628 | 174.8 |
| D | 11 | 129 | 5440042 | 34615.29 | 548 | 524 | 157.1 |
| D | 8 | 245 | 295251 | 1875.55 | 548 | 524 | 157.1 |
| D | 3 | 12 | 174069 | 1104.38 | 548 | 524 | 157.1 |
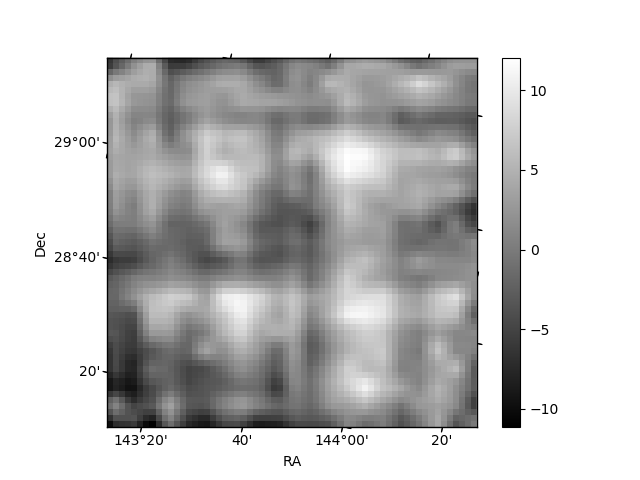
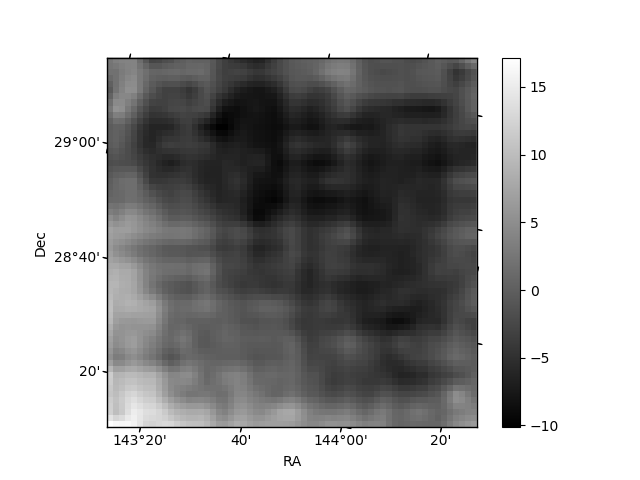
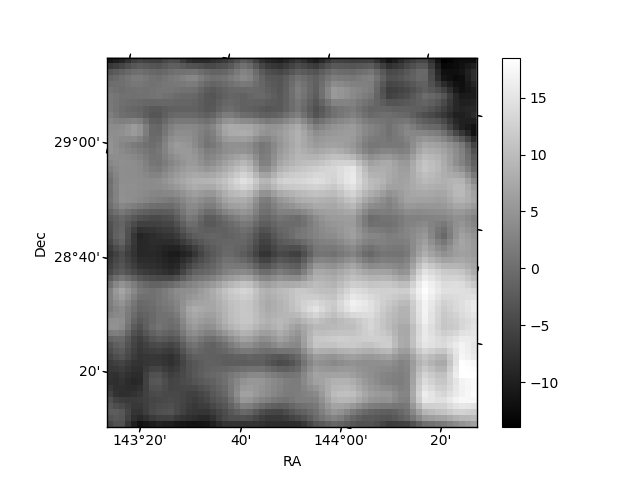
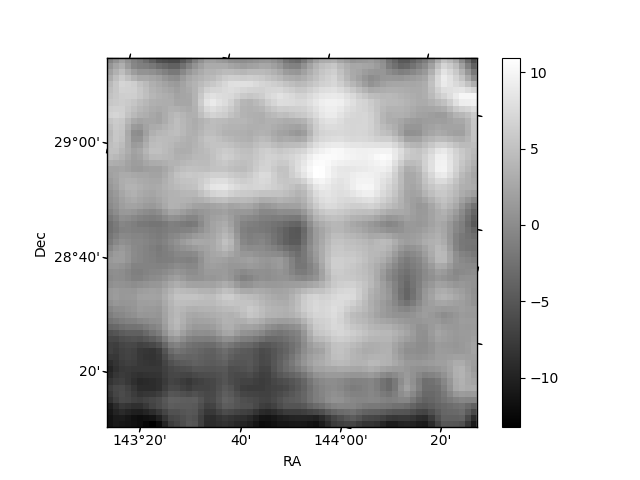
Histogram calculated using DETX and DETY for each event in the final _common_clean file
| Quadrant A | 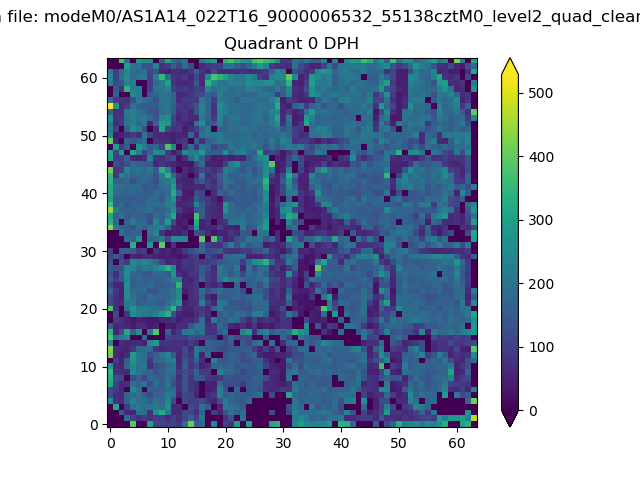 |
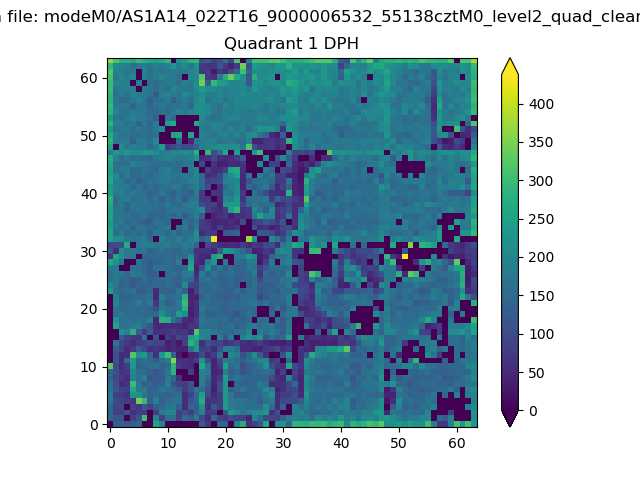 |
Quadrant B |
|---|---|---|---|
| Quadrant D |  |
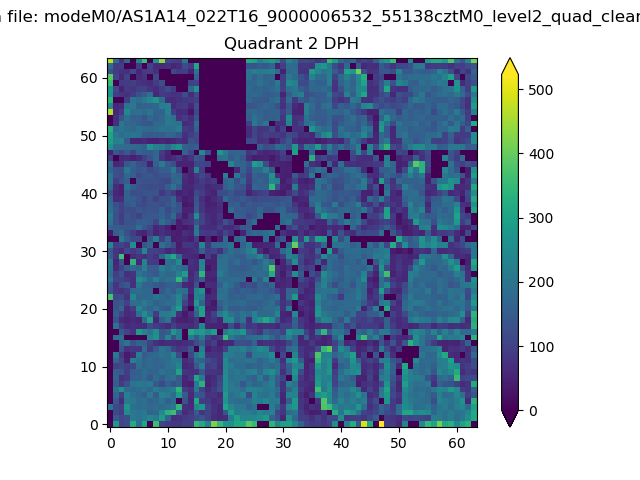 |
Quadrant C |
| Plot type | Count rate plots | Images |
|---|---|---|
| Comparison with Poisson distribution Blue bars denote a histogram of data divided into 1 sec bins. Red curve is a Poisson curve with rate = median count rate of data. |
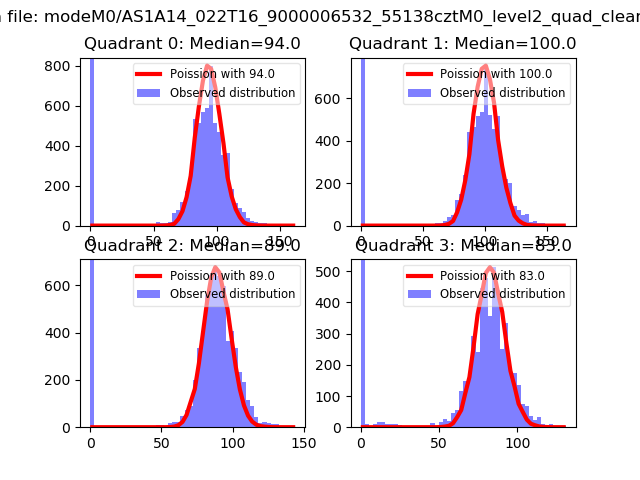 |
 |
| Quadrant-wise count rates Data is divided into 100 sec bins |
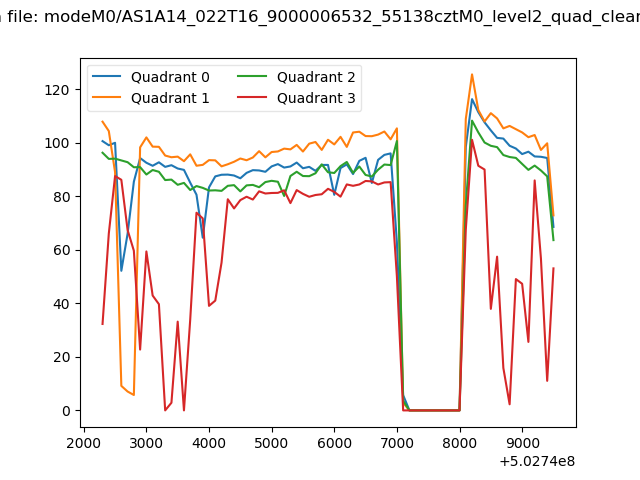 |
|
| Module-wise count rates for Quadrant A Data is divided into 100 sec bins |
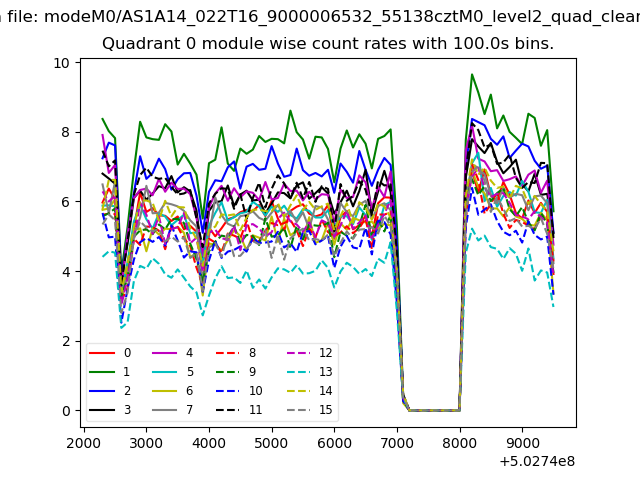 |
 |
| Module-wise count rates for Quadrant B Data is divided into 100 sec bins |
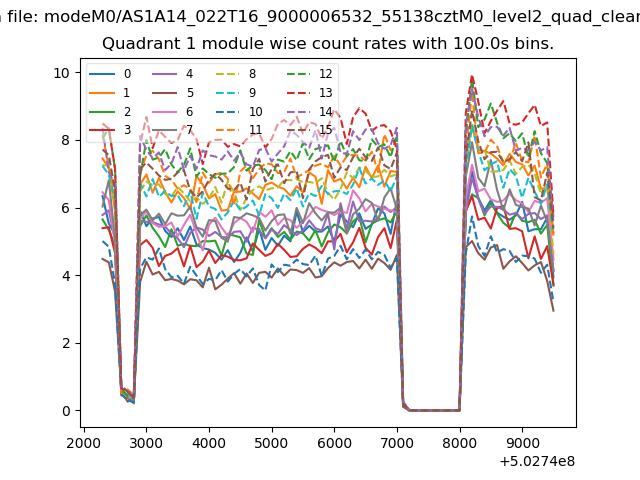 |
 |
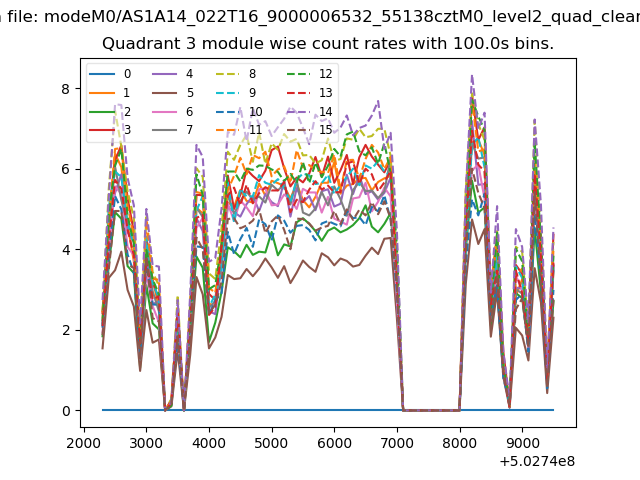
| Module-wise count rates for Quadrant C Data is divided into 100 sec bins |
 |
 |
| Module-wise count rates for Quadrant D Data is divided into 100 sec bins |
 |
 |
| Parameter | Plot |
|---|---|
| CZT HV Monitor |  |
| D_VDD | 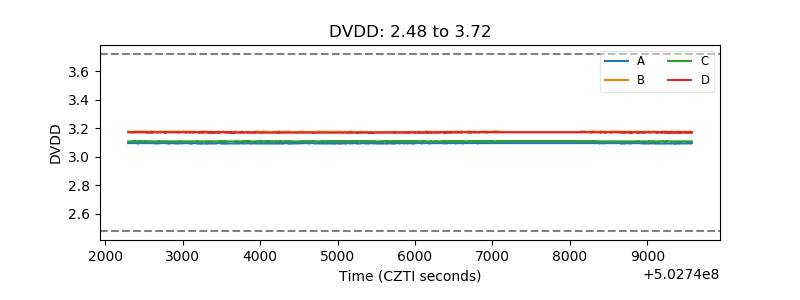 |
| Temperature 1 | 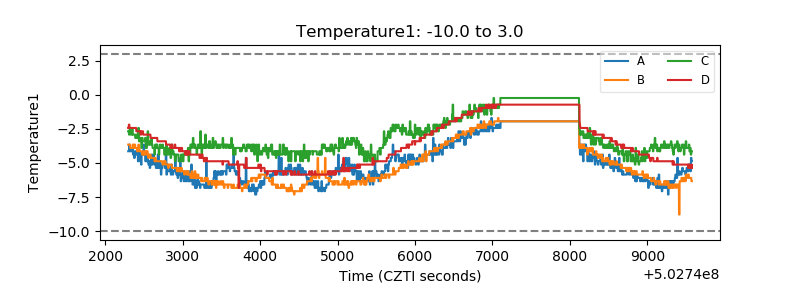 |
| Veto HV Monitor | 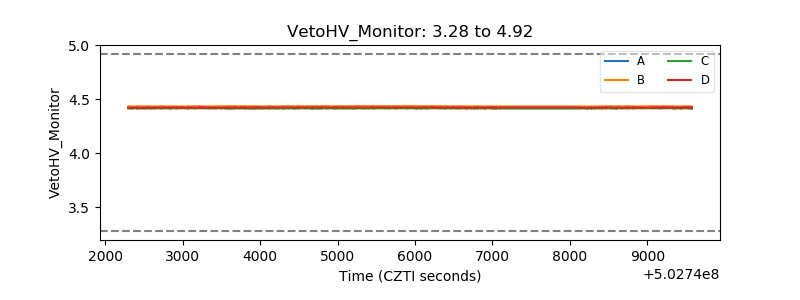 |
| Veto LLD | 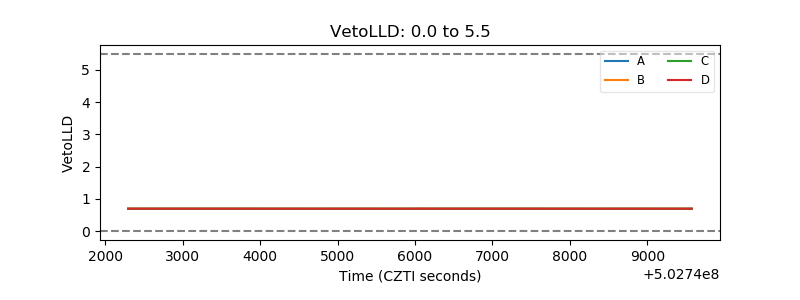 |
| Alpha Counter | 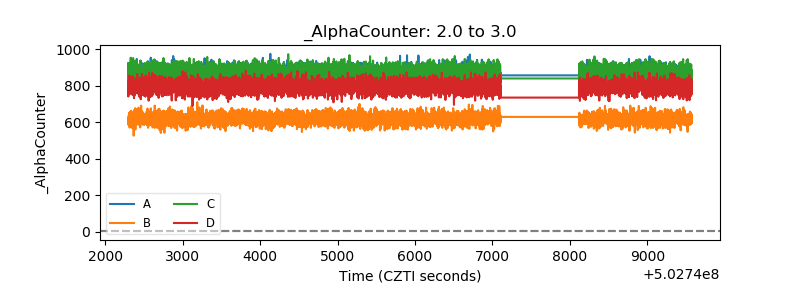 |
| _CPM_Rate | 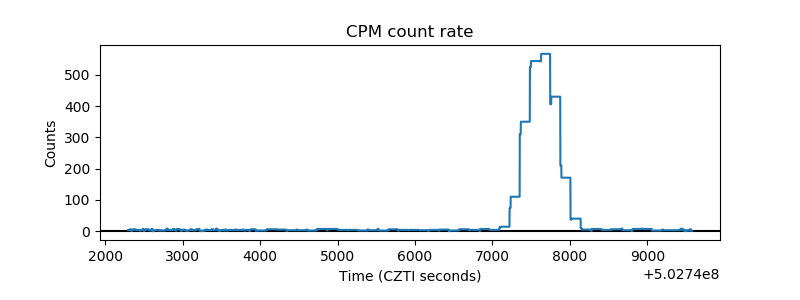 |
| CZT Counter | 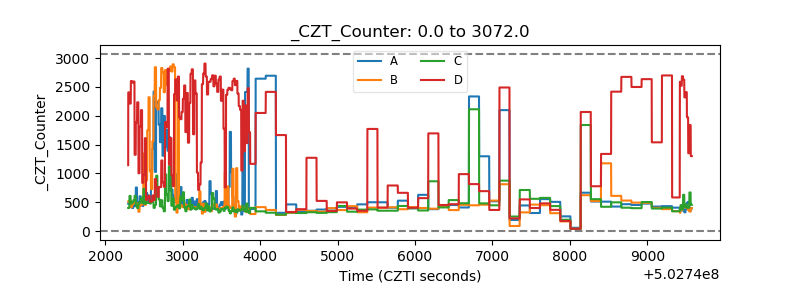 |
| +2.5 Volts monitor |  |
| +5 Volts monitor | 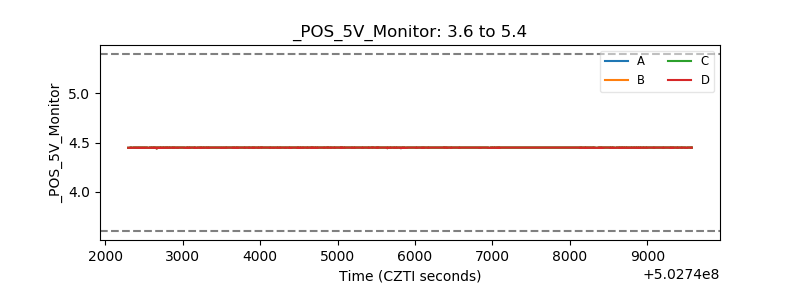 |
| _ROLL_ROT | 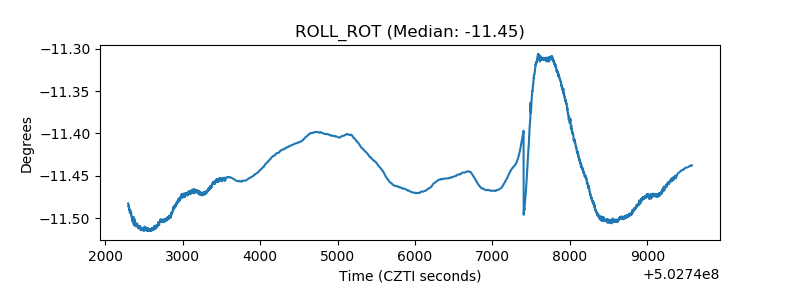 |
| _Roll_DEC | 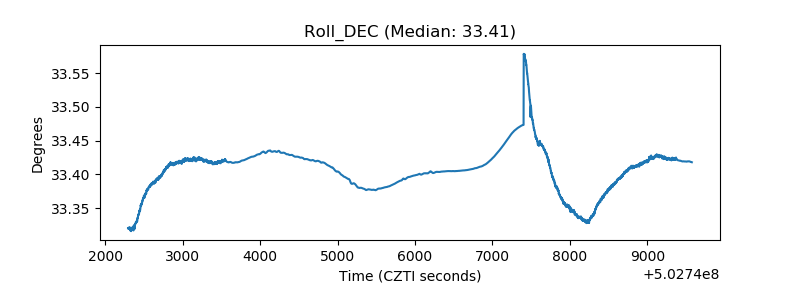 |
| _Roll_RA |  |
| Veto Counter | 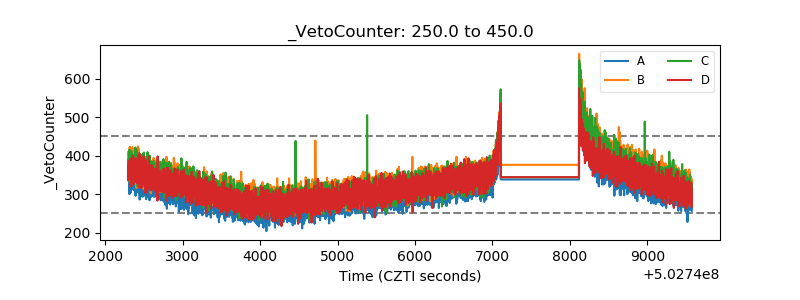 |