| Param | Original file | Final file |
|---|---|---|
| Filename | modeM0/AS1A14_022T16_9000006532_55140cztM0_level2.fits | modeM0/AS1A14_022T16_9000006532_55140cztM0_level2_quad_clean.evt |
| Size (bytes) | 451,356,480 | 93,496,320 |
| Size | 430.4 MB | 89.2 MB |
| Events in quadrant A | 3,857,704 | 616,447 |
| Events in quadrant B | 2,949,720 | 683,425 |
| Events in quadrant C | 2,995,502 | 598,422 |
| Events in quadrant D | 6,405,592 | 484,631 |
| Mode SS | |||
|---|---|---|---|
| Quadrant | BADHDUFLAG | Total packets | Discarded packets |
| A | 0 | 134 | 0 |
| B | 0 | 134 | 0 |
| C | 0 | 134 | 0 |
| D | 0 | 134 | 0 |
| Mode M0 | |||
|---|---|---|---|
| Quadrant | BADHDUFLAG | Total packets | Discarded packets |
| A | 0 | 16052 | 3 |
| B | 0 | 13620 | 2 |
| C | 0 | 13804 | 2 |
| D | 0 | 23641 | 2 |
| Mode M9 | |||
|---|---|---|---|
| Quadrant | BADHDUFLAG | Total packets | Discarded packets |
| A | 0 | 22 | 0 |
| B | 0 | 22 | 0 |
| C | 0 | 22 | 0 |
| D | 0 | 22 | 0 |
| Quadrant | Total seconds | Saturated seconds | Saturation percentage |
|---|---|---|---|
| A | 6420 | 210 | 3.271028% |
| B | 6421 | 69 | 1.074599% |
| C | 6422 | 59 | 0.918717% |
| D | 6422 | 1009 | 15.711616% |
Noise dominated data is calculated using 1-second bins in cleaned event files. If a bin has >2000 counts, and if more than 50% of those come from <1% of pixels, then it is considered to be noise-dominated and hence unusable.
| Quadrant | # 1 sec bins | Bins with >0 counts | Bins with >2000 counts | High rate bins dominated by noise | Noise dominated (total time) | Noise dominated (detector-on time) | Marked lightcurve |
|---|---|---|---|---|---|---|---|
| A | 8671 | 6423 | 176 | 176 | 2.03% | 2.74% | 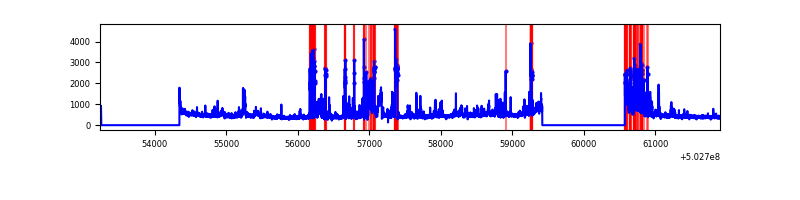 |
| B | 8671 | 6423 | 12 | 12 | 0.14% | 0.19% | 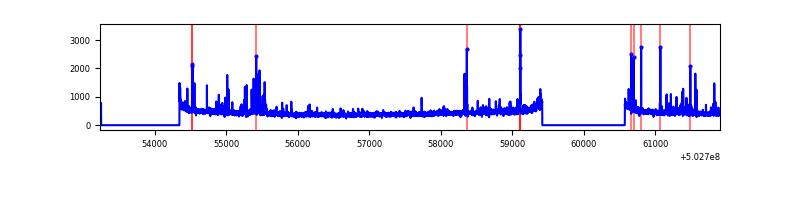 |
| C | 8672 | 6424 | 33 | 33 | 0.38% | 0.51% | 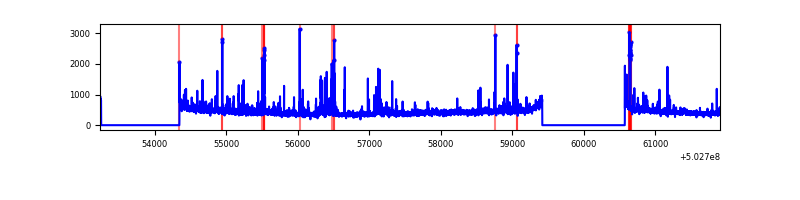 |
| D | 8672 | 6423 | 953 | 953 | 10.99% | 14.84% | 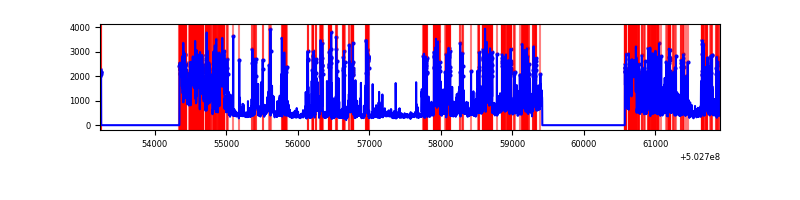 |
Top three noisy pixels from each quadrant. If the there are fewer than three noisy pixels in the level2.evt file, extra rows are filled as -1
| Pixel properties | Quadrant properties | ||||||
|---|---|---|---|---|---|---|---|
| Quadrant | DetID | PixID | Counts | Sigma | Mean | Median | Sigma |
| A | 15 | 32 | 1055333 | 6189.79 | 679 | 663 | 170.4 |
| A | 0 | 8 | 74936 | 435.9 | 679 | 663 | 170.4 |
| A | 12 | 17 | 39903 | 230.3 | 679 | 663 | 170.4 |
| B | 5 | 185 | 97434 | 656.47 | 685 | 662 | 147.4 |
| B | 10 | 247 | 35573 | 236.83 | 685 | 662 | 147.4 |
| B | 4 | 81 | 33404 | 222.11 | 685 | 662 | 147.4 |
| C | 13 | 3 | 91433 | 487.56 | 670 | 666 | 186.2 |
| C | 6 | 223 | 48611 | 257.54 | 670 | 666 | 186.2 |
| C | 14 | 254 | 43389 | 229.49 | 670 | 666 | 186.2 |
| D | 11 | 129 | 3283456 | 19167.61 | 607 | 579 | 171.3 |
| D | 11 | 176 | 451252 | 2631.33 | 607 | 579 | 171.3 |
| D | 7 | 129 | 53939 | 311.55 | 607 | 579 | 171.3 |
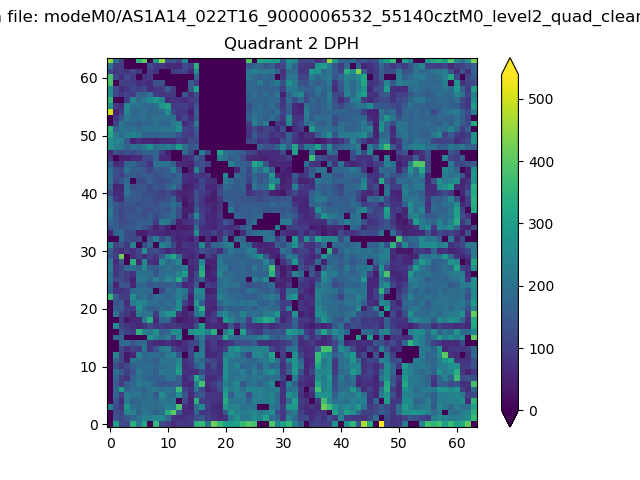
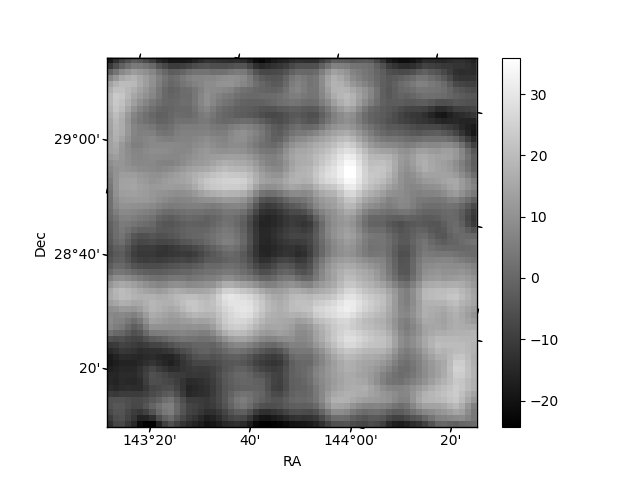
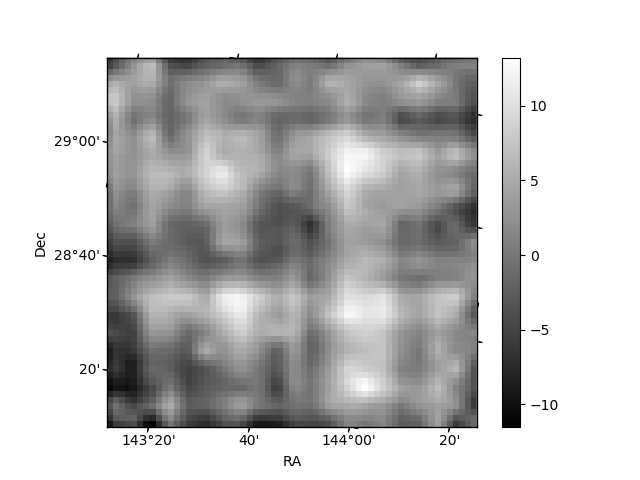
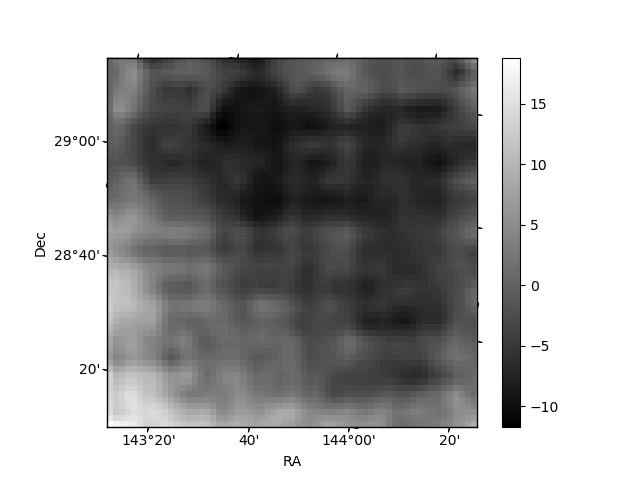
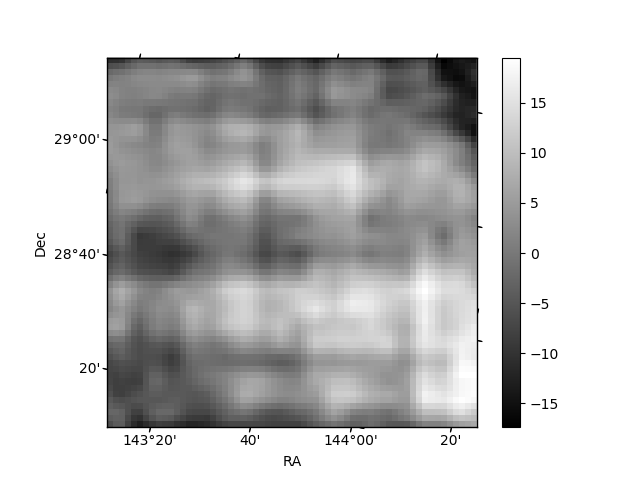
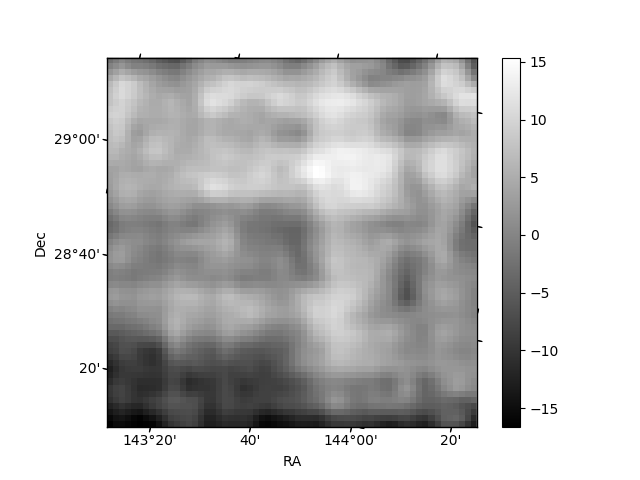
Histogram calculated using DETX and DETY for each event in the final _common_clean file
| Quadrant A | 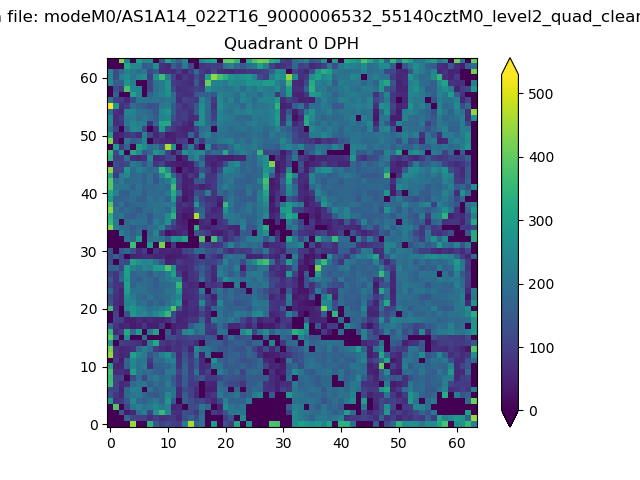 |
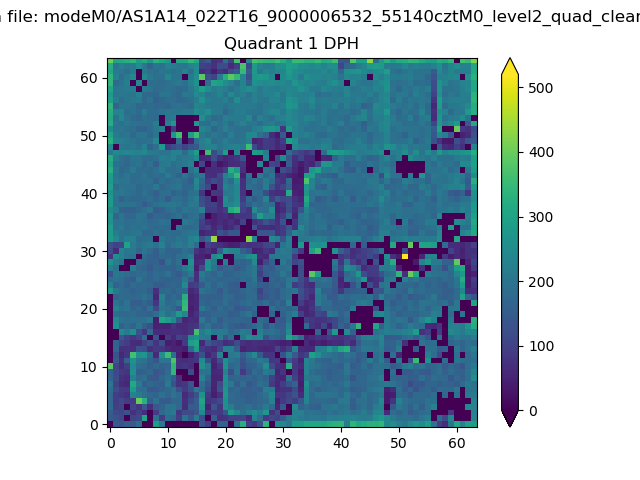 |
Quadrant B |
|---|---|---|---|
| Quadrant D | 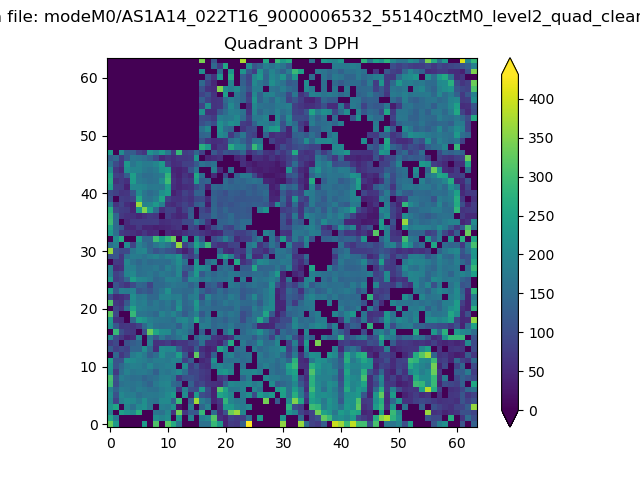 |
 |
Quadrant C |
| Plot type | Count rate plots | Images |
|---|---|---|
| Comparison with Poisson distribution Blue bars denote a histogram of data divided into 1 sec bins. Red curve is a Poisson curve with rate = median count rate of data. |
 |
 |
| Quadrant-wise count rates Data is divided into 100 sec bins |
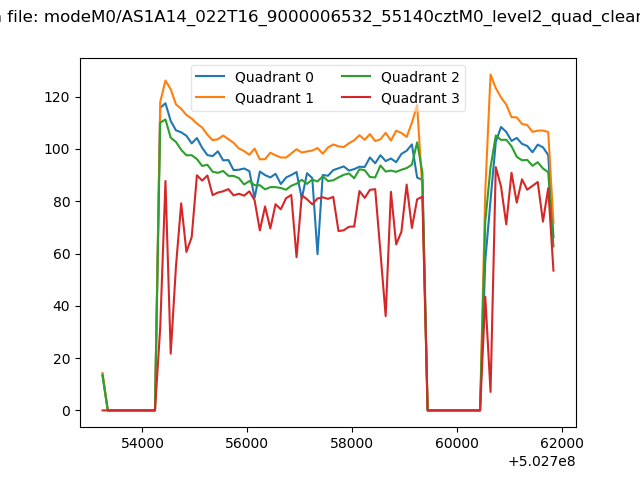 |
|
| Module-wise count rates for Quadrant A Data is divided into 100 sec bins |
 |
 |
| Module-wise count rates for Quadrant B Data is divided into 100 sec bins |
 |
 |
| Module-wise count rates for Quadrant C Data is divided into 100 sec bins |
 |
 |
| Module-wise count rates for Quadrant D Data is divided into 100 sec bins |
 |
 |
| Parameter | Plot |
|---|---|
| CZT HV Monitor |  |
| D_VDD | 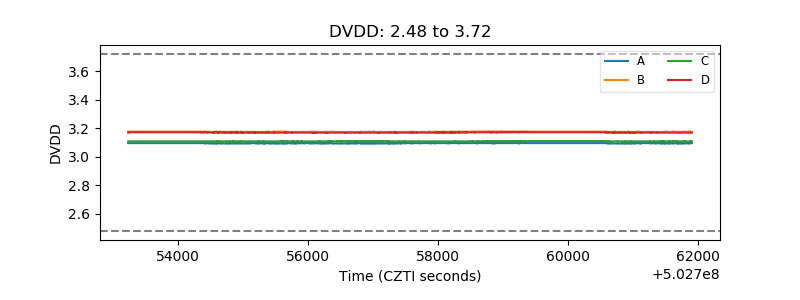 |
| Temperature 1 | 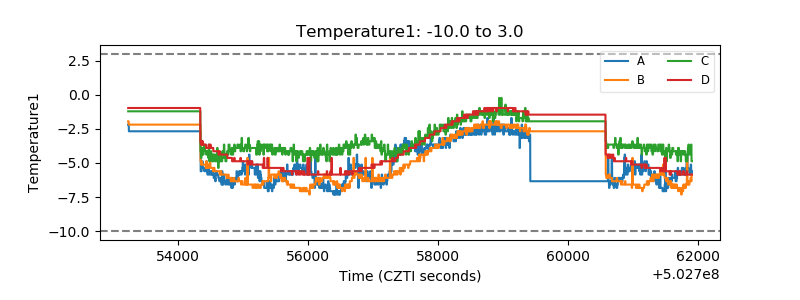 |
| Veto HV Monitor | 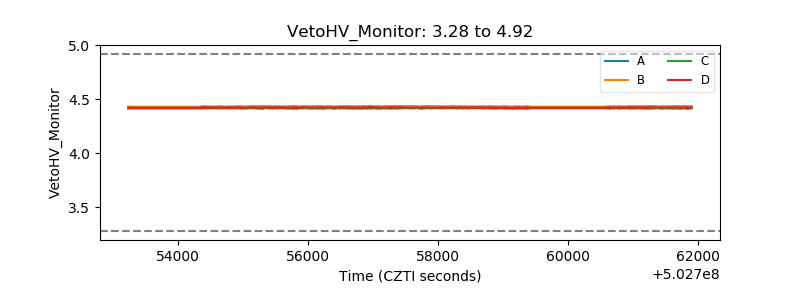 |
| Veto LLD | 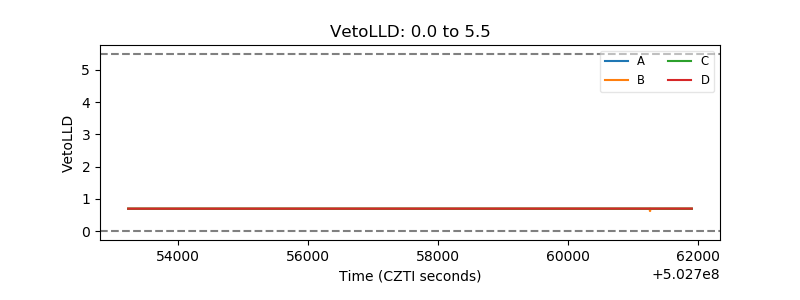 |
| Alpha Counter | 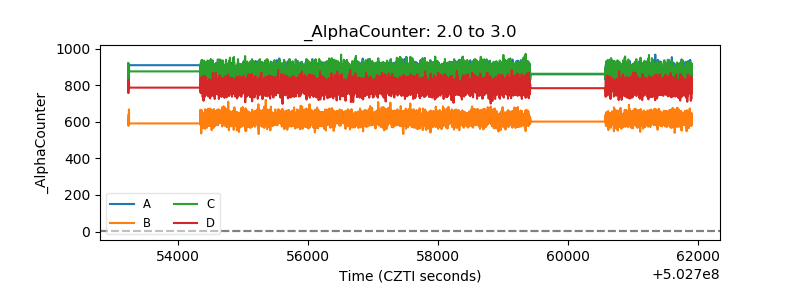 |
| _CPM_Rate | 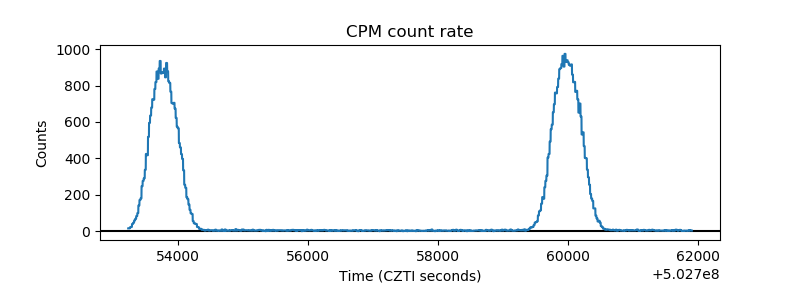 |
| CZT Counter | 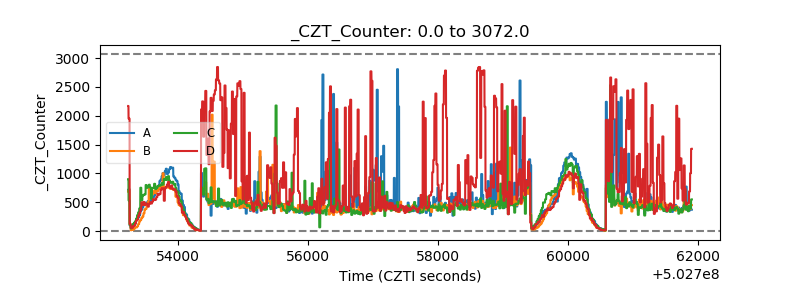 |
| +2.5 Volts monitor |  |
| +5 Volts monitor |  |
| _ROLL_ROT |  |
| _Roll_DEC |  |
| _Roll_RA | 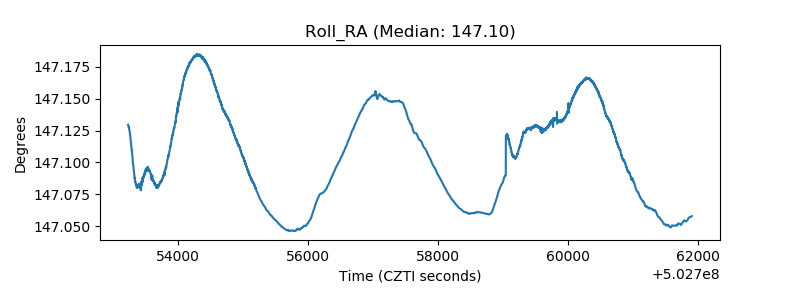 |
| Veto Counter |  |