| Param | Original file | Final file |
|---|---|---|
| Filename | modeM0/AS1A14_022T16_9000006532_55142cztM0_level2.fits | modeM0/AS1A14_022T16_9000006532_55142cztM0_level2_quad_clean.evt |
| Size (bytes) | 510,001,920 | 95,572,800 |
| Size | 486.4 MB | 91.1 MB |
| Events in quadrant A | 3,922,323 | 629,034 |
| Events in quadrant B | 3,047,646 | 713,465 |
| Events in quadrant C | 3,060,902 | 626,538 |
| Events in quadrant D | 8,319,660 | 451,940 |
| Mode SS | |||
|---|---|---|---|
| Quadrant | BADHDUFLAG | Total packets | Discarded packets |
| A | 0 | 136 | 0 |
| B | 0 | 136 | 0 |
| C | 0 | 136 | 0 |
| D | 0 | 136 | 0 |
| Mode M0 | |||
|---|---|---|---|
| Quadrant | BADHDUFLAG | Total packets | Discarded packets |
| A | 0 | 16879 | 2 |
| B | 0 | 14297 | 2 |
| C | 0 | 14435 | 2 |
| D | 0 | 29494 | 2 |
| Mode M9 | |||
|---|---|---|---|
| Quadrant | BADHDUFLAG | Total packets | Discarded packets |
| A | 0 | 20 | 0 |
| B | 0 | 20 | 0 |
| C | 0 | 21 | 0 |
| D | 0 | 21 | 0 |
| Quadrant | Total seconds | Saturated seconds | Saturation percentage |
|---|---|---|---|
| A | 6792 | 363 | 5.344523% |
| B | 6792 | 65 | 0.957008% |
| C | 6792 | 37 | 0.544759% |
| D | 6792 | 1630 | 23.998822% |
Noise dominated data is calculated using 1-second bins in cleaned event files. If a bin has >2000 counts, and if more than 50% of those come from <1% of pixels, then it is considered to be noise-dominated and hence unusable.
| Quadrant | # 1 sec bins | Bins with >0 counts | Bins with >2000 counts | High rate bins dominated by noise | Noise dominated (total time) | Noise dominated (detector-on time) | Marked lightcurve |
|---|---|---|---|---|---|---|---|
| A | 7892 | 6792 | 294 | 294 | 3.73% | 4.33% | 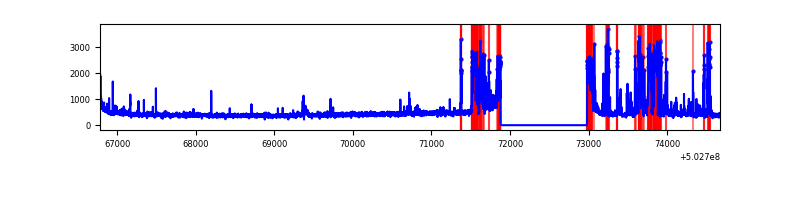 |
| B | 7892 | 6793 | 12 | 12 | 0.15% | 0.18% | 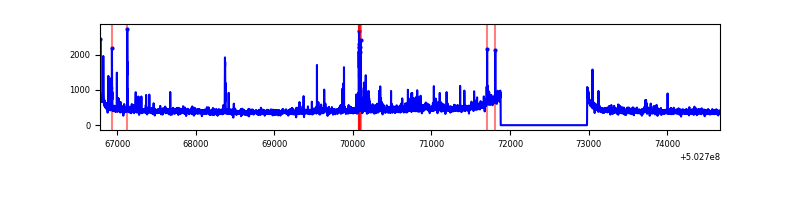 |
| C | 7892 | 6793 | 17 | 17 | 0.22% | 0.25% | 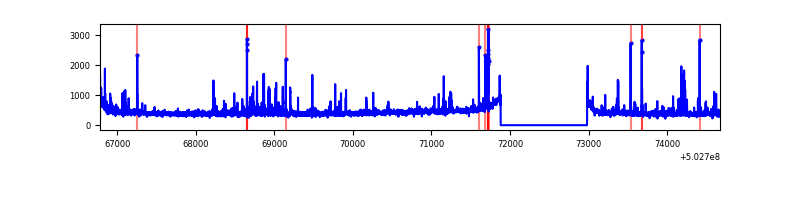 |
| D | 7891 | 6791 | 1631 | 1631 | 20.67% | 24.02% | 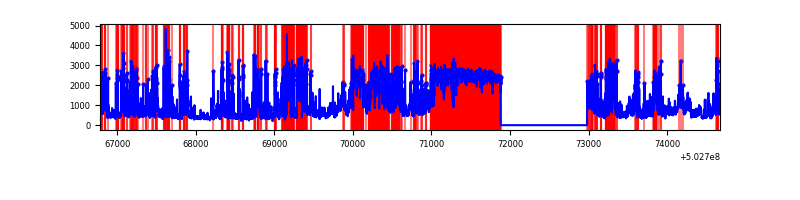 |
Top three noisy pixels from each quadrant. If the there are fewer than three noisy pixels in the level2.evt file, extra rows are filled as -1
| Pixel properties | Quadrant properties | ||||||
|---|---|---|---|---|---|---|---|
| Quadrant | DetID | PixID | Counts | Sigma | Mean | Median | Sigma |
| A | 15 | 32 | 965756 | 5522.71 | 701 | 683 | 174.7 |
| A | 0 | 8 | 169741 | 967.45 | 701 | 683 | 174.7 |
| A | 8 | 6 | 16197 | 88.78 | 701 | 683 | 174.7 |
| B | 4 | 81 | 54516 | 350.74 | 716 | 691 | 153.5 |
| B | 10 | 247 | 44895 | 288.05 | 716 | 691 | 153.5 |
| B | 0 | 182 | 38740 | 247.94 | 716 | 691 | 153.5 |
| C | 6 | 223 | 100775 | 515.53 | 700 | 696 | 194.1 |
| C | 13 | 3 | 39504 | 199.91 | 700 | 696 | 194.1 |
| C | 15 | 178 | 37116 | 187.61 | 700 | 696 | 194.1 |
| D | 11 | 129 | 5285662 | 31365.93 | 594 | 569 | 168.5 |
| D | 11 | 176 | 126029 | 744.58 | 594 | 569 | 168.5 |
| D | 15 | 94 | 125530 | 741.62 | 594 | 569 | 168.5 |
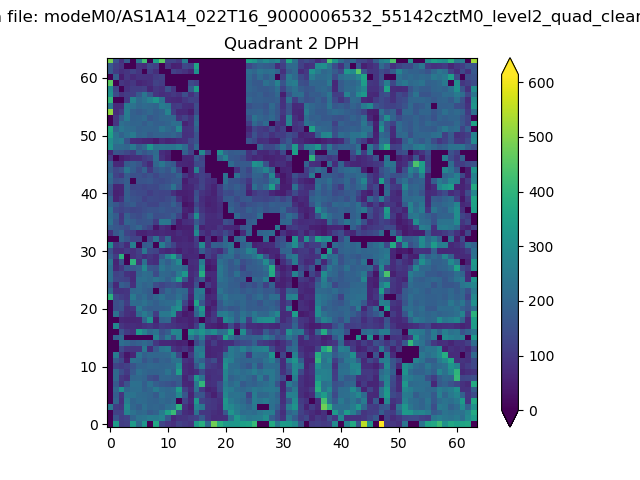
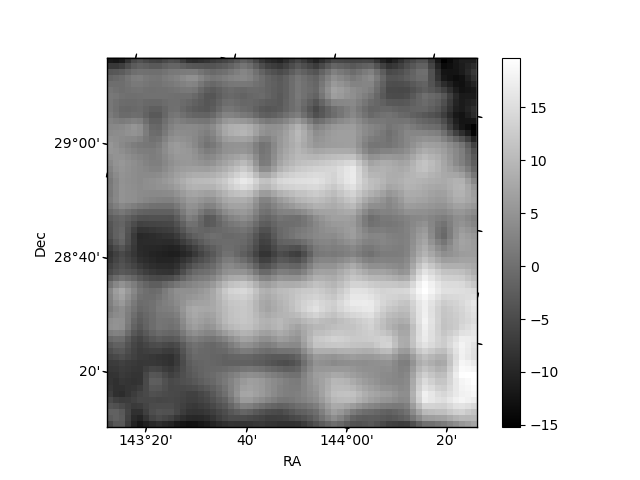
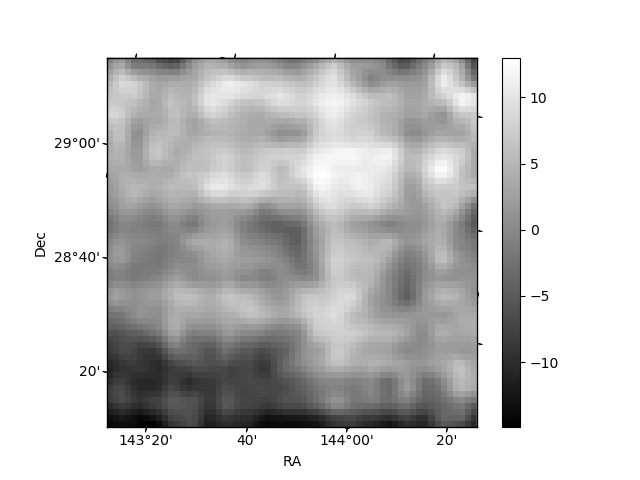
Histogram calculated using DETX and DETY for each event in the final _common_clean file
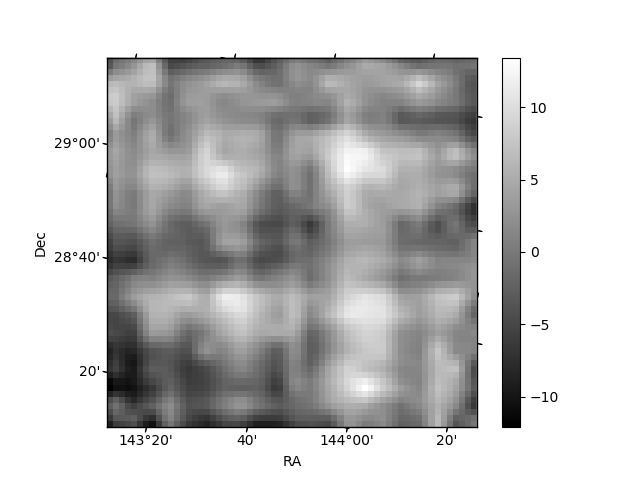
| Quadrant A | 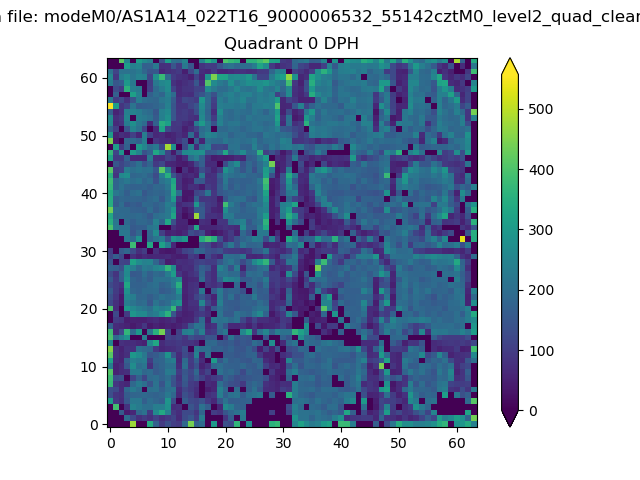 |
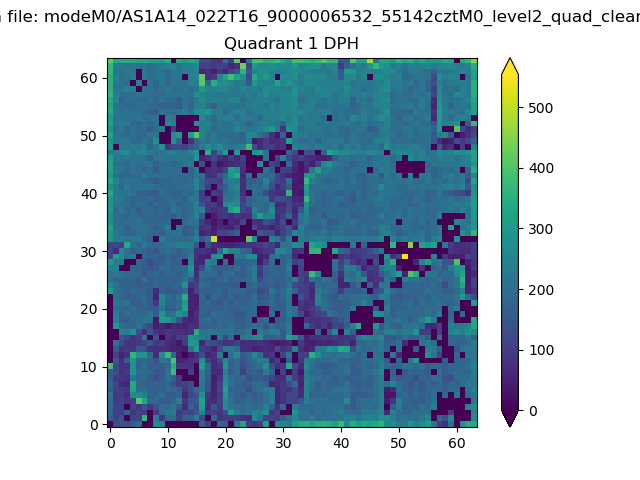 |
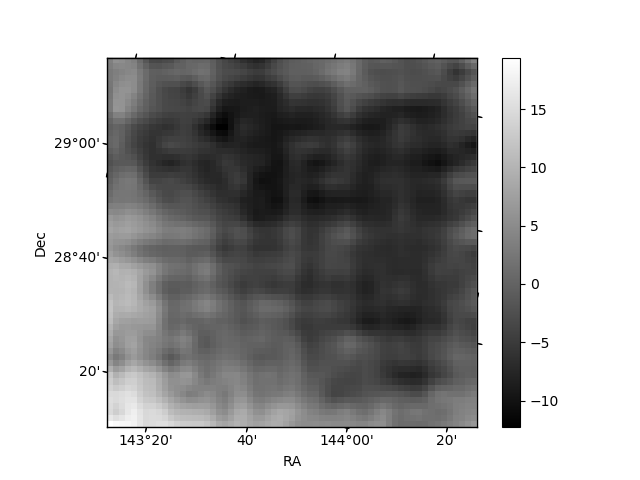
Quadrant B |
|---|---|---|---|
| Quadrant D | 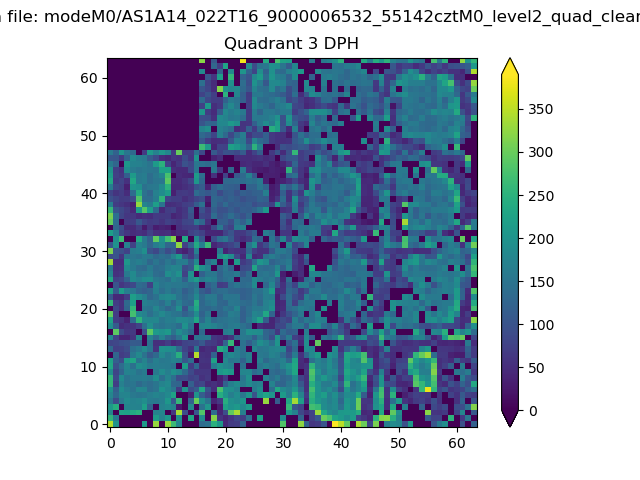 |
 |
Quadrant C |
| Plot type | Count rate plots | Images |
|---|---|---|
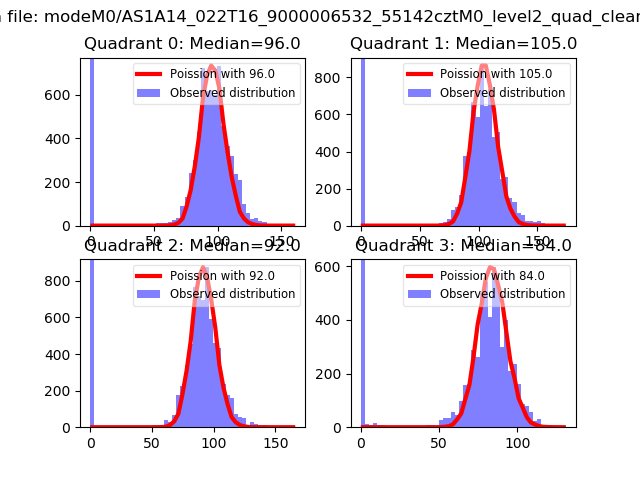
| Comparison with Poisson distribution Blue bars denote a histogram of data divided into 1 sec bins. Red curve is a Poisson curve with rate = median count rate of data. |
 |
 |
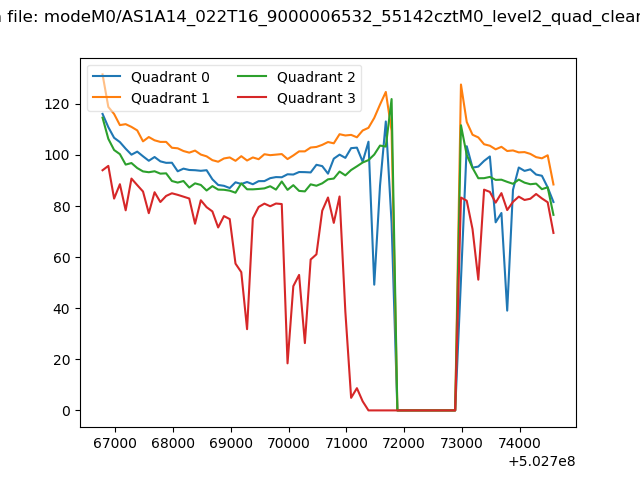
| Quadrant-wise count rates Data is divided into 100 sec bins |
 |
|
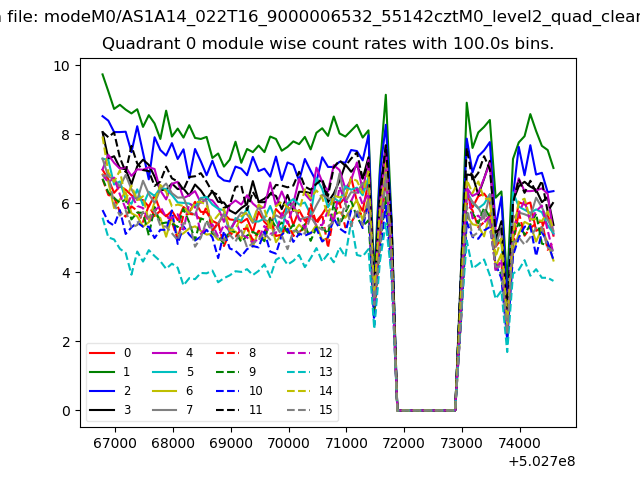
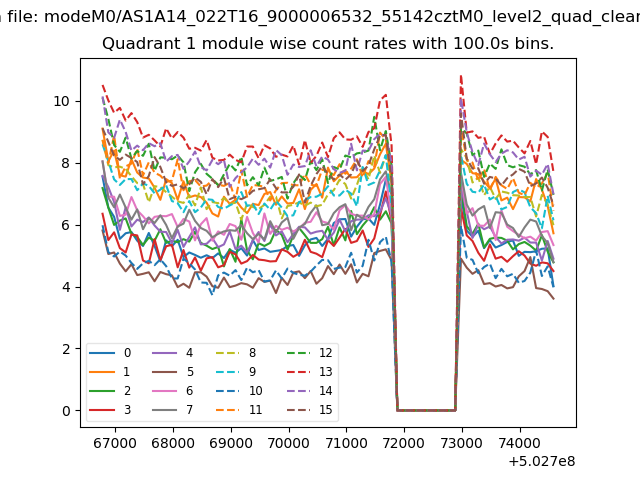
| Module-wise count rates for Quadrant A Data is divided into 100 sec bins |
 |
 |
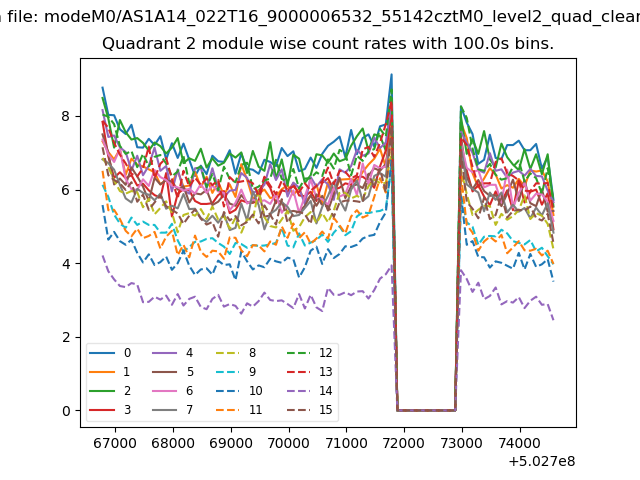
| Module-wise count rates for Quadrant B Data is divided into 100 sec bins |
 |
 |
| Module-wise count rates for Quadrant C Data is divided into 100 sec bins |
 |
 |
| Module-wise count rates for Quadrant D Data is divided into 100 sec bins |
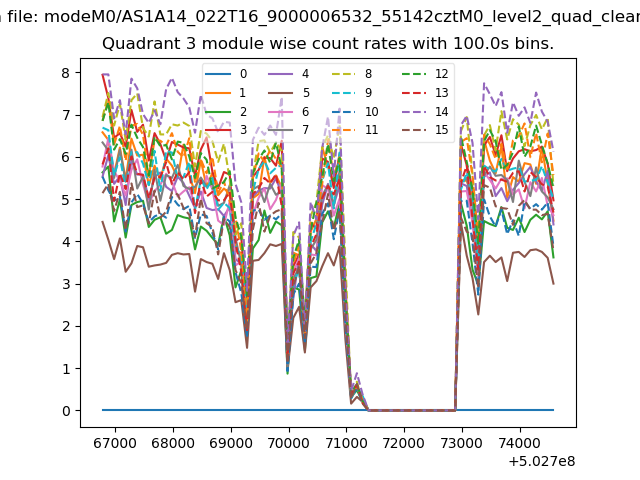 |
 |
| Parameter | Plot |
|---|---|
| CZT HV Monitor | 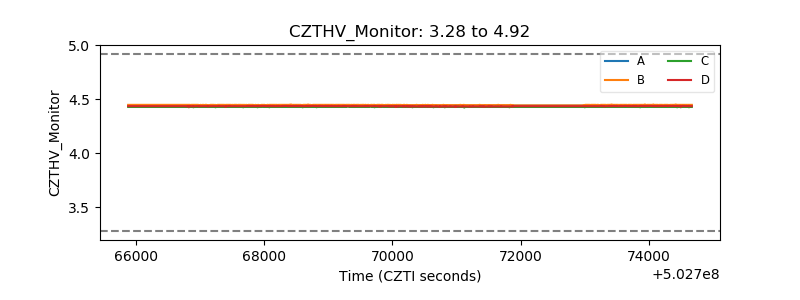 |
| D_VDD | 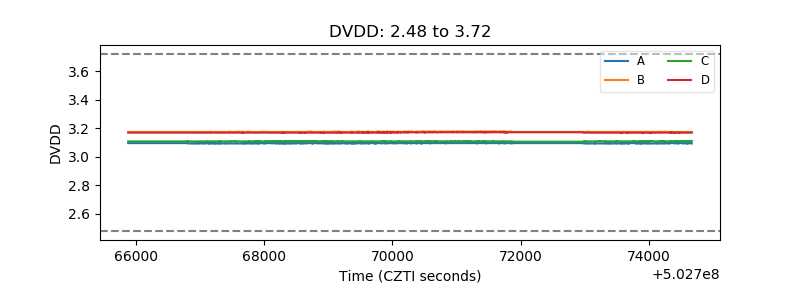 |
| Temperature 1 | 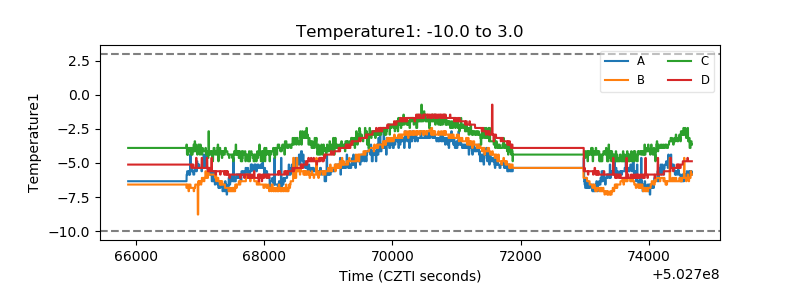 |
| Veto HV Monitor | 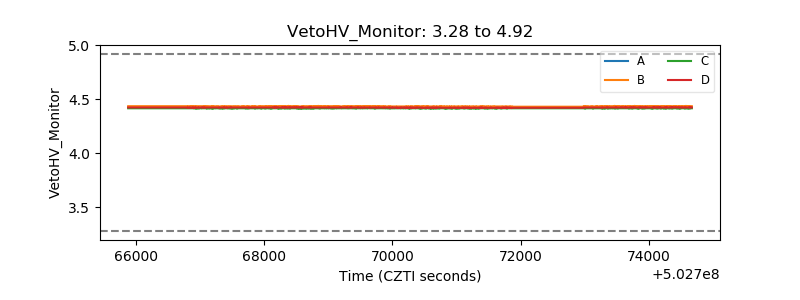 |
| Veto LLD | 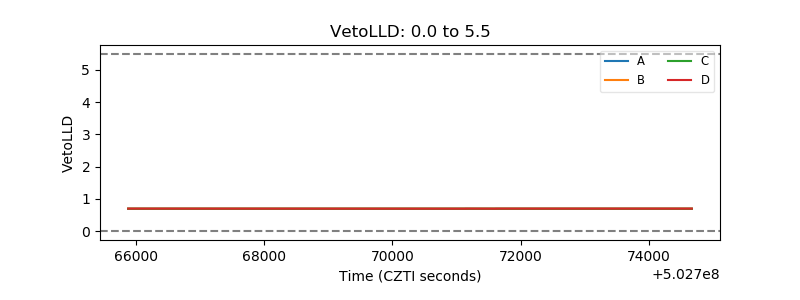 |
| Alpha Counter | 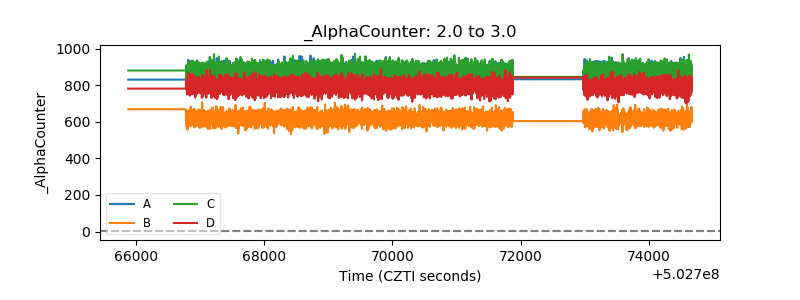 |
| _CPM_Rate | 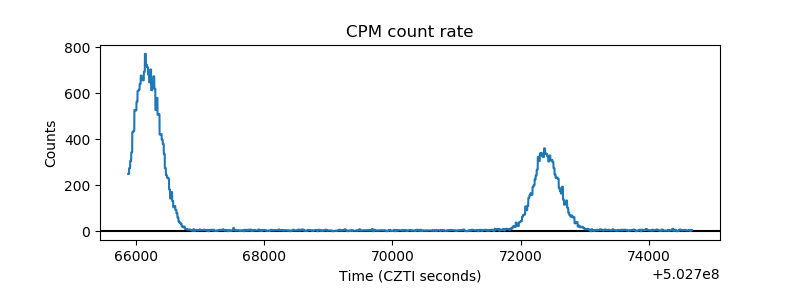 |
| CZT Counter | 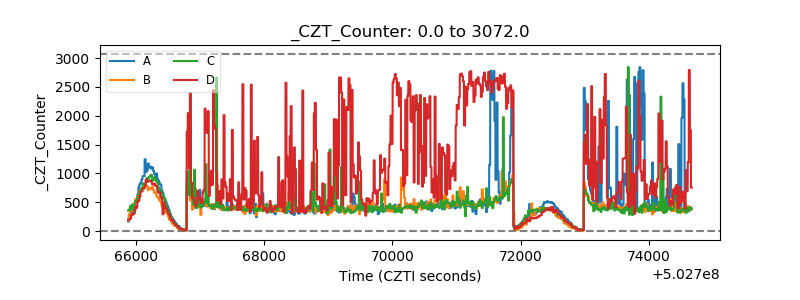 |
| +2.5 Volts monitor |  |
| +5 Volts monitor |  |
| _ROLL_ROT | 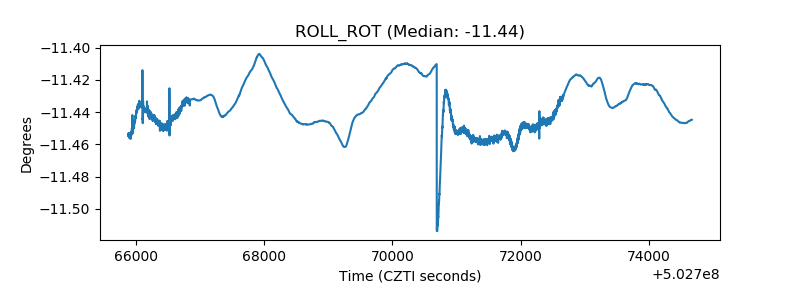 |
| _Roll_DEC | 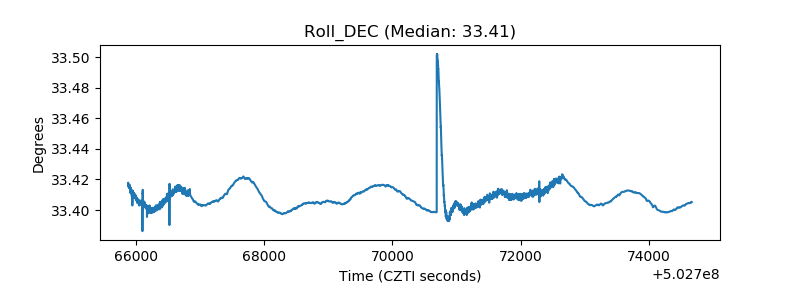 |
| _Roll_RA | 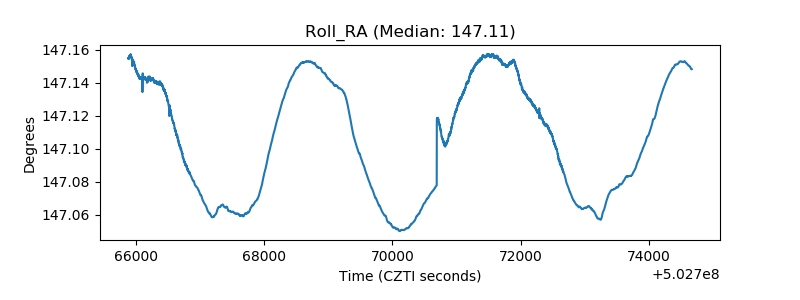 |
| Veto Counter | 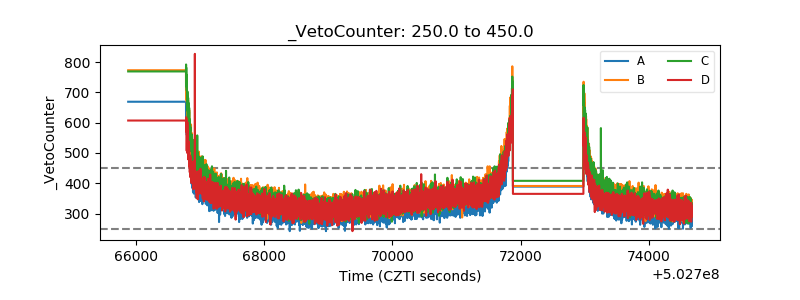 |