| Param | Original file | Final file |
|---|---|---|
| Filename | modeM0/AS1A14_022T16_9000006532_55143cztM0_level2.fits | modeM0/AS1A14_022T16_9000006532_55143cztM0_level2_quad_clean.evt |
| Size (bytes) | 565,922,880 | 99,673,920 |
| Size | 539.7 MB | 95.1 MB |
| Events in quadrant A | 5,565,125 | 630,689 |
| Events in quadrant B | 3,467,455 | 718,892 |
| Events in quadrant C | 3,389,821 | 644,409 |
| Events in quadrant D | 7,970,778 | 525,591 |
| Mode SS | |||
|---|---|---|---|
| Quadrant | BADHDUFLAG | Total packets | Discarded packets |
| A | 0 | 148 | 0 |
| B | 0 | 148 | 0 |
| C | 0 | 148 | 0 |
| D | 0 | 148 | 0 |
| Mode M0 | |||
|---|---|---|---|
| Quadrant | BADHDUFLAG | Total packets | Discarded packets |
| A | 0 | 21710 | 2 |
| B | 0 | 15794 | 2 |
| C | 0 | 15631 | 2 |
| D | 0 | 28802 | 2 |
| Mode M9 | |||
|---|---|---|---|
| Quadrant | BADHDUFLAG | Total packets | Discarded packets |
| A | 0 | 19 | 0 |
| B | 0 | 19 | 0 |
| C | 0 | 19 | 0 |
| D | 0 | 19 | 0 |
| Quadrant | Total seconds | Saturated seconds | Saturation percentage |
|---|---|---|---|
| A | 7154 | 686 | 9.589041% |
| B | 7155 | 207 | 2.893082% |
| C | 7155 | 90 | 1.257862% |
| D | 7155 | 1122 | 15.681342% |
Noise dominated data is calculated using 1-second bins in cleaned event files. If a bin has >2000 counts, and if more than 50% of those come from <1% of pixels, then it is considered to be noise-dominated and hence unusable.
| Quadrant | # 1 sec bins | Bins with >0 counts | Bins with >2000 counts | High rate bins dominated by noise | Noise dominated (total time) | Noise dominated (detector-on time) | Marked lightcurve |
|---|---|---|---|---|---|---|---|
| A | 9114 | 7154 | 561 | 561 | 6.16% | 7.84% | 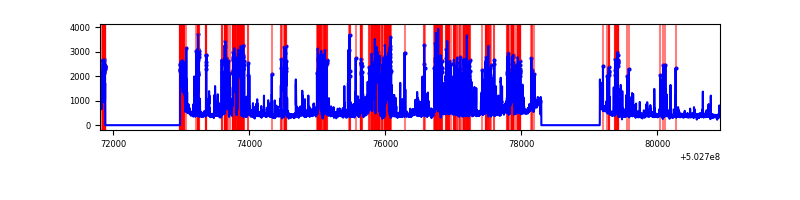 |
| B | 9115 | 7156 | 62 | 62 | 0.68% | 0.87% | 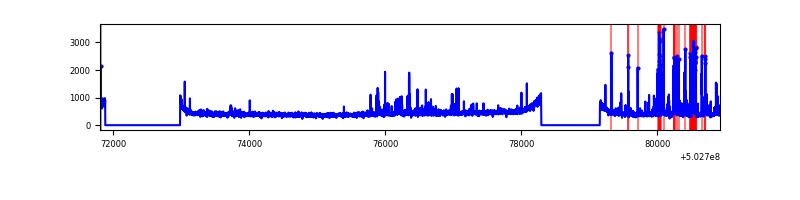 |
| C | 9115 | 7157 | 43 | 43 | 0.47% | 0.60% | 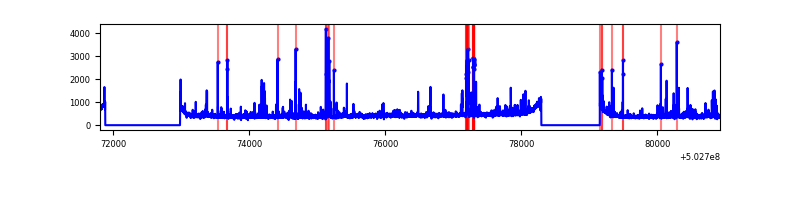 |
| D | 9115 | 7155 | 1020 | 1020 | 11.19% | 14.26% | 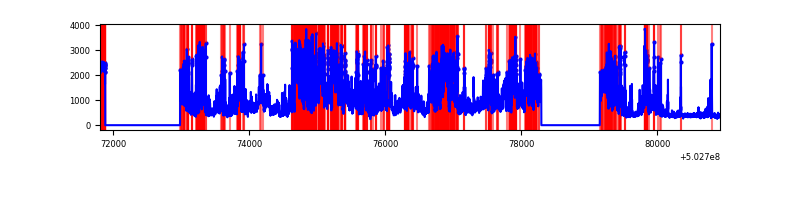 |
Top three noisy pixels from each quadrant. If the there are fewer than three noisy pixels in the level2.evt file, extra rows are filled as -1
| Pixel properties | Quadrant properties | ||||||
|---|---|---|---|---|---|---|---|
| Quadrant | DetID | PixID | Counts | Sigma | Mean | Median | Sigma |
| A | 15 | 32 | 2051149 | 11162.68 | 744 | 722 | 183.7 |
| A | 0 | 8 | 526221 | 2860.86 | 744 | 722 | 183.7 |
| A | 3 | 78 | 22381 | 117.91 | 744 | 722 | 183.7 |
| B | 4 | 81 | 318563 | 1944.21 | 759 | 731 | 163.5 |
| B | 5 | 185 | 58098 | 350.92 | 759 | 731 | 163.5 |
| B | 0 | 182 | 44210 | 265.97 | 759 | 731 | 163.5 |
| C | 14 | 254 | 168861 | 822.16 | 744 | 739 | 204.5 |
| C | 6 | 223 | 69844 | 337.94 | 744 | 739 | 204.5 |
| C | 12 | 250 | 51072 | 246.14 | 744 | 739 | 204.5 |
| D | 11 | 129 | 4222932 | 21667.77 | 690 | 661 | 194.9 |
| D | 15 | 94 | 387032 | 1982.77 | 690 | 661 | 194.9 |
| D | 11 | 176 | 364974 | 1869.57 | 690 | 661 | 194.9 |
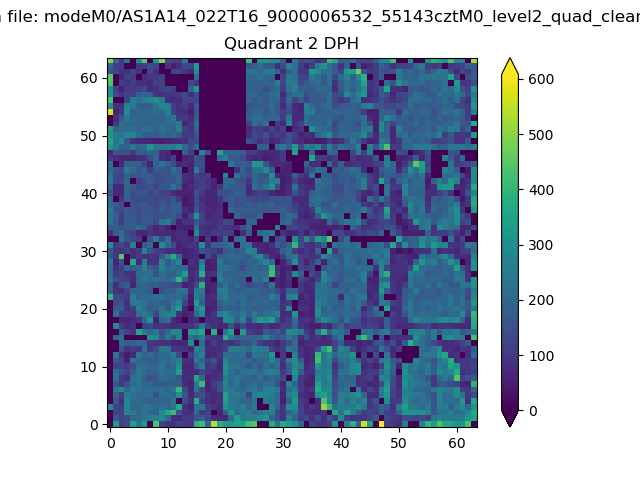
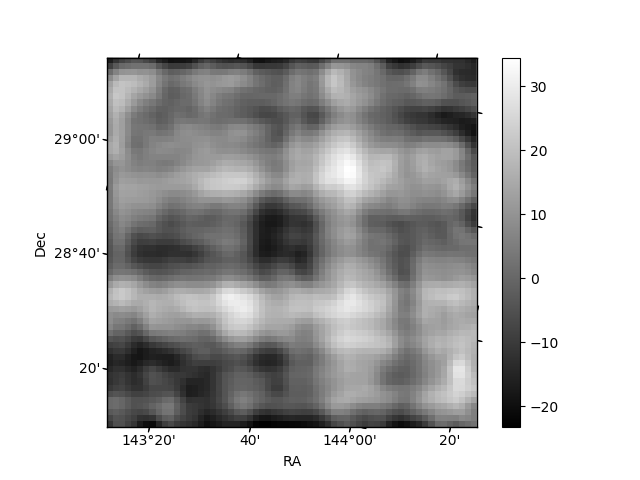
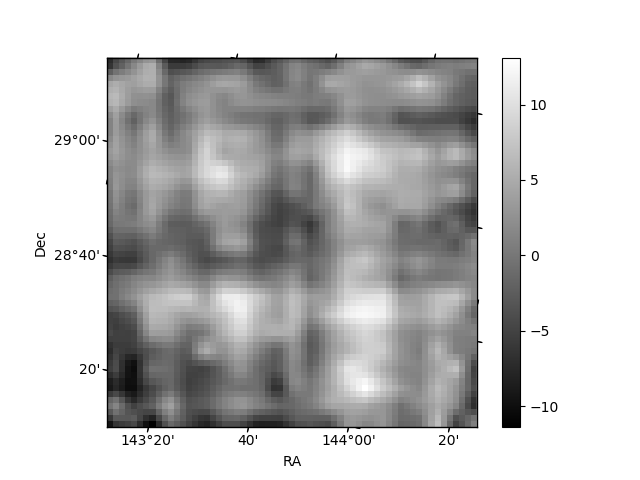
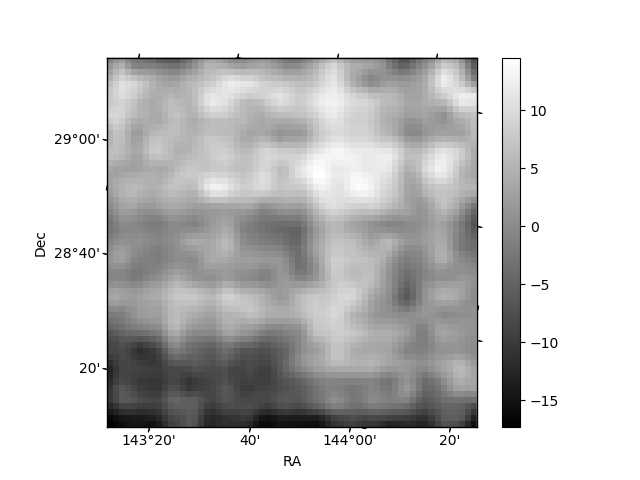
Histogram calculated using DETX and DETY for each event in the final _common_clean file
| Quadrant A | 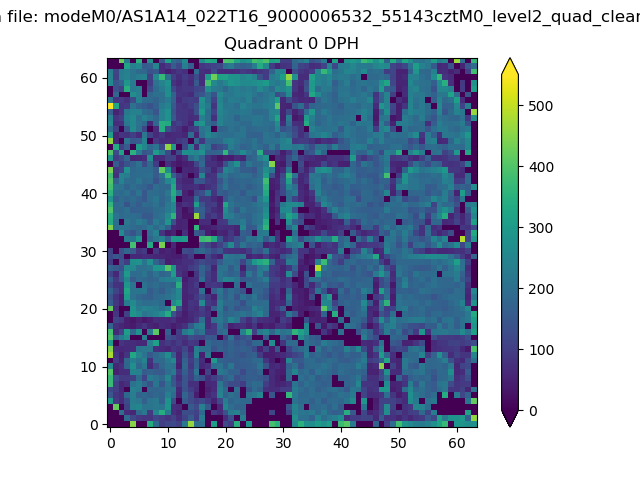 |
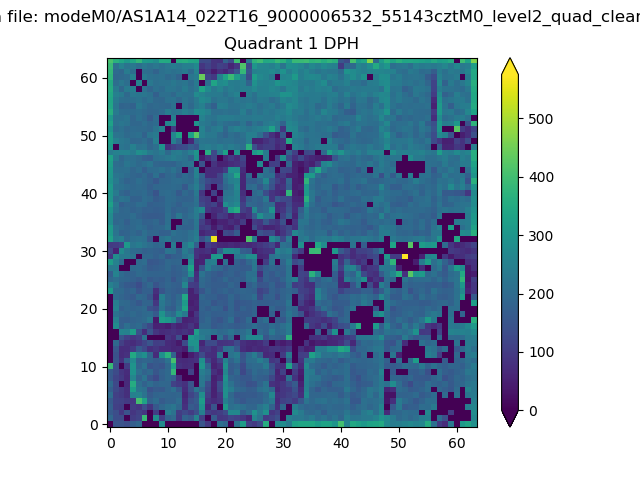 |
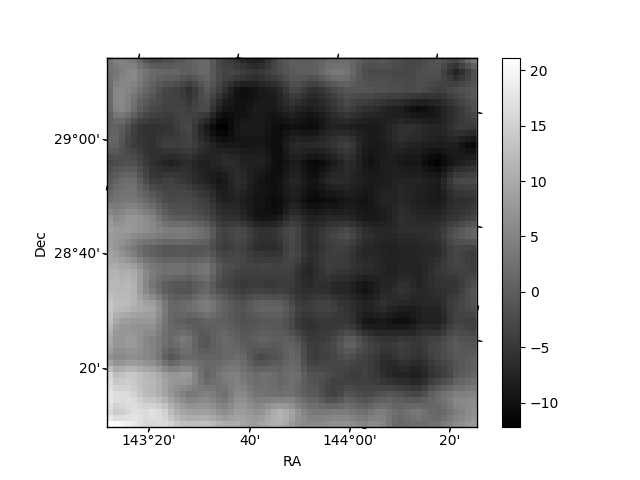
Quadrant B |
|---|---|---|---|
| Quadrant D | 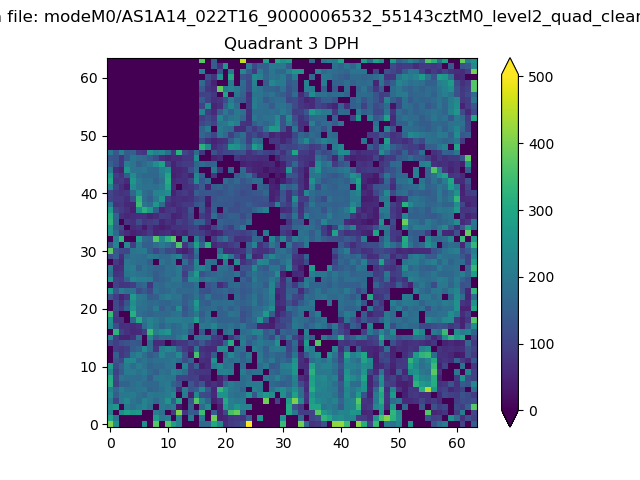 |
 |
Quadrant C |
| Plot type | Count rate plots | Images |
|---|---|---|
| Comparison with Poisson distribution Blue bars denote a histogram of data divided into 1 sec bins. Red curve is a Poisson curve with rate = median count rate of data. |
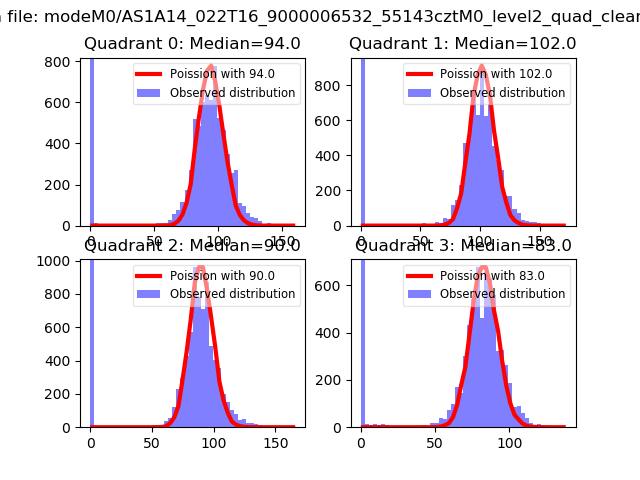 |
 |
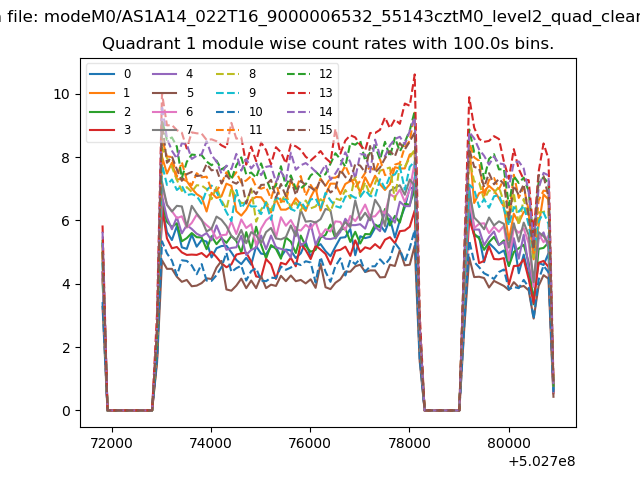
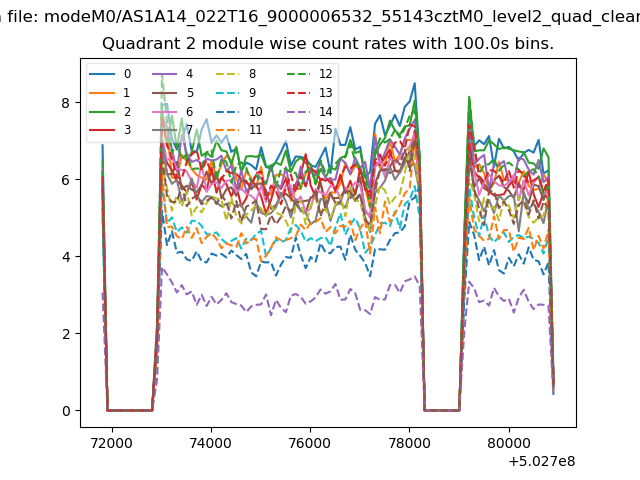
| Quadrant-wise count rates Data is divided into 100 sec bins |
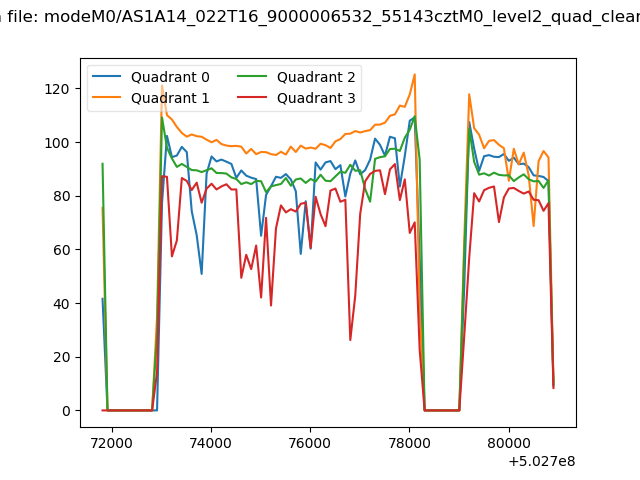 |
|
| Module-wise count rates for Quadrant A Data is divided into 100 sec bins |
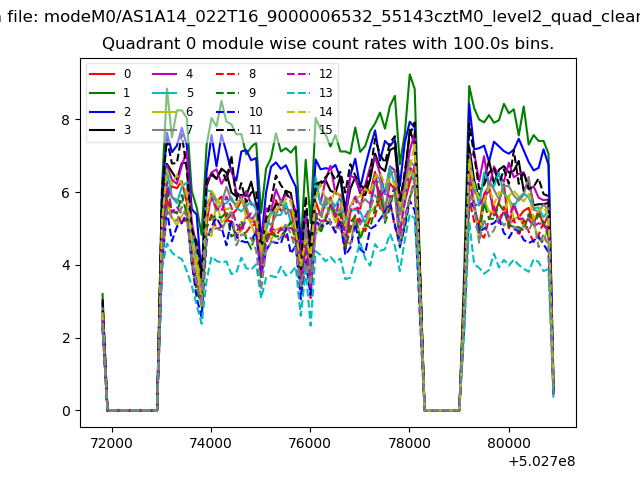 |
 |
| Module-wise count rates for Quadrant B Data is divided into 100 sec bins |
 |
 |
| Module-wise count rates for Quadrant C Data is divided into 100 sec bins |
 |
 |
| Module-wise count rates for Quadrant D Data is divided into 100 sec bins |
 |
 |
| Parameter | Plot |
|---|---|
| CZT HV Monitor | 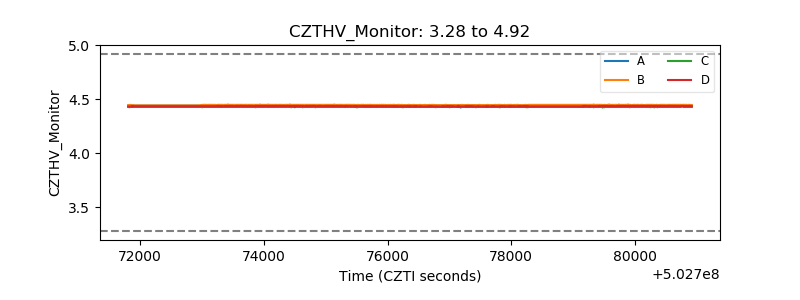 |
| D_VDD | 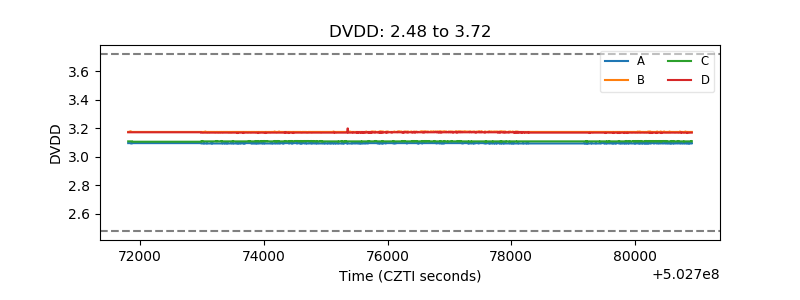 |
| Temperature 1 | 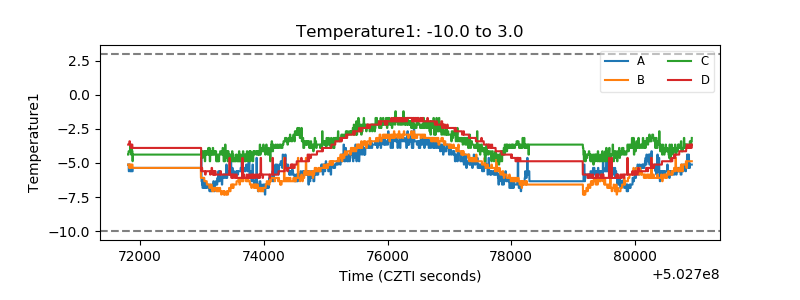 |
| Veto HV Monitor | 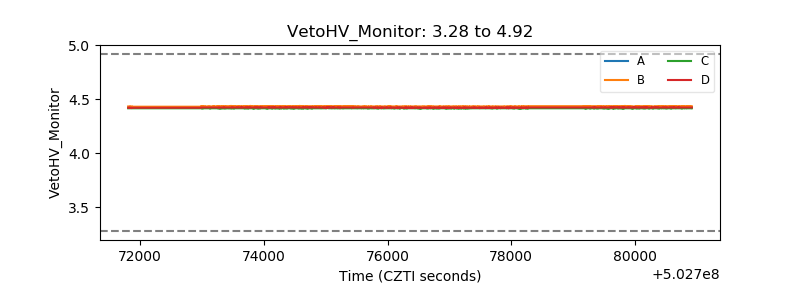 |
| Veto LLD | 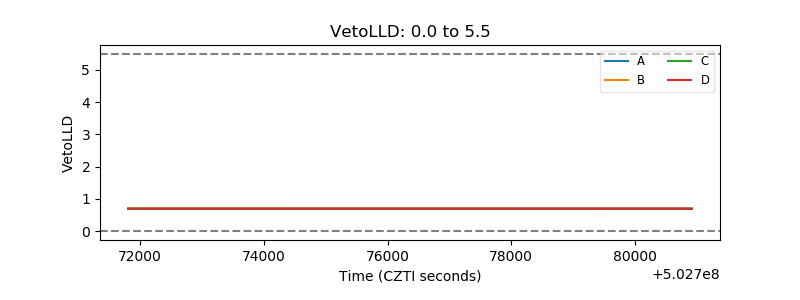 |
| Alpha Counter | 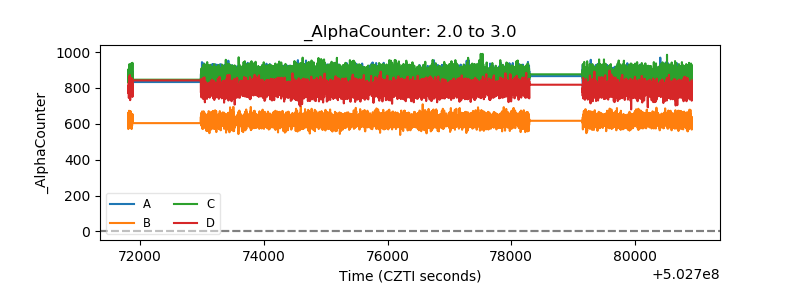 |
| _CPM_Rate | 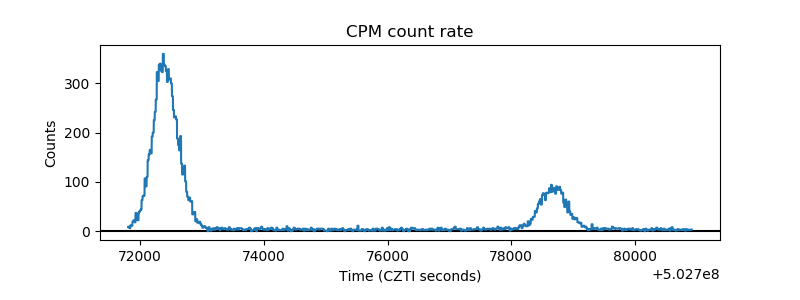 |
| CZT Counter | 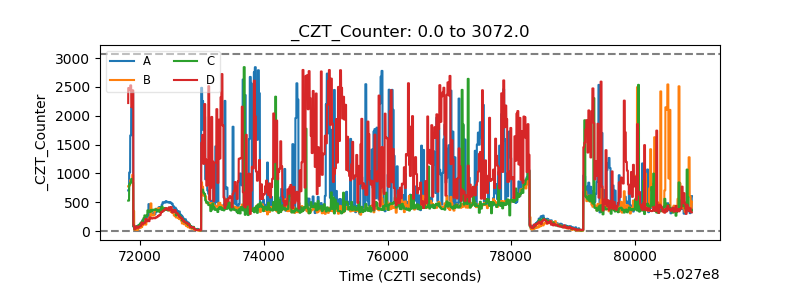 |
| +2.5 Volts monitor |  |
| +5 Volts monitor | 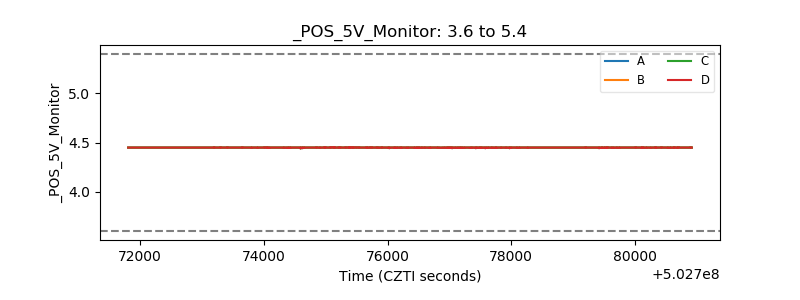 |
| _ROLL_ROT | 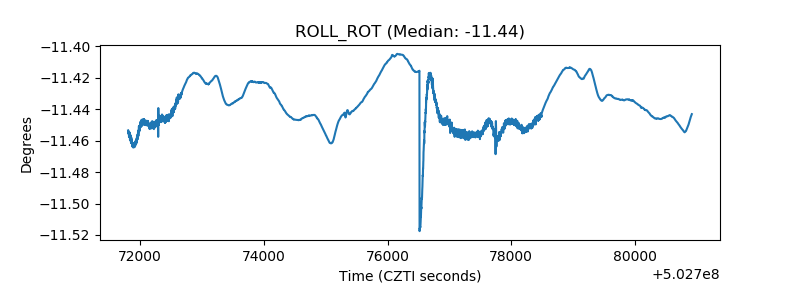 |
| _Roll_DEC |  |
| _Roll_RA | 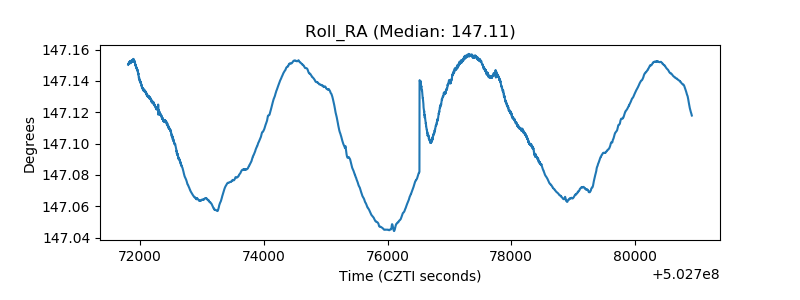 |
| Veto Counter | 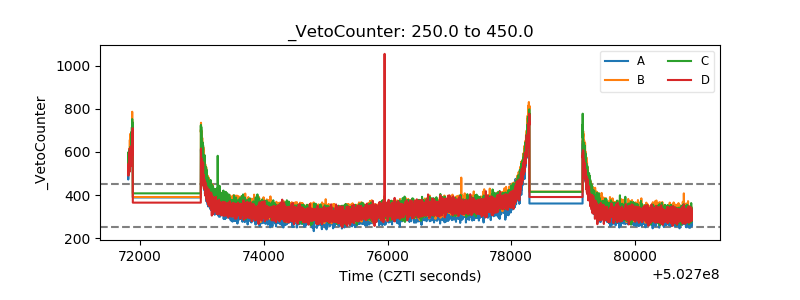 |