| Param | Original file | Final file |
|---|---|---|
| Filename | modeM0/AS1A14_022T16_9000006532_55145cztM0_level2.fits | modeM0/AS1A14_022T16_9000006532_55145cztM0_level2_quad_clean.evt |
| Size (bytes) | 672,756,480 | 89,651,520 |
| Size | 641.6 MB | 85.5 MB |
| Events in quadrant A | 7,685,707 | 530,711 |
| Events in quadrant B | 4,003,065 | 657,310 |
| Events in quadrant C | 3,446,624 | 606,331 |
| Events in quadrant D | 9,231,995 | 438,507 |
| Mode SS | |||
|---|---|---|---|
| Quadrant | BADHDUFLAG | Total packets | Discarded packets |
| A | 0 | 140 | 2 |
| B | 0 | 140 | 2 |
| C | 0 | 140 | 4 |
| D | 0 | 140 | 2 |
| Mode M0 | |||
|---|---|---|---|
| Quadrant | BADHDUFLAG | Total packets | Discarded packets |
| A | 0 | 28513 | 827 |
| B | 0 | 17401 | 259 |
| C | 0 | 15491 | 312 |
| D | 0 | 32657 | 383 |
| Quadrant | Total seconds | Saturated seconds | Saturation percentage |
|---|---|---|---|
| A | 6906 | 1406 | 20.359108% |
| B | 6920 | 381 | 5.505780% |
| C | 6913 | 9 | 0.130189% |
| D | 6912 | 1843 | 26.663773% |
Noise dominated data is calculated using 1-second bins in cleaned event files. If a bin has >2000 counts, and if more than 50% of those come from <1% of pixels, then it is considered to be noise-dominated and hence unusable.
| Quadrant | # 1 sec bins | Bins with >0 counts | Bins with >2000 counts | High rate bins dominated by noise | Noise dominated (total time) | Noise dominated (detector-on time) | Marked lightcurve |
|---|---|---|---|---|---|---|---|
| A | 6922 | 6908 | 1307 | 1307 | 18.88% | 18.92% | 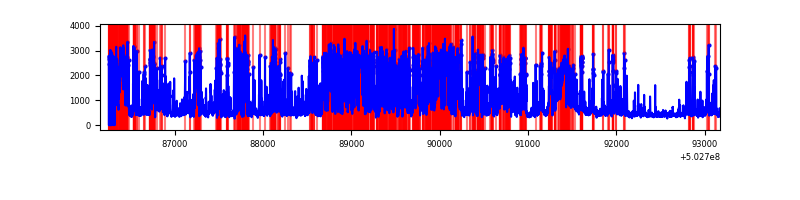 |
| B | 6930 | 6927 | 337 | 337 | 4.86% | 4.87% | 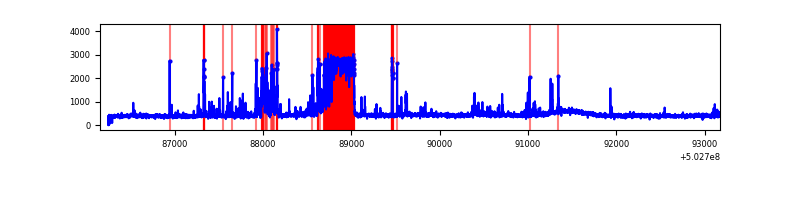 |
| C | 6926 | 6921 | 7 | 7 | 0.10% | 0.10% | 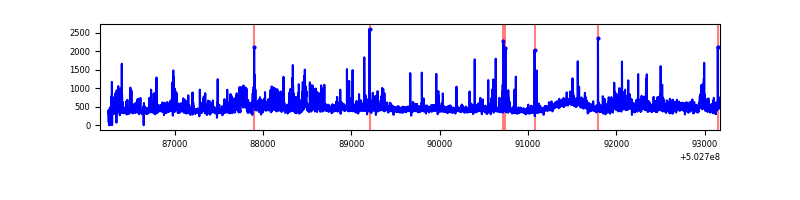 |
| D | 7022 | 6922 | 1948 | 1948 | 27.74% | 28.14% | 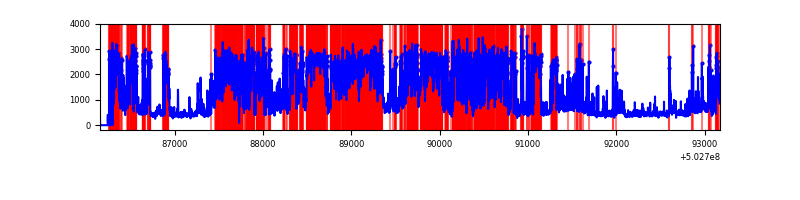 |
Top three noisy pixels from each quadrant. If the there are fewer than three noisy pixels in the level2.evt file, extra rows are filled as -1
| Pixel properties | Quadrant properties | ||||||
|---|---|---|---|---|---|---|---|
| Quadrant | DetID | PixID | Counts | Sigma | Mean | Median | Sigma |
| A | 3 | 78 | 4399264 | 26881.56 | 660 | 642 | 163.6 |
| A | 15 | 32 | 526333 | 3212.69 | 660 | 642 | 163.6 |
| A | 0 | 8 | 109344 | 664.32 | 660 | 642 | 163.6 |
| B | 2 | 249 | 867566 | 5738.45 | 694 | 668 | 151.1 |
| B | 4 | 81 | 181650 | 1198.01 | 694 | 668 | 151.1 |
| B | 5 | 185 | 90432 | 594.19 | 694 | 668 | 151.1 |
| C | 1 | 16 | 348905 | 1809.83 | 699 | 690 | 192.4 |
| C | 14 | 254 | 106947 | 552.26 | 699 | 690 | 192.4 |
| C | 13 | 3 | 44857 | 229.56 | 699 | 690 | 192.4 |
| D | 11 | 129 | 5853457 | 33375.71 | 623 | 595 | 175.4 |
| D | 3 | 12 | 272962 | 1553.16 | 623 | 595 | 175.4 |
| D | 15 | 94 | 148918 | 845.81 | 623 | 595 | 175.4 |
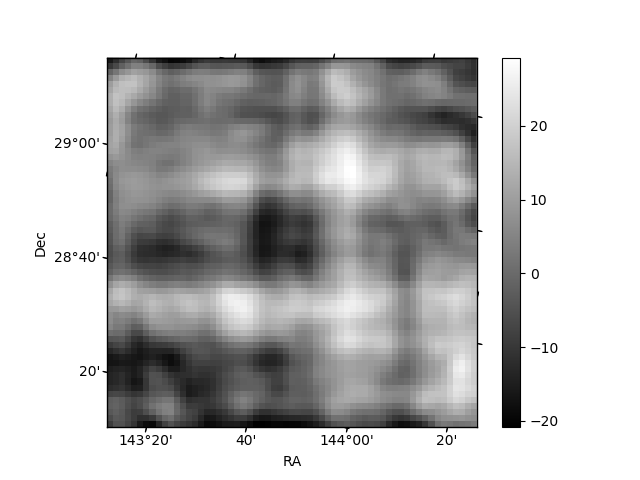
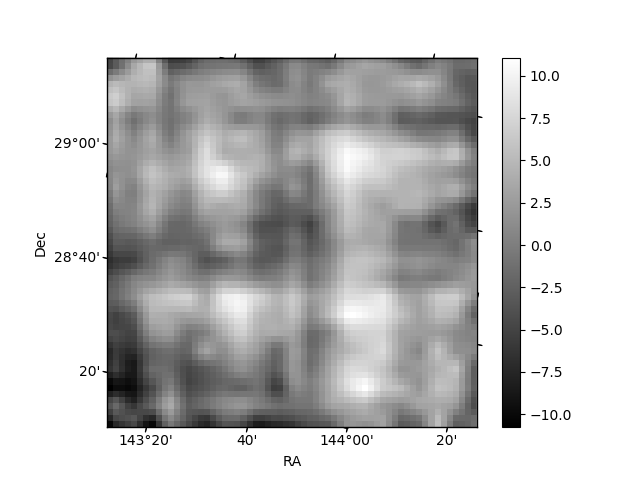
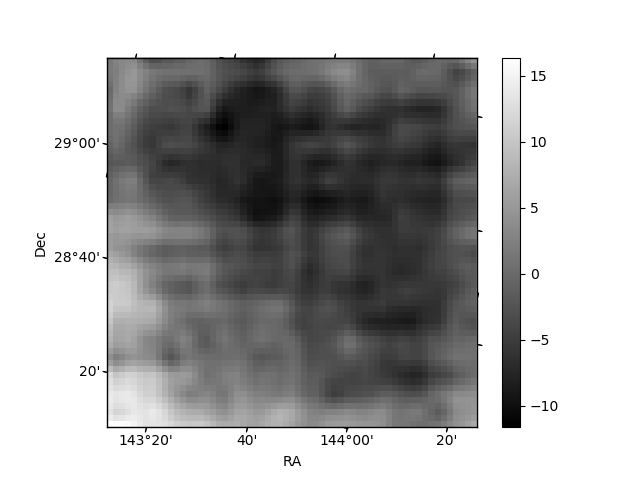
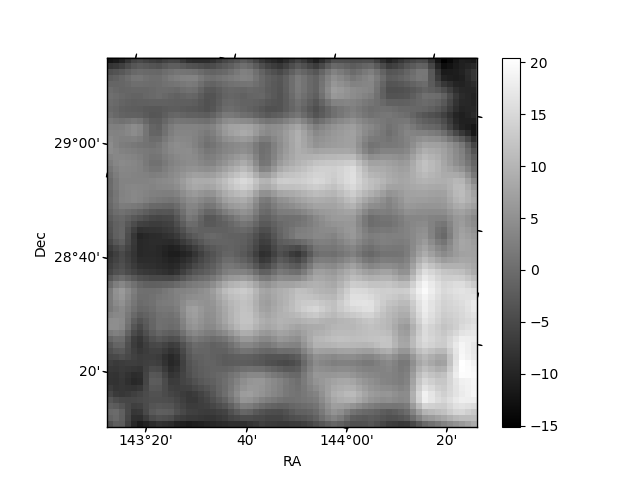
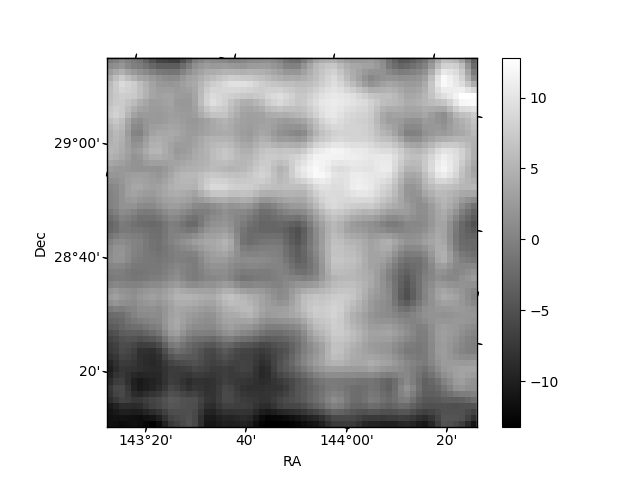
Histogram calculated using DETX and DETY for each event in the final _common_clean file
| Quadrant A | 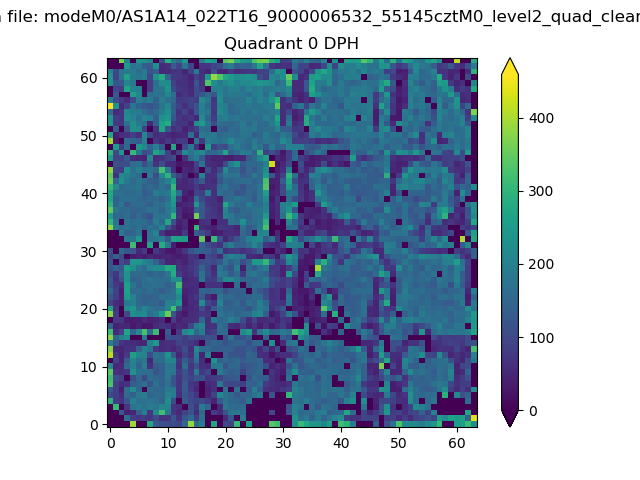 |
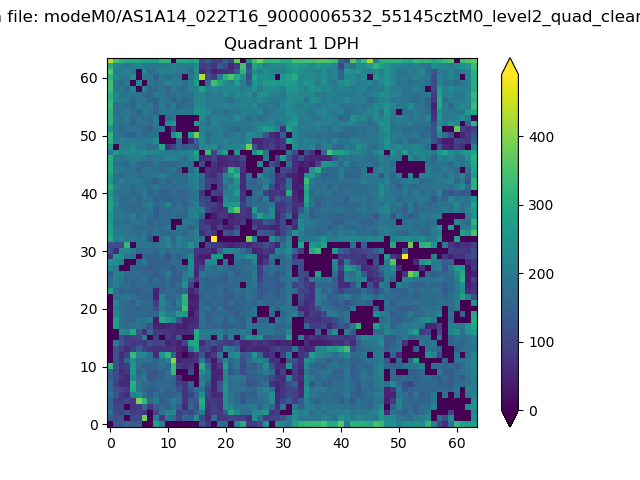 |
Quadrant B |
|---|---|---|---|
| Quadrant D | 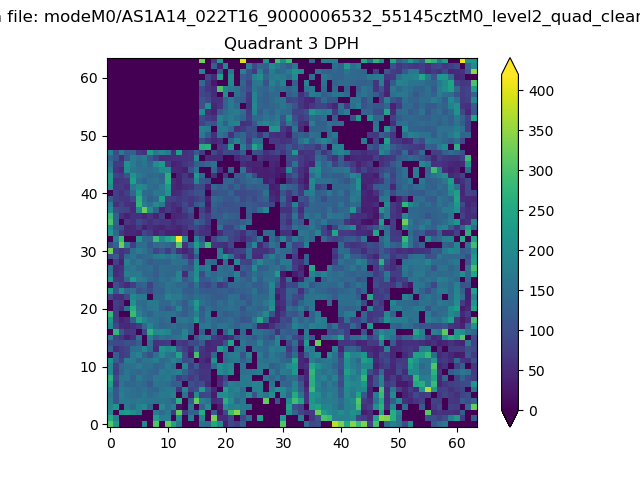 |
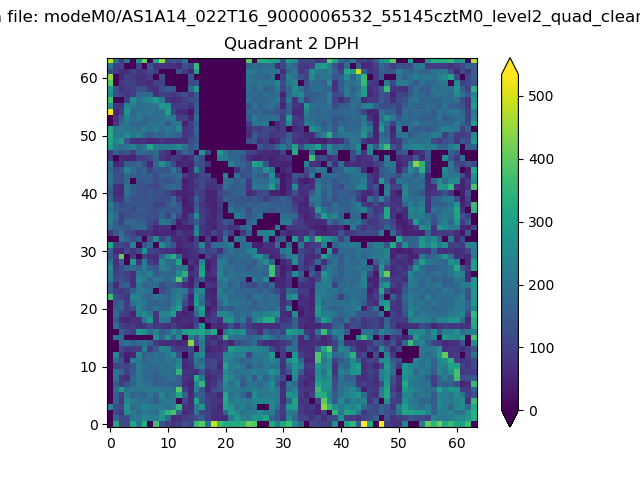 |
Quadrant C |
| Plot type | Count rate plots | Images |
|---|---|---|
| Comparison with Poisson distribution Blue bars denote a histogram of data divided into 1 sec bins. Red curve is a Poisson curve with rate = median count rate of data. |
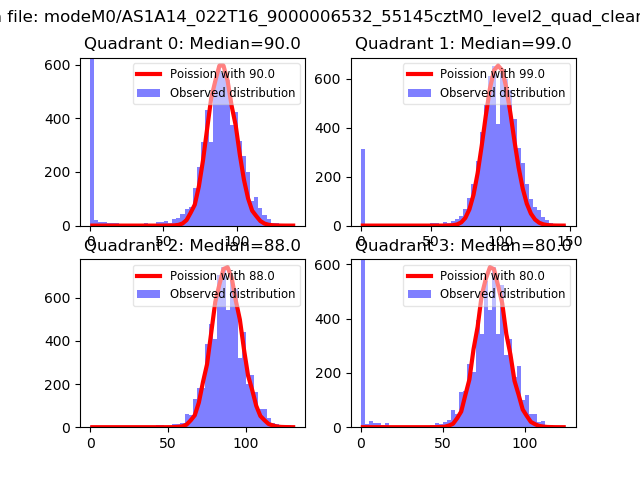 |
 |
| Quadrant-wise count rates Data is divided into 100 sec bins |
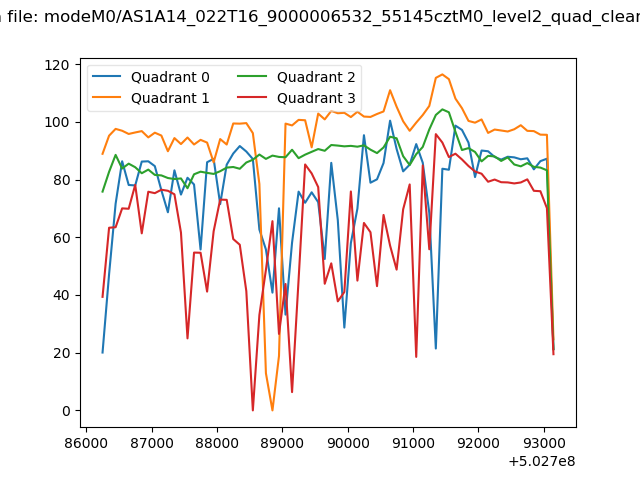 |
|
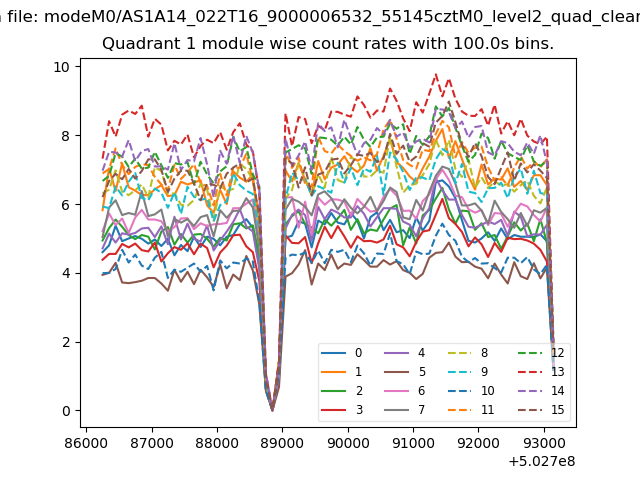
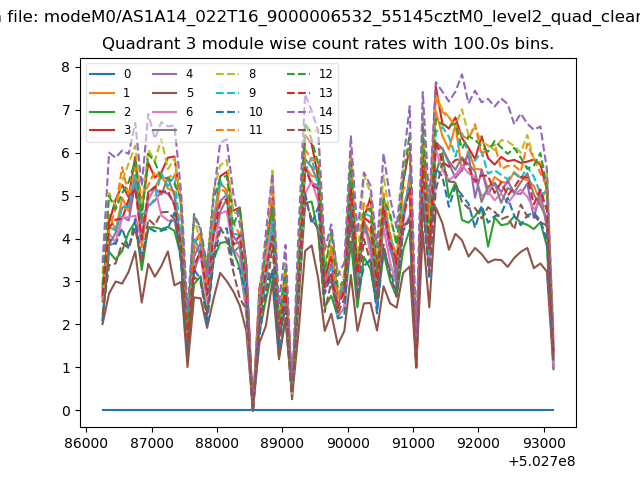
| Module-wise count rates for Quadrant A Data is divided into 100 sec bins |
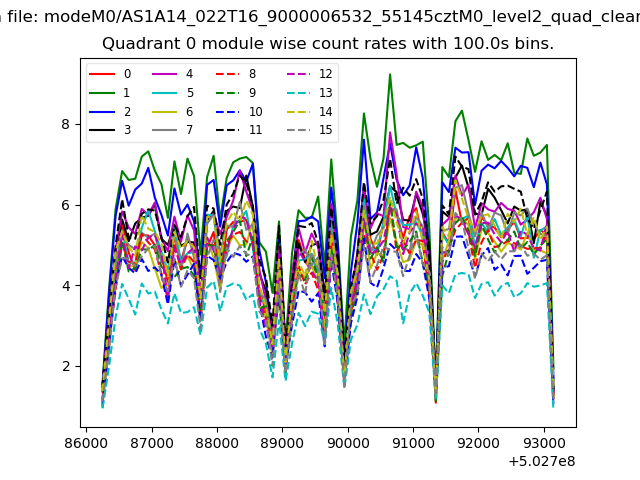 |
 |
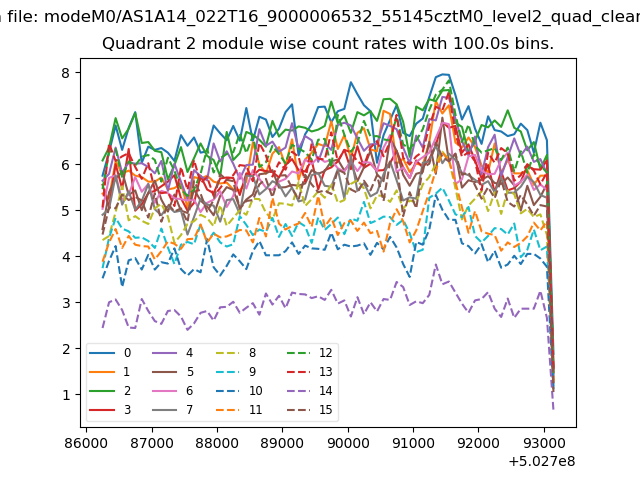
| Module-wise count rates for Quadrant B Data is divided into 100 sec bins |
 |
 |
| Module-wise count rates for Quadrant C Data is divided into 100 sec bins |
 |
 |
| Module-wise count rates for Quadrant D Data is divided into 100 sec bins |
 |
 |
| Parameter | Plot |
|---|---|
| CZT HV Monitor | 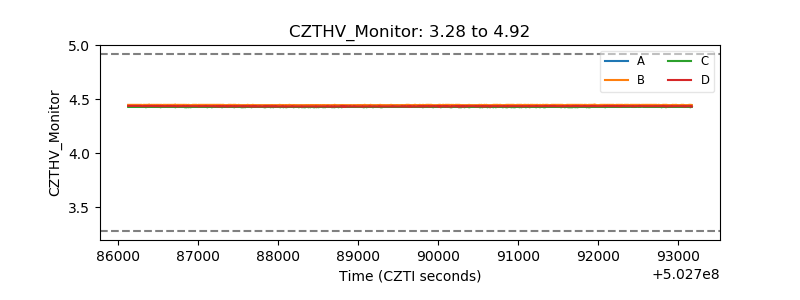 |
| D_VDD | 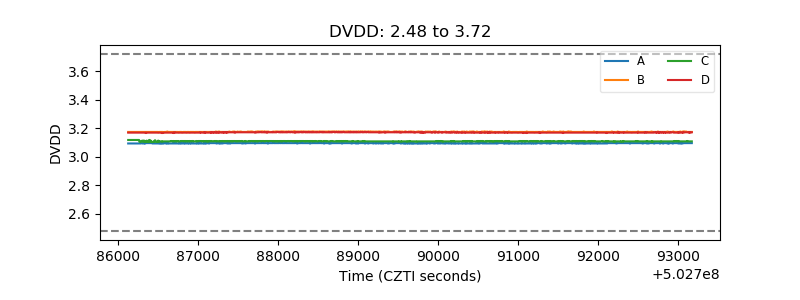 |
| Temperature 1 | 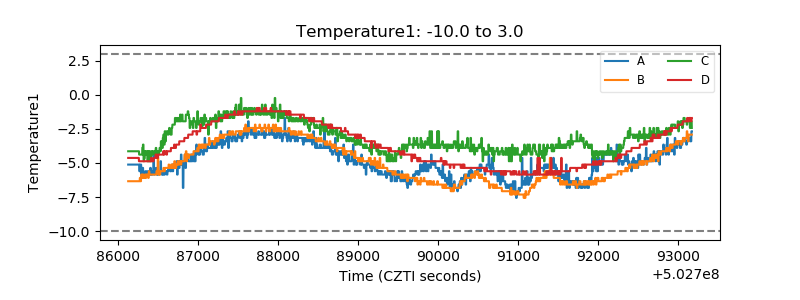 |
| Veto HV Monitor | 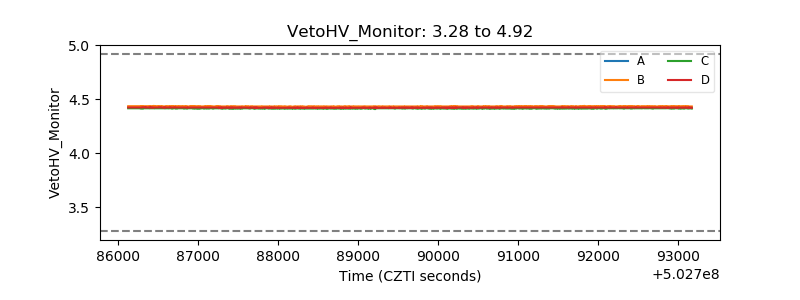 |
| Veto LLD | 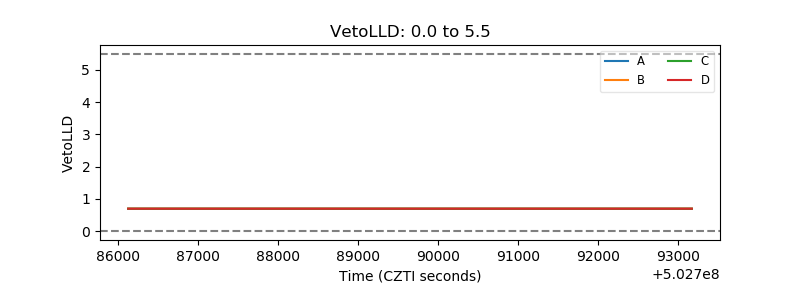 |
| Alpha Counter | 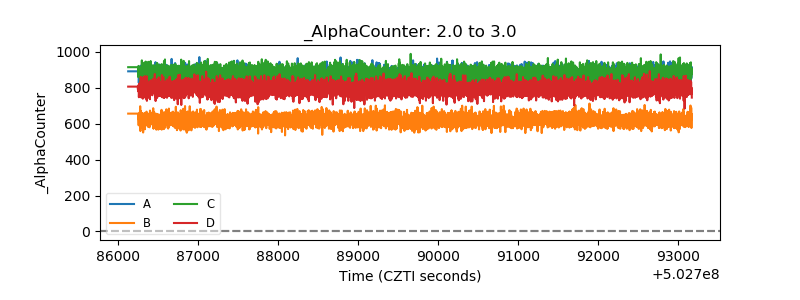 |
| _CPM_Rate | 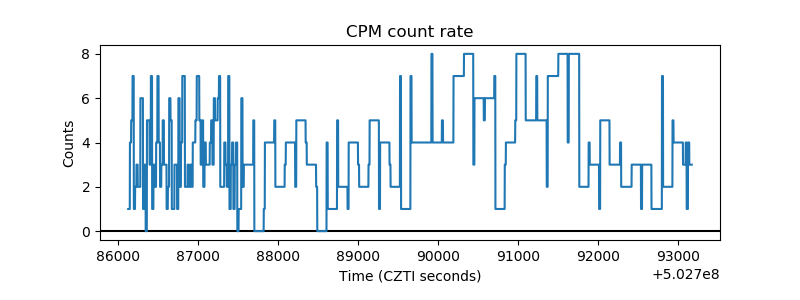 |
| CZT Counter | 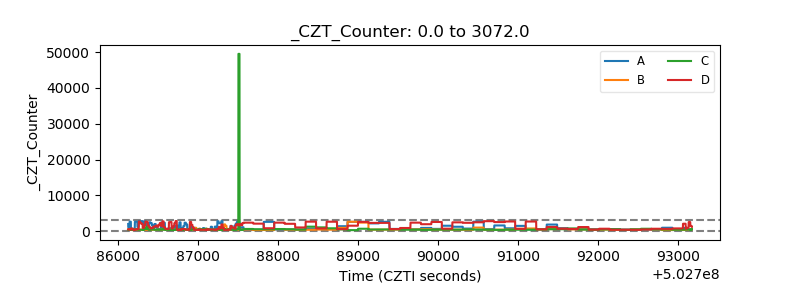 |
| +2.5 Volts monitor | 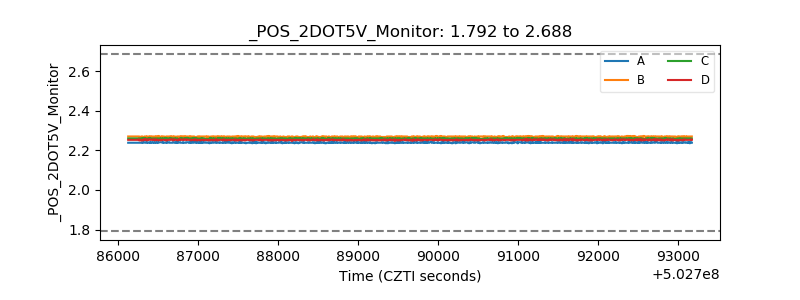 |
| +5 Volts monitor |  |
| _ROLL_ROT | 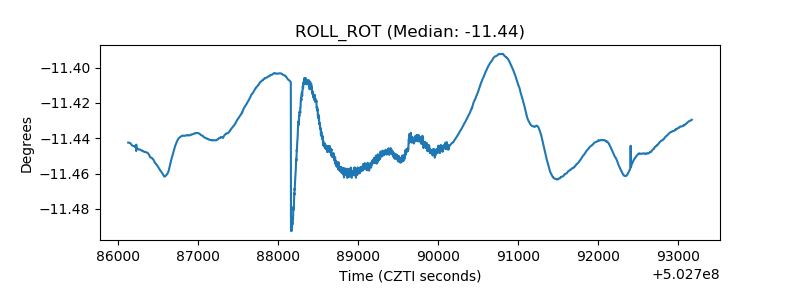 |
| _Roll_DEC | 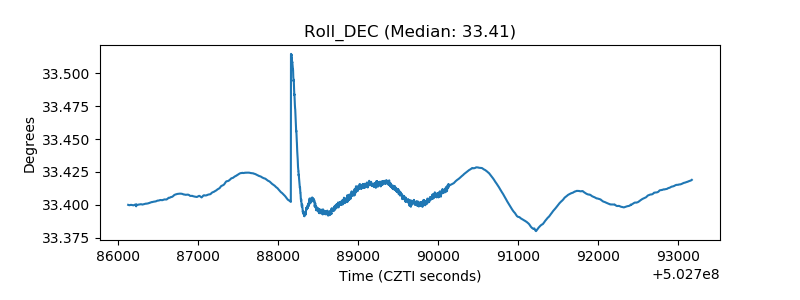 |
| _Roll_RA | 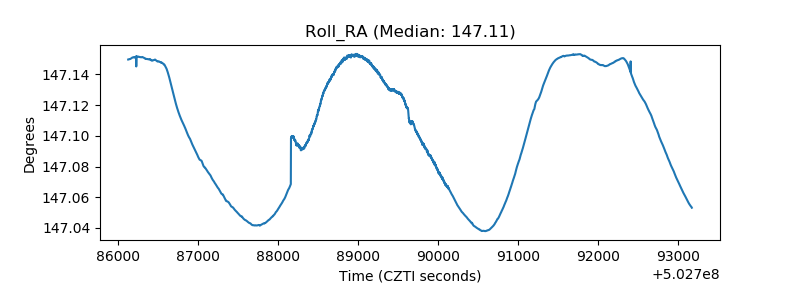 |
| Veto Counter | 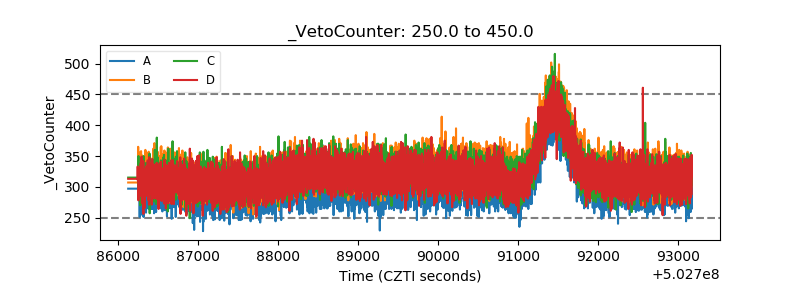 |