| Param | Original file | Final file |
|---|---|---|
| Filename | modeM0/AS1A14_022T16_9000006532_55146cztM0_level2.fits | modeM0/AS1A14_022T16_9000006532_55146cztM0_level2_quad_clean.evt |
| Size (bytes) | 649,969,920 | 98,095,680 |
| Size | 619.9 MB | 93.6 MB |
| Events in quadrant A | 5,522,466 | 646,772 |
| Events in quadrant B | 3,710,701 | 714,400 |
| Events in quadrant C | 4,210,608 | 637,561 |
| Events in quadrant D | 10,046,221 | 460,014 |
| Mode SS | |||
|---|---|---|---|
| Quadrant | BADHDUFLAG | Total packets | Discarded packets |
| A | 0 | 146 | 0 |
| B | 0 | 146 | 0 |
| C | 0 | 146 | 0 |
| D | 0 | 146 | 0 |
| Mode M0 | |||
|---|---|---|---|
| Quadrant | BADHDUFLAG | Total packets | Discarded packets |
| A | 0 | 21644 | 0 |
| B | 0 | 16561 | 0 |
| C | 0 | 17929 | 0 |
| D | 0 | 34984 | 2 |
| Quadrant | Total seconds | Saturated seconds | Saturation percentage |
|---|---|---|---|
| A | 7350 | 453 | 6.163265% |
| B | 7350 | 144 | 1.959184% |
| C | 7351 | 31 | 0.421711% |
| D | 7350 | 1990 | 27.074830% |
Noise dominated data is calculated using 1-second bins in cleaned event files. If a bin has >2000 counts, and if more than 50% of those come from <1% of pixels, then it is considered to be noise-dominated and hence unusable.
| Quadrant | # 1 sec bins | Bins with >0 counts | Bins with >2000 counts | High rate bins dominated by noise | Noise dominated (total time) | Noise dominated (detector-on time) | Marked lightcurve |
|---|---|---|---|---|---|---|---|
| A | 7350 | 7350 | 447 | 447 | 6.08% | 6.08% | 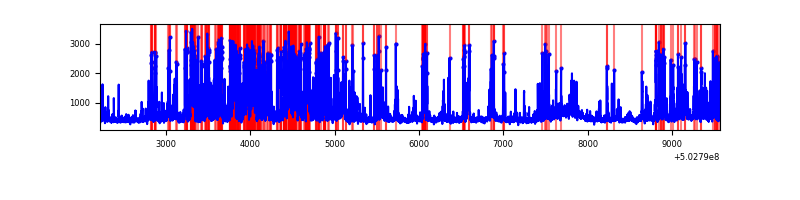 |
| B | 7350 | 7350 | 124 | 124 | 1.69% | 1.69% | 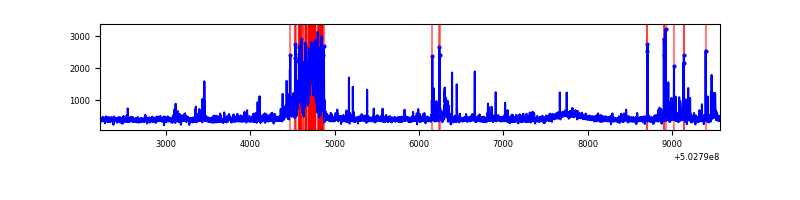 |
| C | 7351 | 7351 | 35 | 35 | 0.48% | 0.48% | 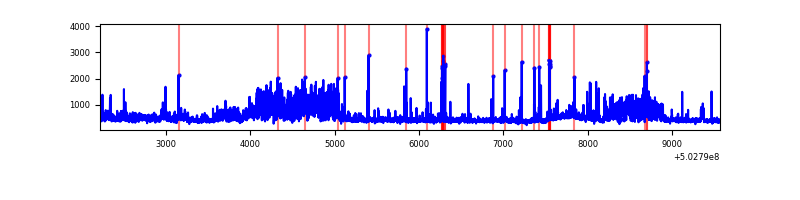 |
| D | 7350 | 7350 | 1977 | 1977 | 26.90% | 26.90% | 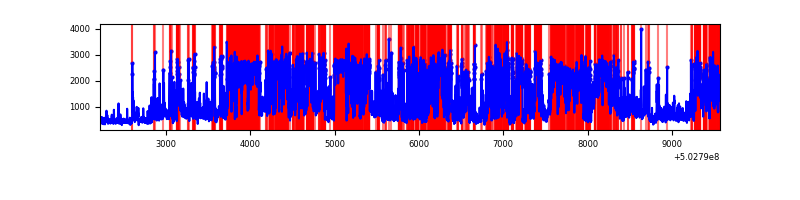 |
Top three noisy pixels from each quadrant. If the there are fewer than three noisy pixels in the level2.evt file, extra rows are filled as -1
| Pixel properties | Quadrant properties | ||||||
|---|---|---|---|---|---|---|---|
| Quadrant | DetID | PixID | Counts | Sigma | Mean | Median | Sigma |
| A | 3 | 78 | 2299780 | 12413.08 | 746 | 727 | 185.2 |
| A | 0 | 8 | 152940 | 821.83 | 746 | 727 | 185.2 |
| A | 4 | 206 | 51997 | 276.82 | 746 | 727 | 185.2 |
| B | 2 | 249 | 467376 | 2868.64 | 748 | 719 | 162.7 |
| B | 5 | 185 | 147898 | 904.74 | 748 | 719 | 162.7 |
| B | 4 | 81 | 42443 | 256.49 | 748 | 719 | 162.7 |
| C | 1 | 16 | 940796 | 4650.03 | 734 | 727 | 202.2 |
| C | 6 | 223 | 120330 | 591.61 | 734 | 727 | 202.2 |
| C | 14 | 254 | 91337 | 448.2 | 734 | 727 | 202.2 |
| D | 11 | 129 | 6403445 | 34697.51 | 649 | 619 | 184.5 |
| D | 8 | 245 | 514017 | 2782.15 | 649 | 619 | 184.5 |
| D | 3 | 12 | 195057 | 1053.68 | 649 | 619 | 184.5 |
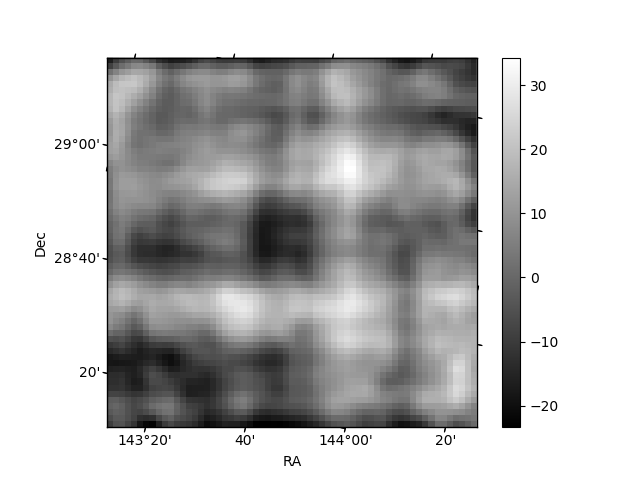
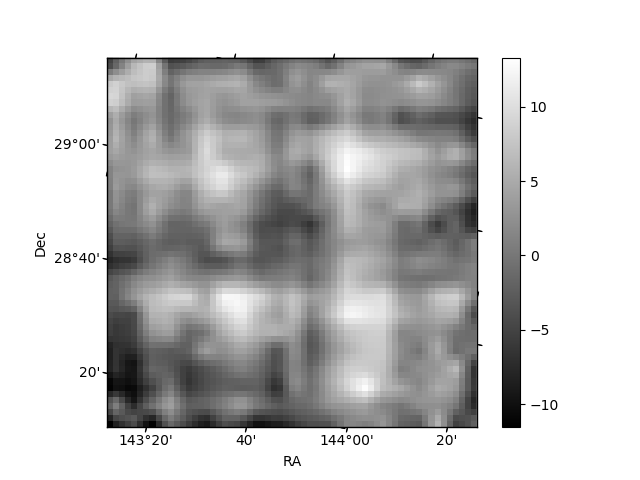
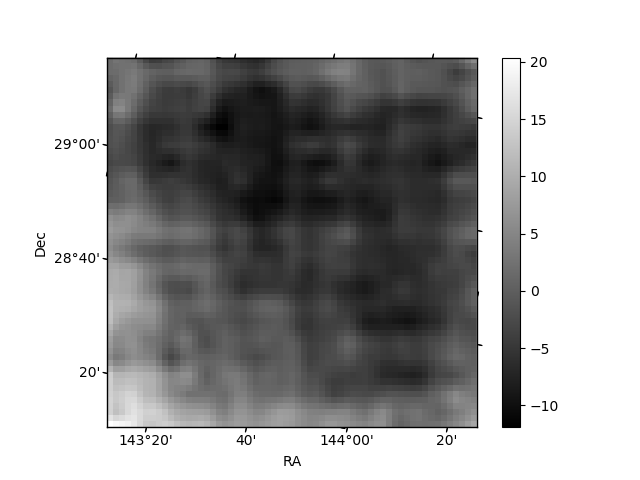
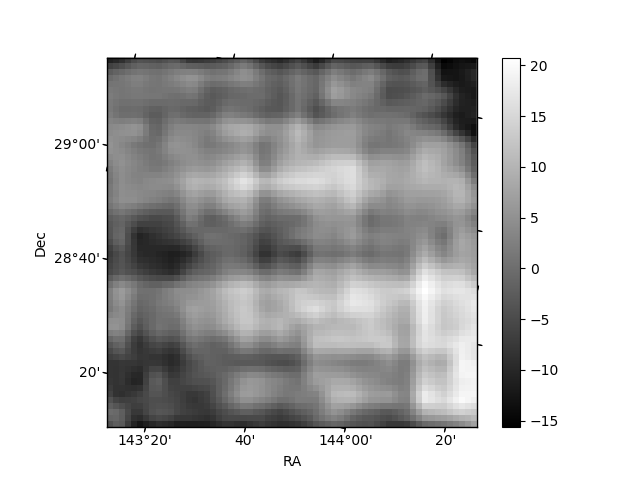
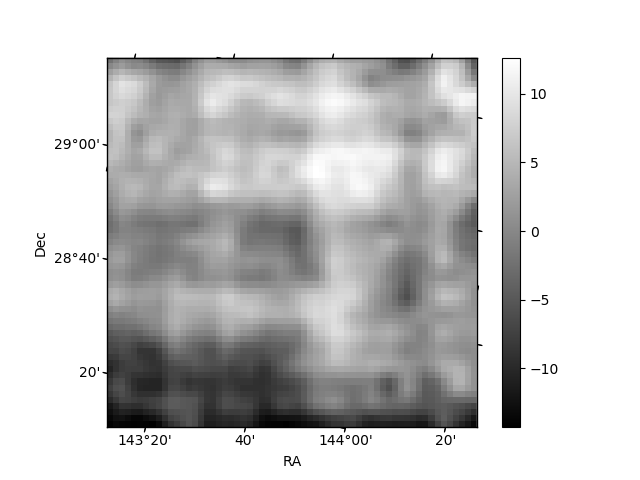
Histogram calculated using DETX and DETY for each event in the final _common_clean file
| Quadrant A | 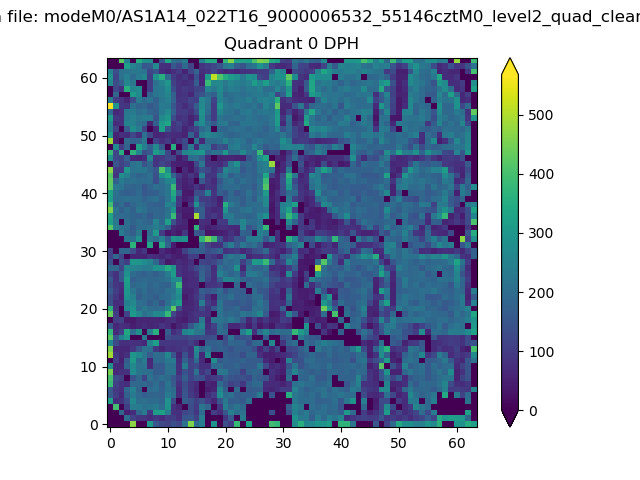 |
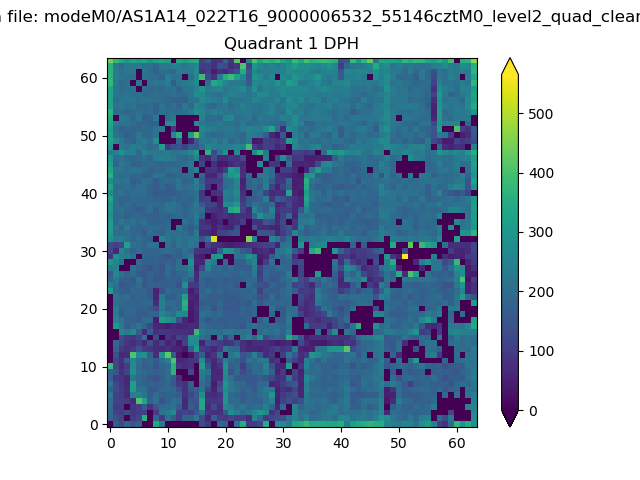 |
Quadrant B |
|---|---|---|---|
| Quadrant D | 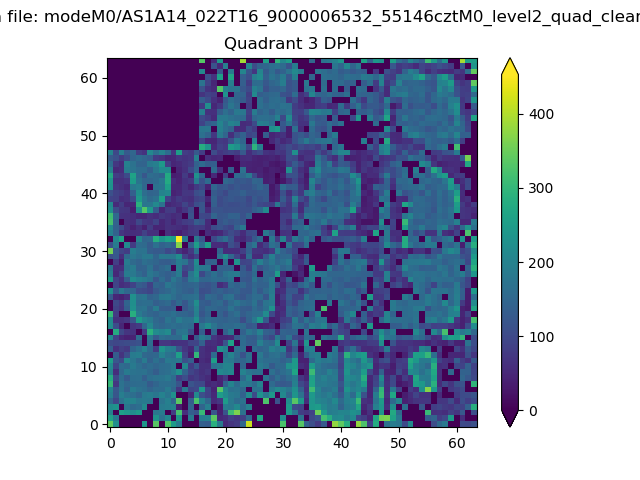 |
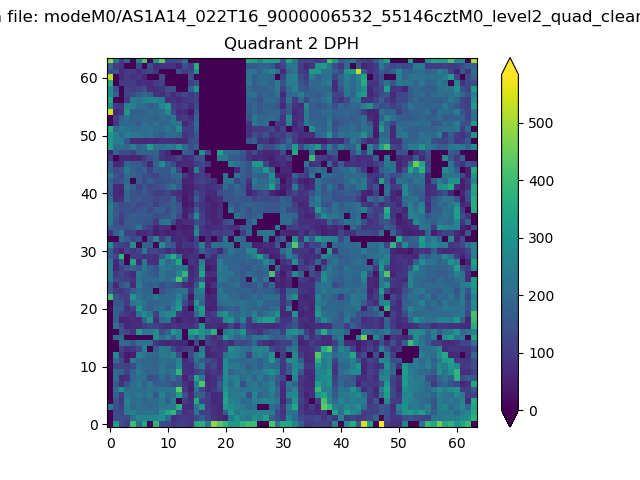 |
Quadrant C |
| Plot type | Count rate plots | Images |
|---|---|---|
| Comparison with Poisson distribution Blue bars denote a histogram of data divided into 1 sec bins. Red curve is a Poisson curve with rate = median count rate of data. |
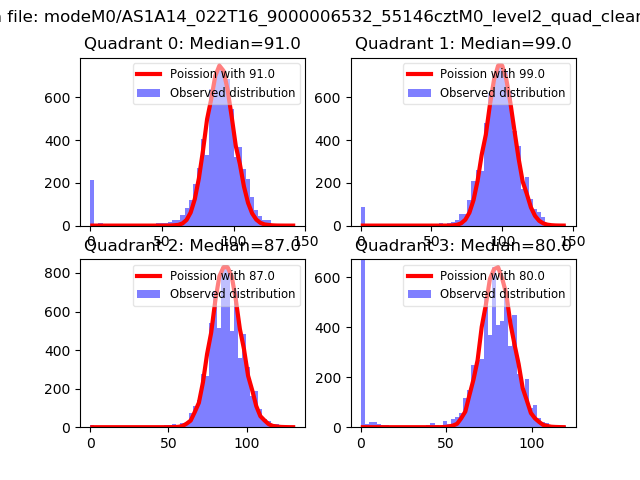 |
 |
| Quadrant-wise count rates Data is divided into 100 sec bins |
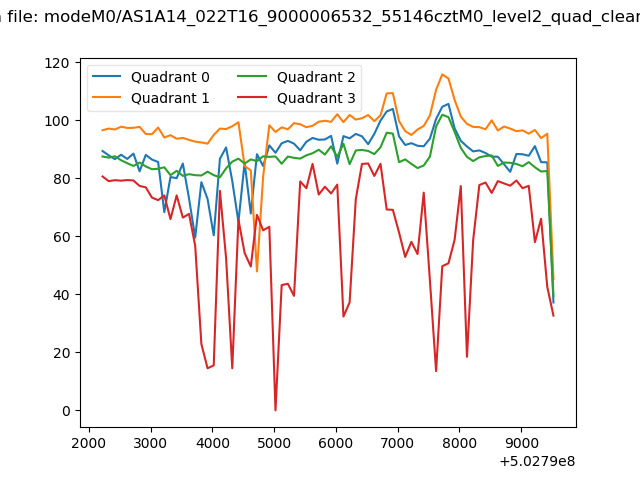 |
|
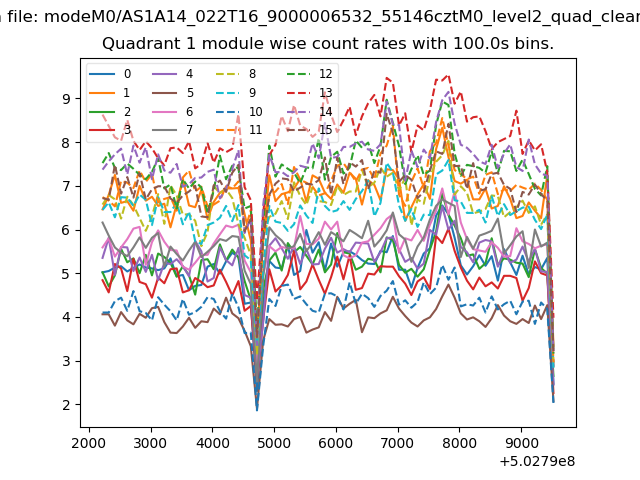
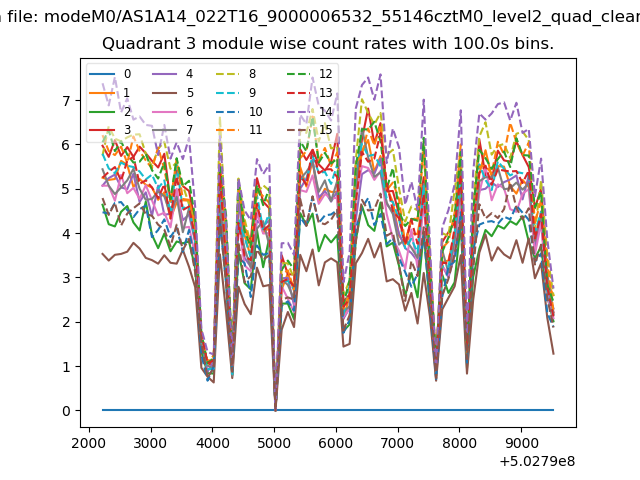
| Module-wise count rates for Quadrant A Data is divided into 100 sec bins |
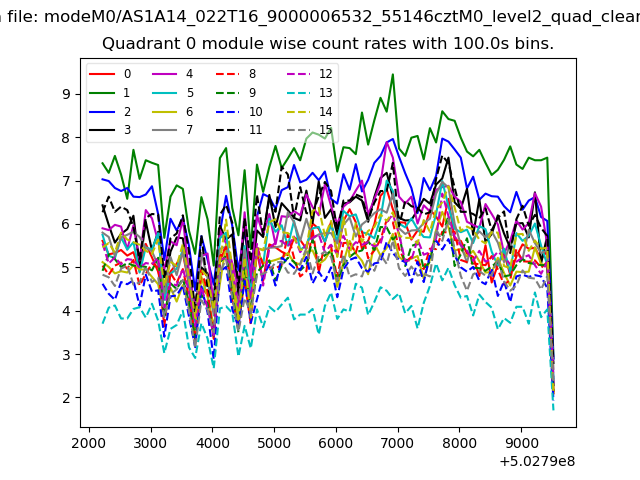 |
 |
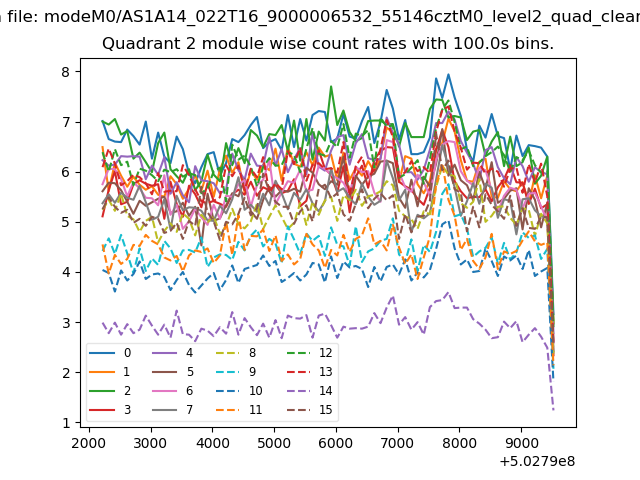
| Module-wise count rates for Quadrant B Data is divided into 100 sec bins |
 |
 |
| Module-wise count rates for Quadrant C Data is divided into 100 sec bins |
 |
 |
| Module-wise count rates for Quadrant D Data is divided into 100 sec bins |
 |
 |
| Parameter | Plot |
|---|---|
| CZT HV Monitor |  |
| D_VDD | 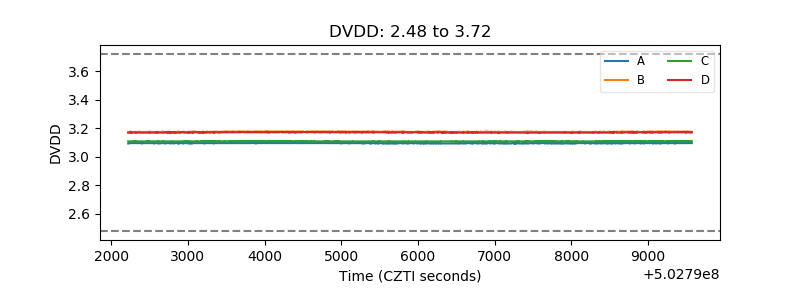 |
| Temperature 1 | 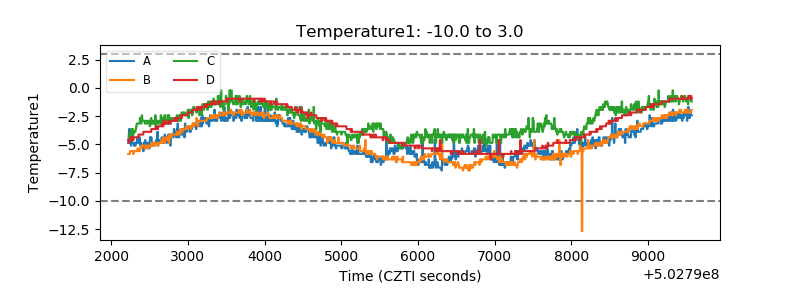 |
| Veto HV Monitor | 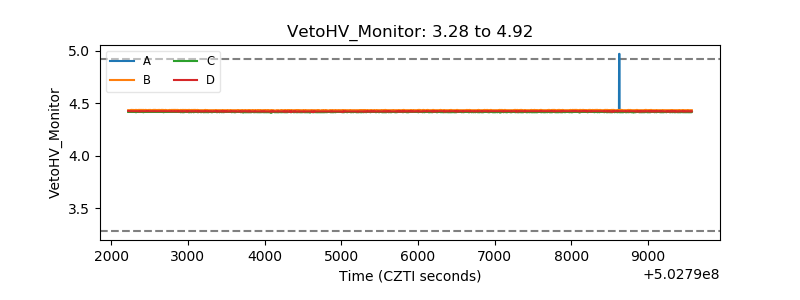 |
| Veto LLD | 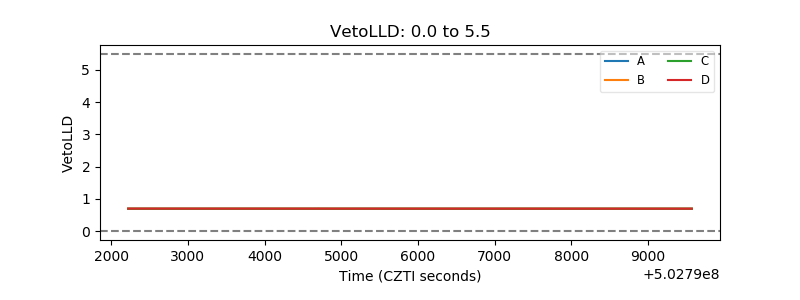 |
| Alpha Counter | 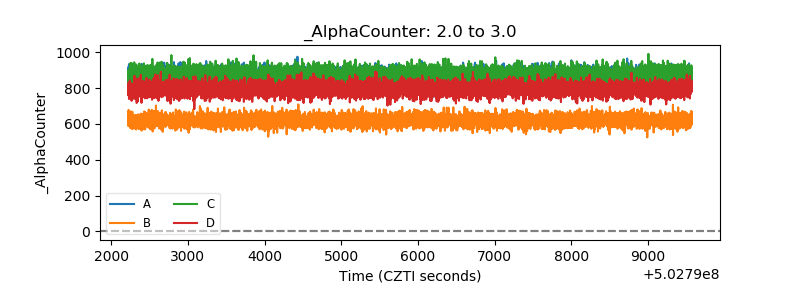 |
| _CPM_Rate | 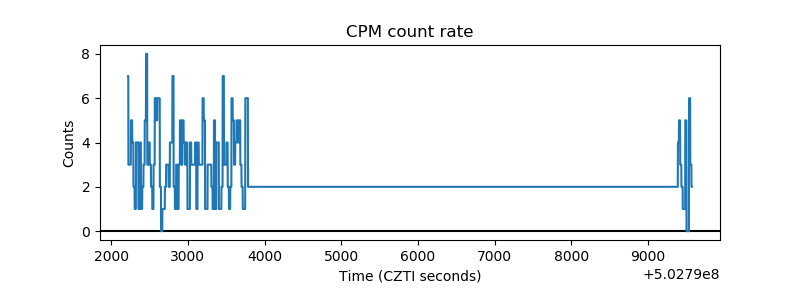 |
| CZT Counter | 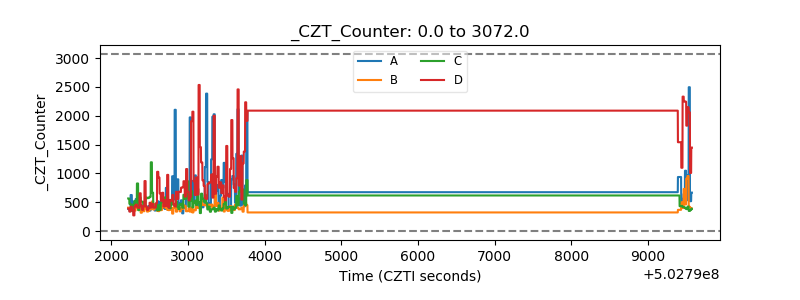 |
| +2.5 Volts monitor |  |
| +5 Volts monitor |  |
| _ROLL_ROT | 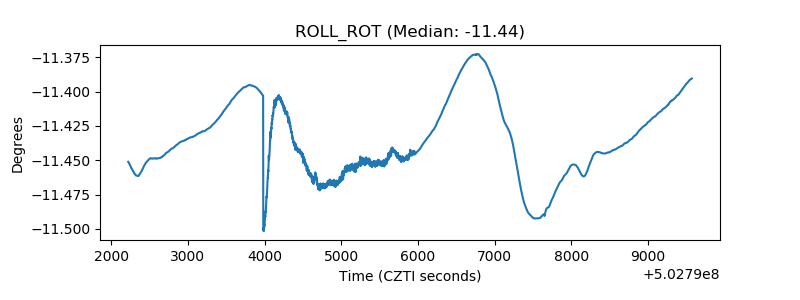 |
| _Roll_DEC | 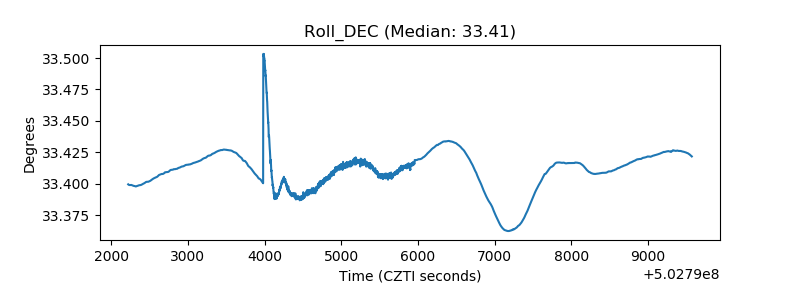 |
| _Roll_RA | 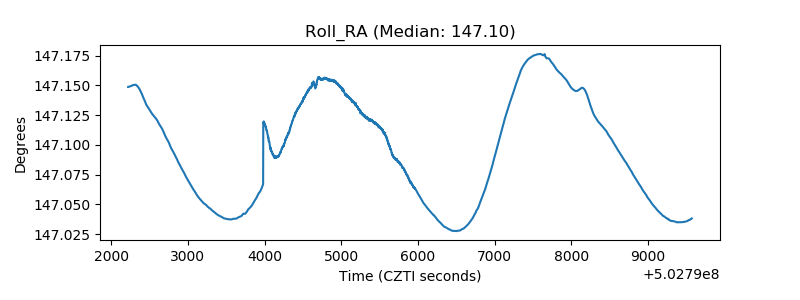 |
| Veto Counter |  |