| Param | Original file | Final file |
|---|---|---|
| Filename | modeM0/AS1A14_022T16_9000006532_55149cztM0_level2.fits | modeM0/AS1A14_022T16_9000006532_55149cztM0_level2_quad_clean.evt |
| Size (bytes) | 1,400,572,800 | 174,922,560 |
| Size | 1.3 GB | 166.8 MB |
| Events in quadrant A | 15,347,868 | 1,050,145 |
| Events in quadrant B | 8,635,763 | 1,257,428 |
| Events in quadrant C | 9,407,437 | 1,175,165 |
| Events in quadrant D | 17,388,145 | 858,944 |
| Mode SS | |||
|---|---|---|---|
| Quadrant | BADHDUFLAG | Total packets | Discarded packets |
| A | 0 | 280 | 0 |
| B | 0 | 280 | 0 |
| C | 0 | 280 | 0 |
| D | 0 | 280 | 0 |
| Mode M0 | |||
|---|---|---|---|
| Quadrant | BADHDUFLAG | Total packets | Discarded packets |
| A | 0 | 55174 | 1 |
| B | 0 | 35879 | 1 |
| C | 0 | 37901 | 1 |
| D | 0 | 61304 | 1 |
| Mode M9 | |||
|---|---|---|---|
| Quadrant | BADHDUFLAG | Total packets | Discarded packets |
| A | 0 | 2 | 0 |
| B | 0 | 2 | 0 |
| C | 0 | 2 | 0 |
| D | 0 | 2 | 0 |
| Quadrant | Total seconds | Saturated seconds | Saturation percentage |
|---|---|---|---|
| A | 13804 | 2743 | 19.871052% |
| B | 13804 | 1100 | 7.968705% |
| C | 13805 | 426 | 3.085838% |
| D | 13805 | 3436 | 24.889533% |
Noise dominated data is calculated using 1-second bins in cleaned event files. If a bin has >2000 counts, and if more than 50% of those come from <1% of pixels, then it is considered to be noise-dominated and hence unusable.
| Quadrant | # 1 sec bins | Bins with >0 counts | Bins with >2000 counts | High rate bins dominated by noise | Noise dominated (total time) | Noise dominated (detector-on time) | Marked lightcurve |
|---|---|---|---|---|---|---|---|
| A | 14059 | 13804 | 2421 | 2421 | 17.22% | 17.54% | 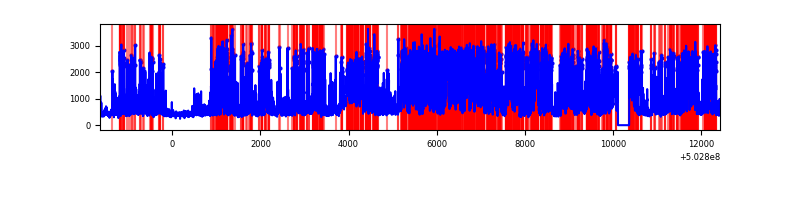 |
| B | 14059 | 13804 | 740 | 740 | 5.26% | 5.36% | 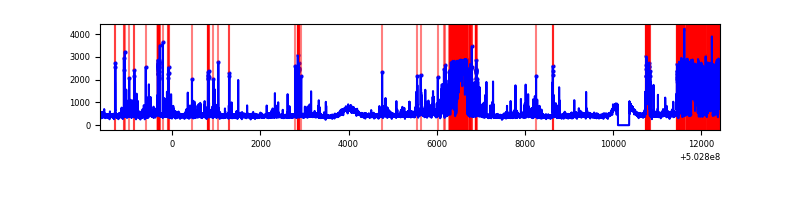 |
| C | 14060 | 13805 | 217 | 217 | 1.54% | 1.57% | 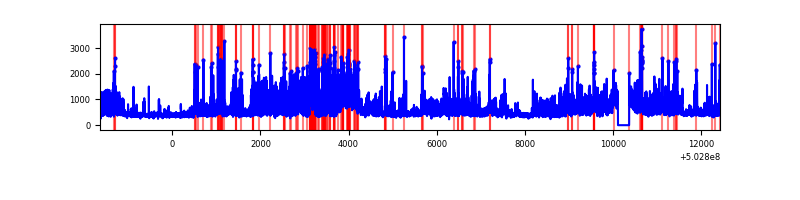 |
| D | 14059 | 13804 | 3243 | 3243 | 23.07% | 23.49% | 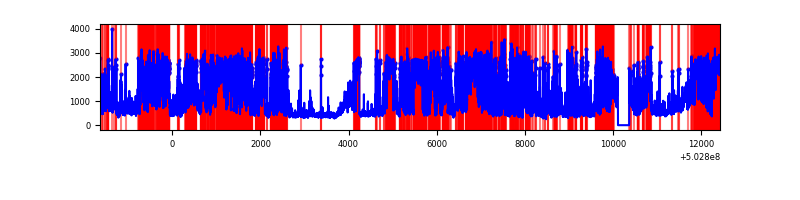 |
Top three noisy pixels from each quadrant. If the there are fewer than three noisy pixels in the level2.evt file, extra rows are filled as -1
| Pixel properties | Quadrant properties | ||||||
|---|---|---|---|---|---|---|---|
| Quadrant | DetID | PixID | Counts | Sigma | Mean | Median | Sigma |
| A | 3 | 78 | 9165296 | 27208.77 | 1361 | 1324 | 336.8 |
| A | 4 | 206 | 437713 | 1295.68 | 1361 | 1324 | 336.8 |
| A | 0 | 8 | 317733 | 939.45 | 1361 | 1324 | 336.8 |
| B | 2 | 249 | 2194012 | 7224.48 | 1409 | 1353 | 303.5 |
| B | 5 | 185 | 438998 | 1441.97 | 1409 | 1353 | 303.5 |
| B | 4 | 81 | 269191 | 882.48 | 1409 | 1353 | 303.5 |
| C | 1 | 16 | 2301968 | 5994.15 | 1417 | 1405 | 383.8 |
| C | 13 | 3 | 410082 | 1064.81 | 1417 | 1405 | 383.8 |
| C | 14 | 254 | 289788 | 751.38 | 1417 | 1405 | 383.8 |
| D | 11 | 129 | 11214140 | 31145.25 | 1279 | 1224 | 360.0 |
| D | 15 | 42 | 267168 | 738.69 | 1279 | 1224 | 360.0 |
| D | 3 | 12 | 173131 | 477.49 | 1279 | 1224 | 360.0 |
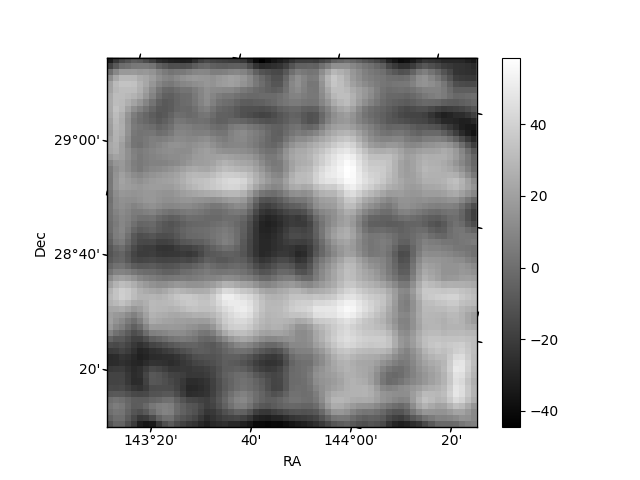
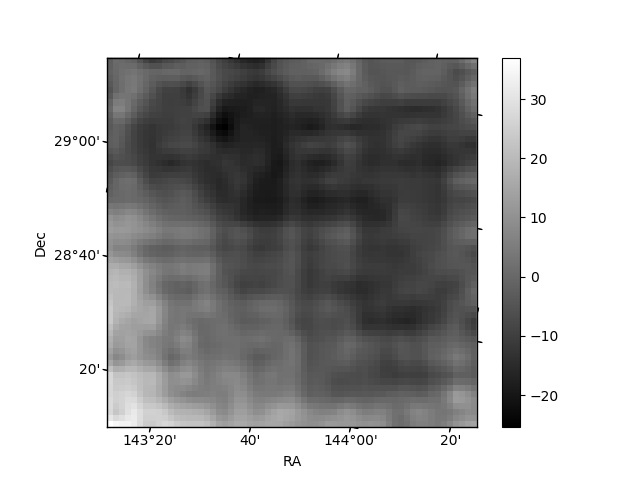
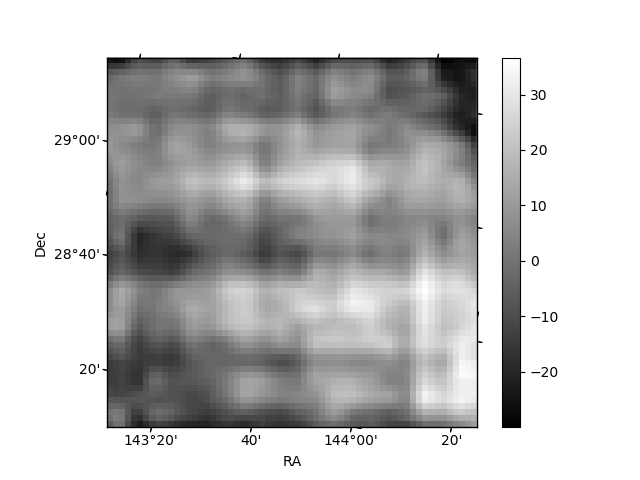
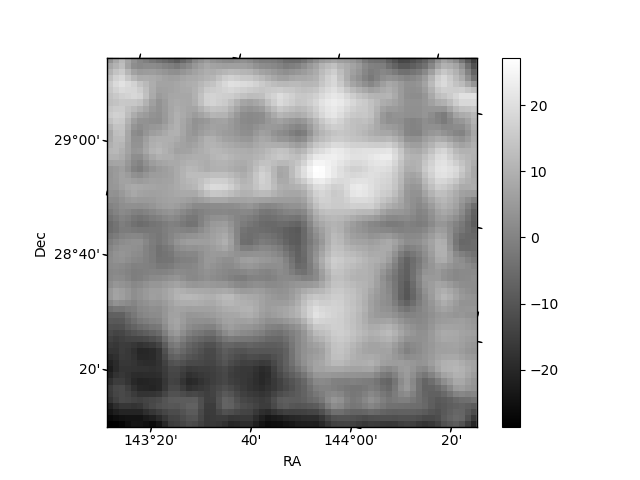
Histogram calculated using DETX and DETY for each event in the final _common_clean file
| Quadrant A | 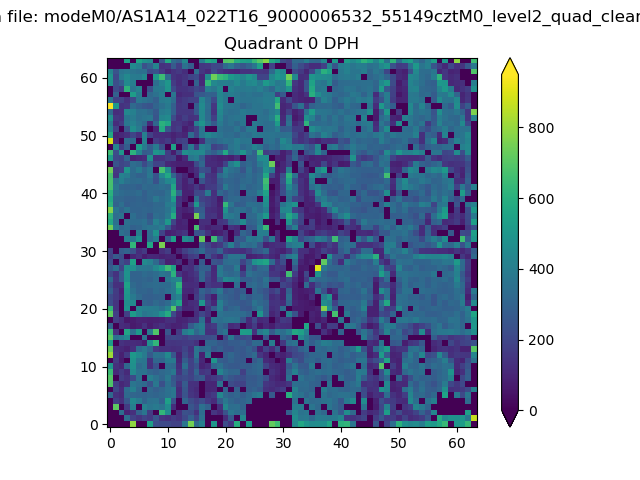 |
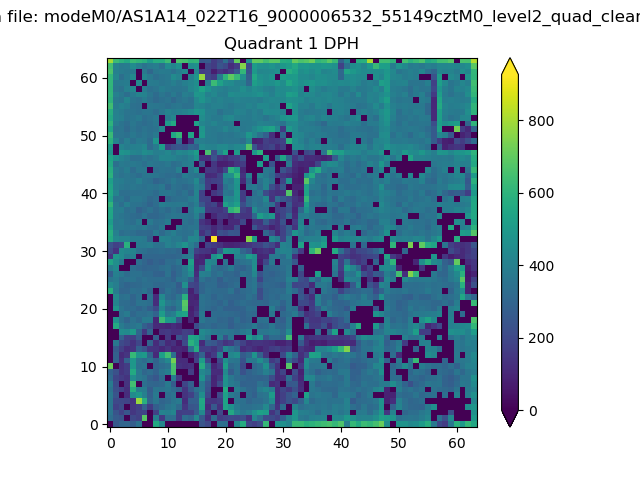 |
Quadrant B |
|---|---|---|---|
| Quadrant D | 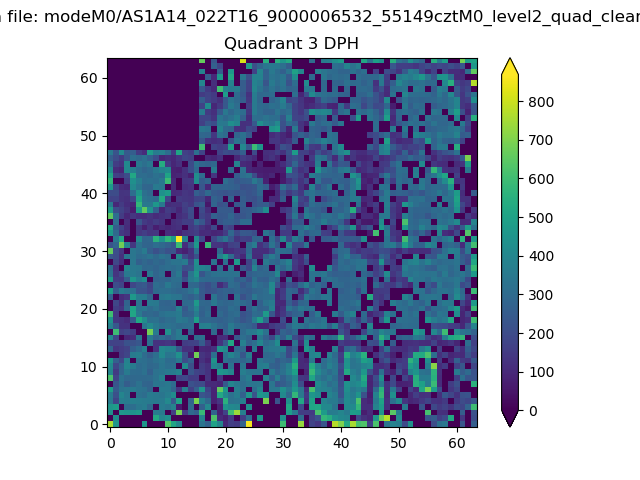 |
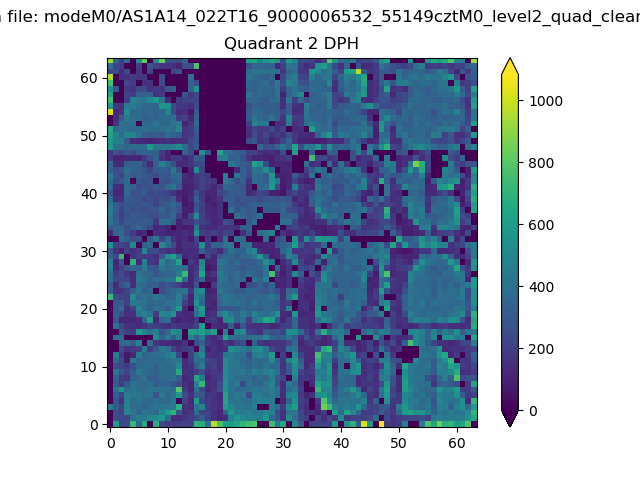 |
Quadrant C |
| Plot type | Count rate plots | Images |
|---|---|---|
| Comparison with Poisson distribution Blue bars denote a histogram of data divided into 1 sec bins. Red curve is a Poisson curve with rate = median count rate of data. |
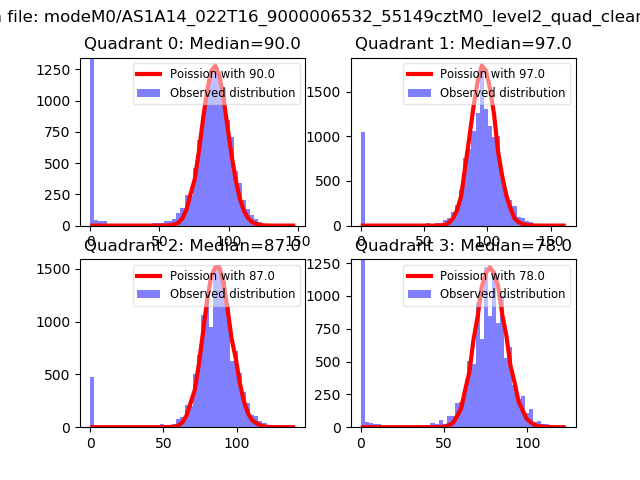 |
 |
| Quadrant-wise count rates Data is divided into 100 sec bins |
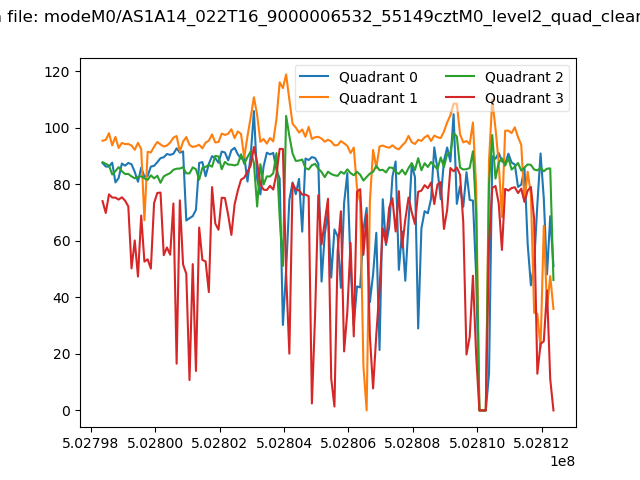 |
|
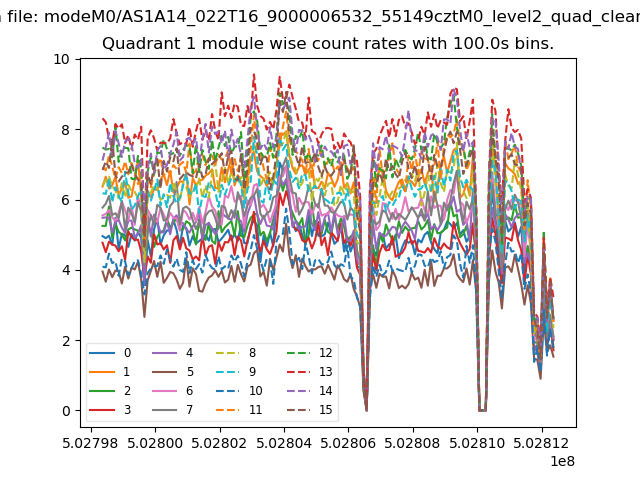
| Module-wise count rates for Quadrant A Data is divided into 100 sec bins |
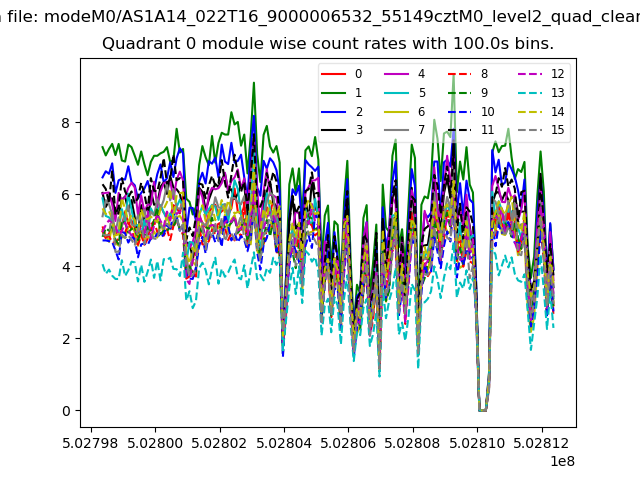 |
 |
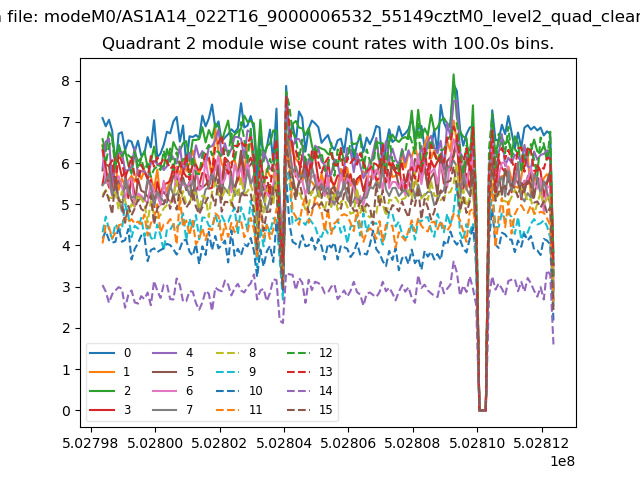
| Module-wise count rates for Quadrant B Data is divided into 100 sec bins |
 |
 |
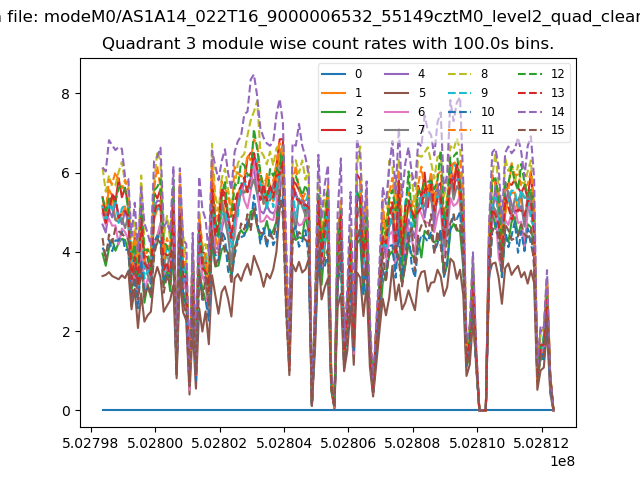
| Module-wise count rates for Quadrant C Data is divided into 100 sec bins |
 |
 |
| Module-wise count rates for Quadrant D Data is divided into 100 sec bins |
 |
 |
| Parameter | Plot |
|---|---|
| CZT HV Monitor | 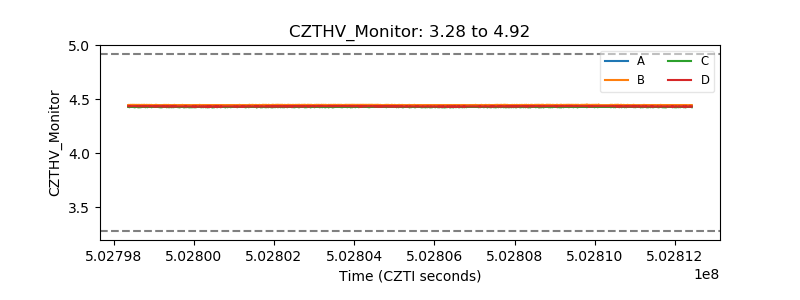 |
| D_VDD | 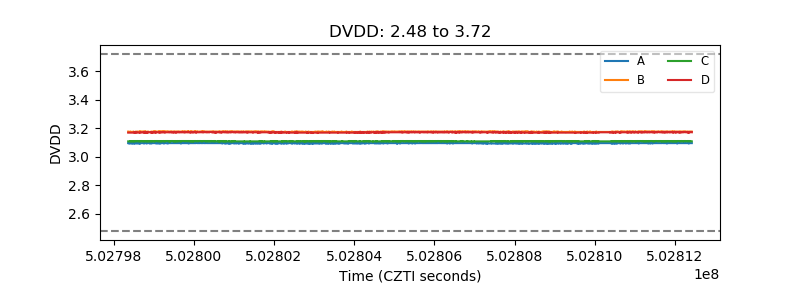 |
| Temperature 1 |  |
| Veto HV Monitor | 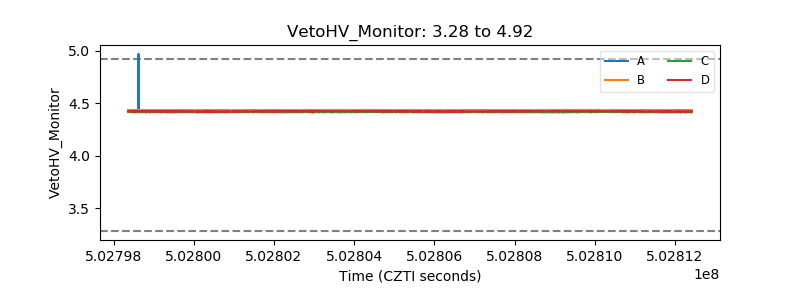 |
| Veto LLD | 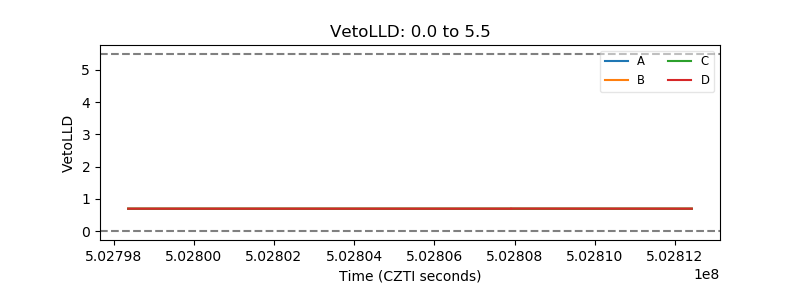 |
| Alpha Counter | 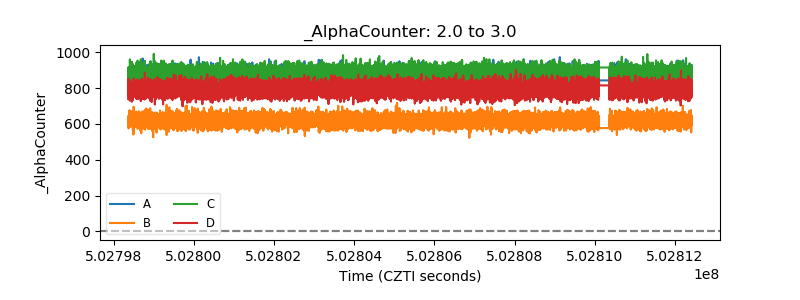 |
| _CPM_Rate | 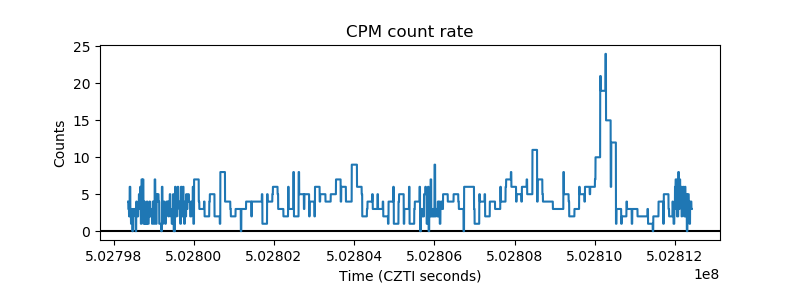 |
| CZT Counter | 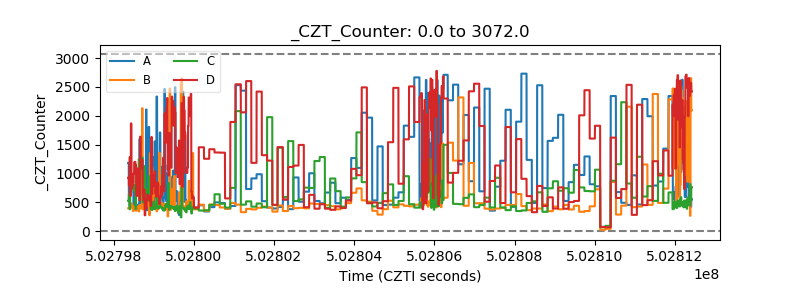 |
| +2.5 Volts monitor |  |
| +5 Volts monitor | 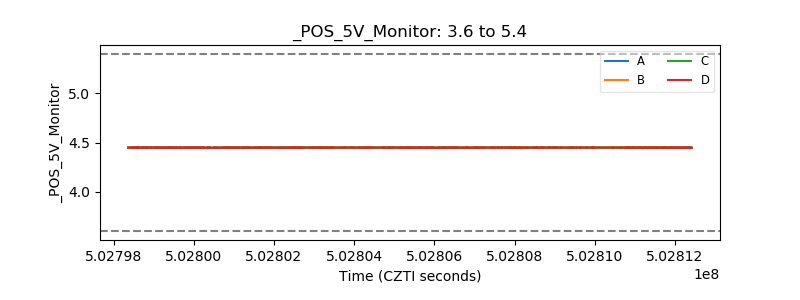 |
| _ROLL_ROT |  |
| _Roll_DEC | 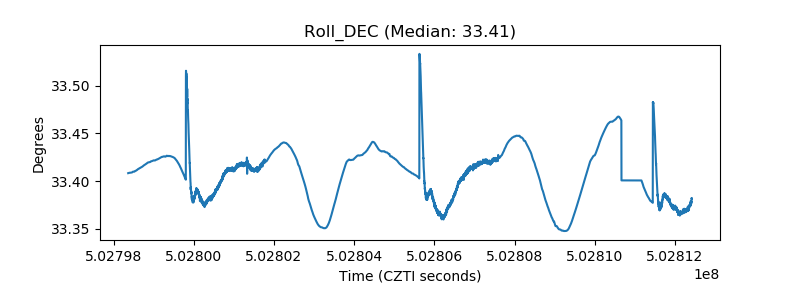 |
| _Roll_RA | 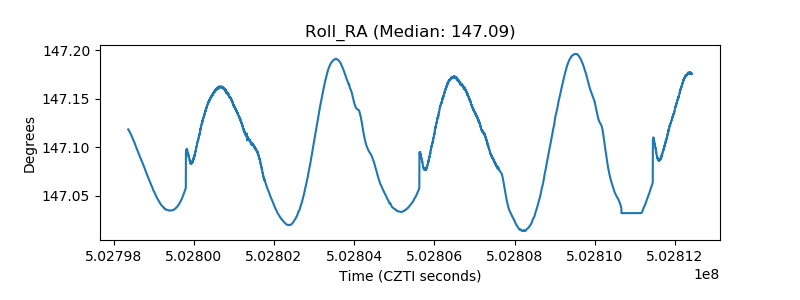 |
| Veto Counter | 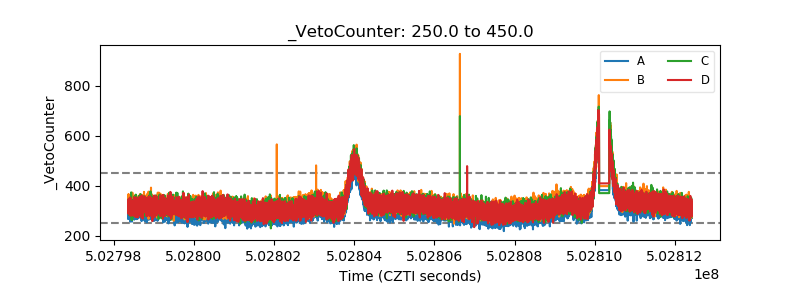 |