| Param | Original file | Final file |
|---|---|---|
| Filename | modeM0/AS1A14_022T16_9000006532_55150cztM0_level2.fits | modeM0/AS1A14_022T16_9000006532_55150cztM0_level2_quad_clean.evt |
| Size (bytes) | 1,166,523,840 | 143,884,800 |
| Size | 1.1 GB | 137.2 MB |
| Events in quadrant A | 11,006,900 | 948,686 |
| Events in quadrant B | 10,239,441 | 920,426 |
| Events in quadrant C | 6,314,381 | 995,835 |
| Events in quadrant D | 14,730,465 | 695,349 |
| Mode SS | |||
|---|---|---|---|
| Quadrant | BADHDUFLAG | Total packets | Discarded packets |
| A | 0 | 232 | 0 |
| B | 0 | 232 | 0 |
| C | 0 | 232 | 0 |
| D | 0 | 232 | 0 |
| Mode M0 | |||
|---|---|---|---|
| Quadrant | BADHDUFLAG | Total packets | Discarded packets |
| A | 0 | 40731 | 2 |
| B | 0 | 39124 | 4 |
| C | 0 | 26813 | 2 |
| D | 0 | 51881 | 2 |
| Mode M9 | |||
|---|---|---|---|
| Quadrant | BADHDUFLAG | Total packets | Discarded packets |
| A | 0 | 14 | 0 |
| B | 0 | 14 | 0 |
| C | 0 | 14 | 0 |
| D | 0 | 14 | 0 |
| Quadrant | Total seconds | Saturated seconds | Saturation percentage |
|---|---|---|---|
| A | 11507 | 1499 | 13.026853% |
| B | 11506 | 2322 | 20.180775% |
| C | 11507 | 193 | 1.677240% |
| D | 11507 | 3297 | 28.652125% |
Noise dominated data is calculated using 1-second bins in cleaned event files. If a bin has >2000 counts, and if more than 50% of those come from <1% of pixels, then it is considered to be noise-dominated and hence unusable.
| Quadrant | # 1 sec bins | Bins with >0 counts | Bins with >2000 counts | High rate bins dominated by noise | Noise dominated (total time) | Noise dominated (detector-on time) | Marked lightcurve |
|---|---|---|---|---|---|---|---|
| A | 12802 | 11507 | 1326 | 1326 | 10.36% | 11.52% | 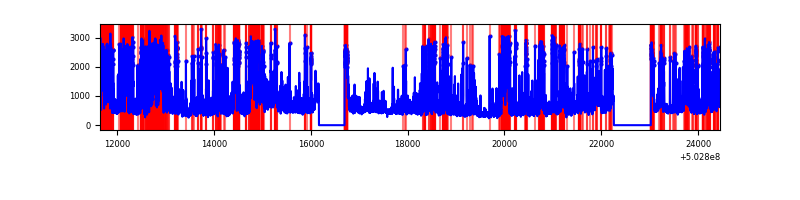 |
| B | 12801 | 11506 | 1840 | 1840 | 14.37% | 15.99% | 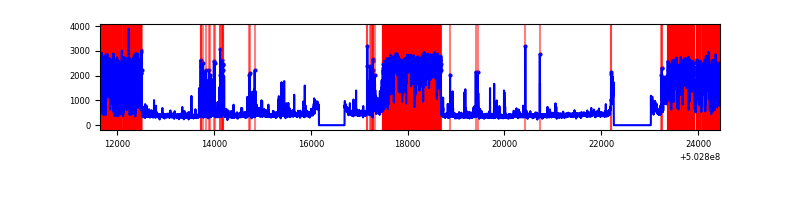 |
| C | 12802 | 11507 | 121 | 121 | 0.95% | 1.05% | 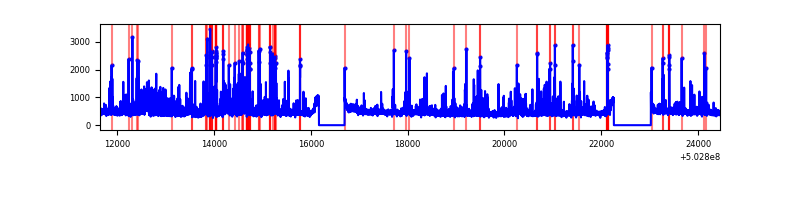 |
| D | 12802 | 11507 | 3213 | 3213 | 25.10% | 27.92% | 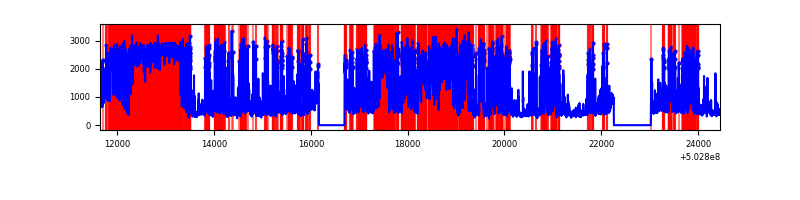 |
Top three noisy pixels from each quadrant. If the there are fewer than three noisy pixels in the level2.evt file, extra rows are filled as -1
| Pixel properties | Quadrant properties | ||||||
|---|---|---|---|---|---|---|---|
| Quadrant | DetID | PixID | Counts | Sigma | Mean | Median | Sigma |
| A | 3 | 78 | 6276636 | 21912.21 | 1153 | 1126 | 286.4 |
| A | 0 | 8 | 142199 | 492.58 | 1153 | 1126 | 286.4 |
| A | 4 | 3 | 35442 | 119.82 | 1153 | 1126 | 286.4 |
| B | 2 | 249 | 5137735 | 21762.79 | 1093 | 1051 | 236.0 |
| B | 5 | 185 | 348723 | 1473.0 | 1093 | 1051 | 236.0 |
| B | 5 | 172 | 227828 | 960.79 | 1093 | 1051 | 236.0 |
| C | 1 | 16 | 473989 | 1469.41 | 1177 | 1164 | 321.8 |
| C | 10 | 22 | 317128 | 981.93 | 1177 | 1164 | 321.8 |
| C | 13 | 3 | 304747 | 943.45 | 1177 | 1164 | 321.8 |
| D | 11 | 129 | 9759155 | 34079.15 | 1012 | 966 | 286.3 |
| D | 3 | 12 | 379312 | 1321.32 | 1012 | 966 | 286.3 |
| D | 11 | 176 | 153251 | 531.83 | 1012 | 966 | 286.3 |
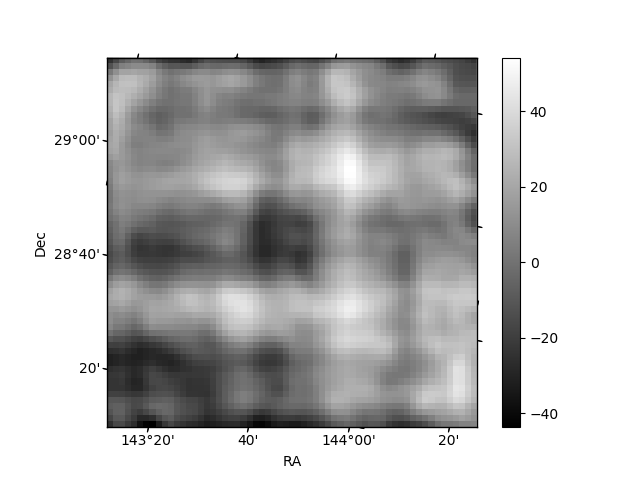
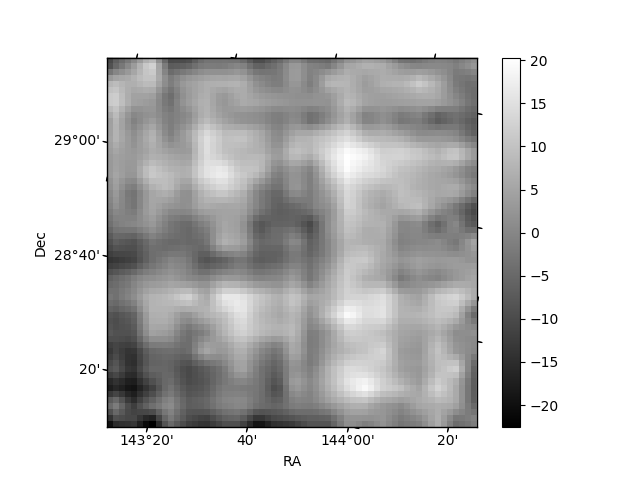
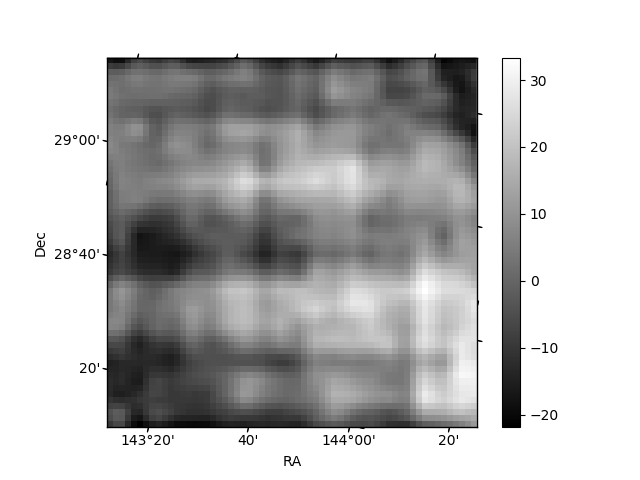
Histogram calculated using DETX and DETY for each event in the final _common_clean file
| Quadrant A | 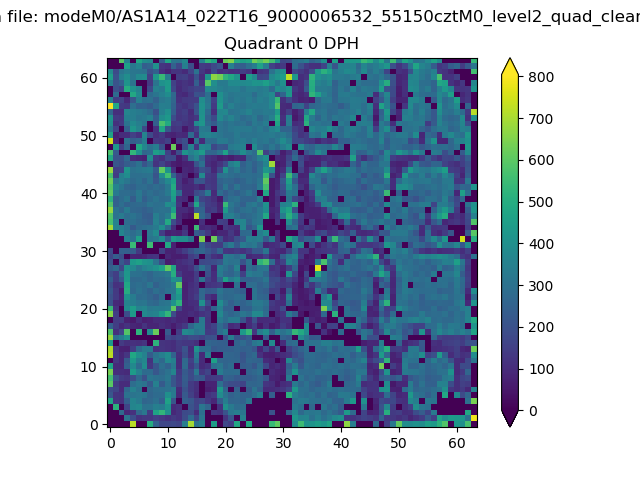 |
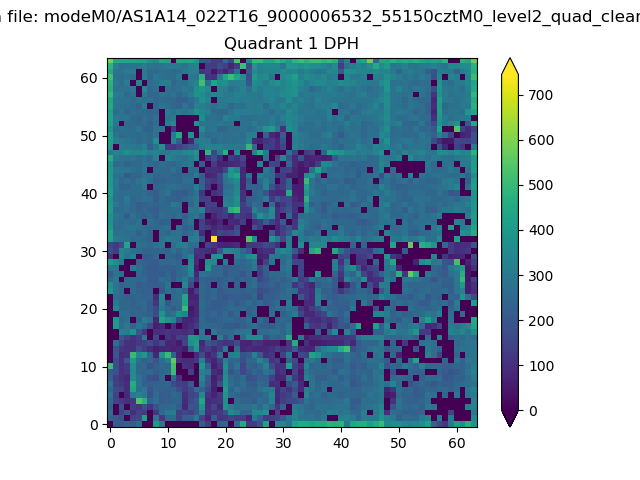 |
Quadrant B |
|---|---|---|---|
| Quadrant D | 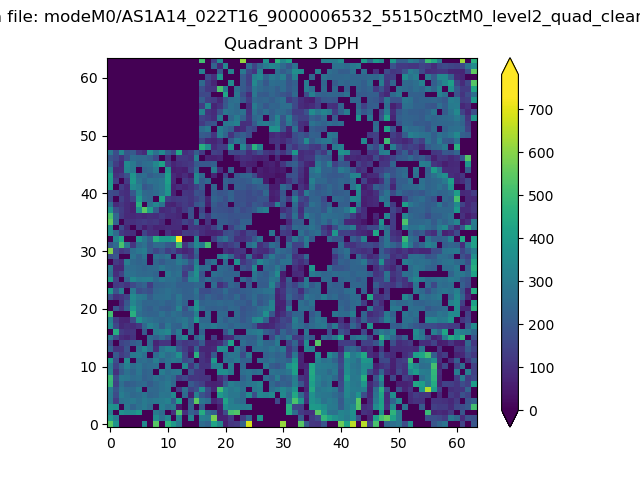 |
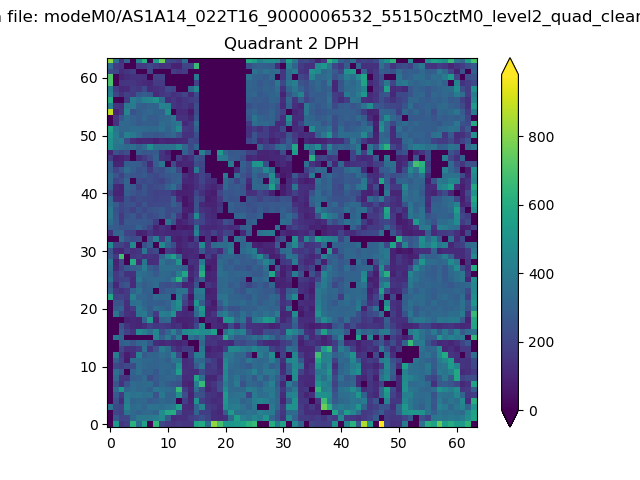 |
Quadrant C |
| Plot type | Count rate plots | Images |
|---|---|---|
| Comparison with Poisson distribution Blue bars denote a histogram of data divided into 1 sec bins. Red curve is a Poisson curve with rate = median count rate of data. |
 |
 |
| Quadrant-wise count rates Data is divided into 100 sec bins |
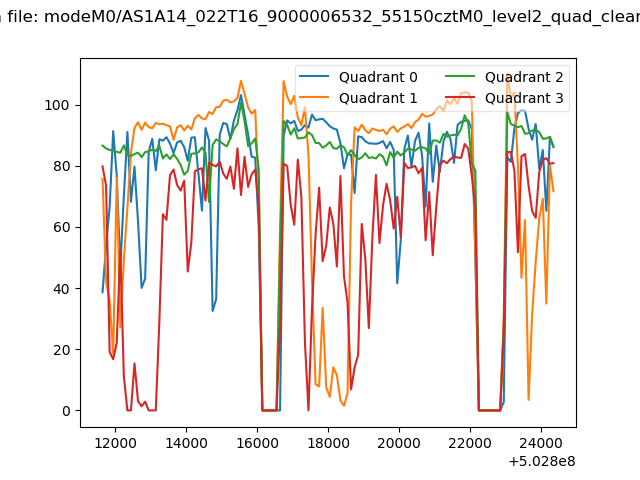 |
|
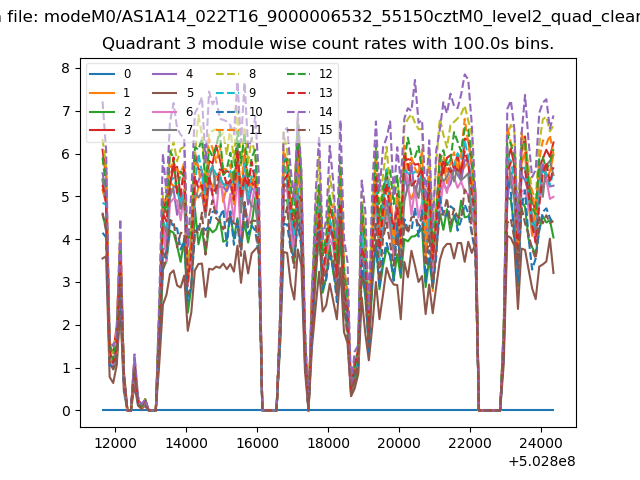
| Module-wise count rates for Quadrant A Data is divided into 100 sec bins |
 |
 |
| Module-wise count rates for Quadrant B Data is divided into 100 sec bins |
 |
 |
| Module-wise count rates for Quadrant C Data is divided into 100 sec bins |
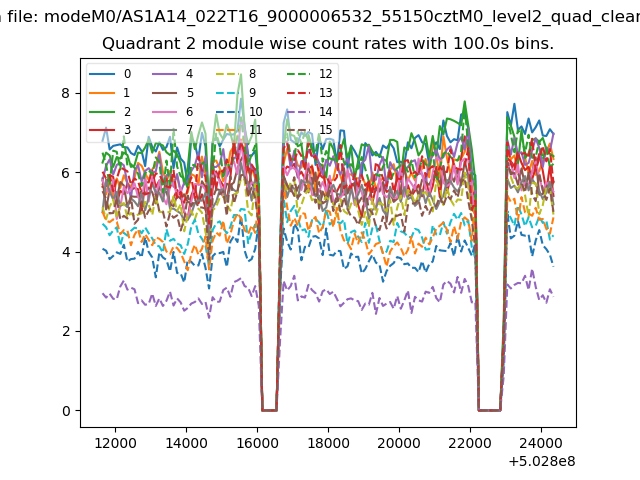 |
 |
| Module-wise count rates for Quadrant D Data is divided into 100 sec bins |
 |
 |
| Parameter | Plot |
|---|---|
| CZT HV Monitor | 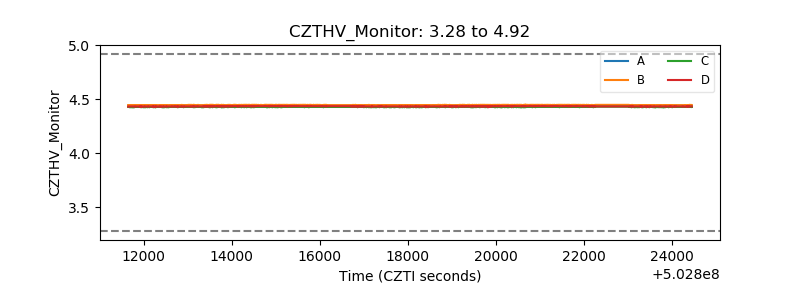 |
| D_VDD | 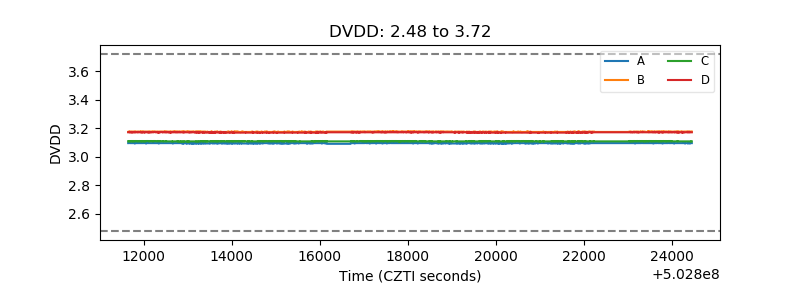 |
| Temperature 1 | 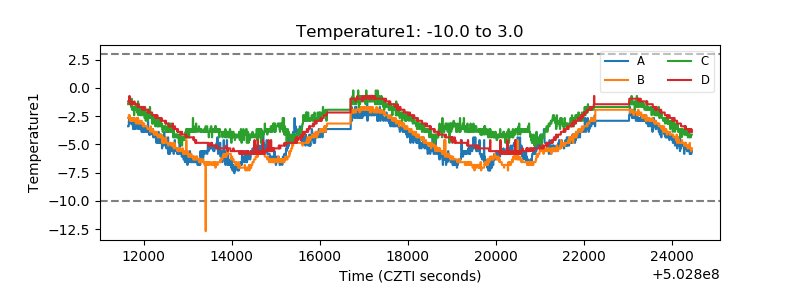 |
| Veto HV Monitor | 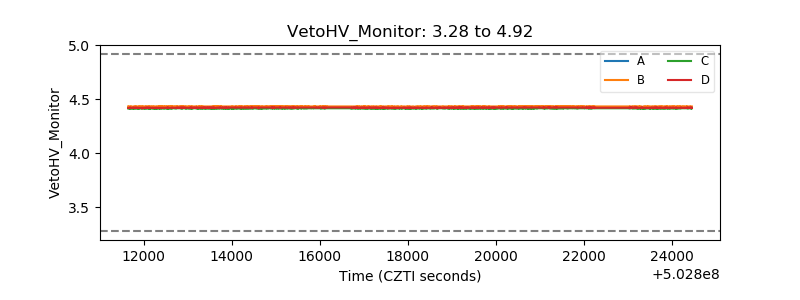 |
| Veto LLD | 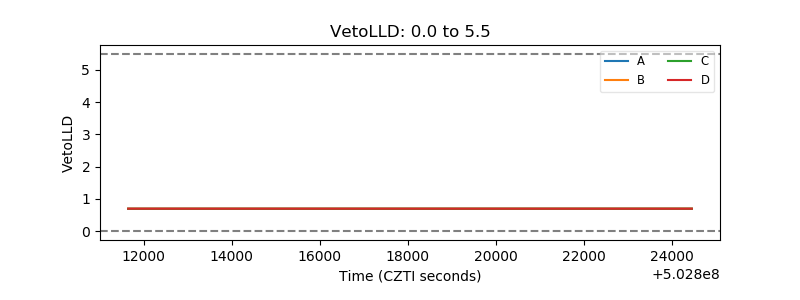 |
| Alpha Counter | 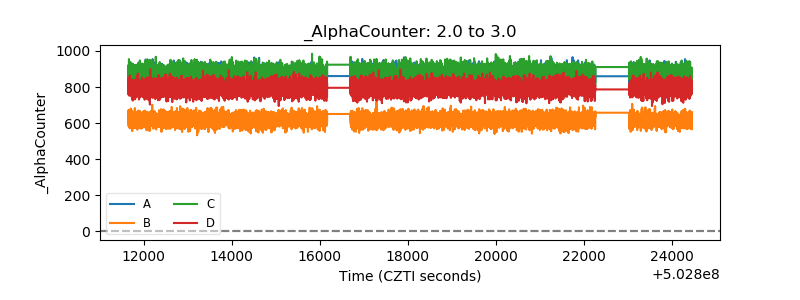 |
| _CPM_Rate | 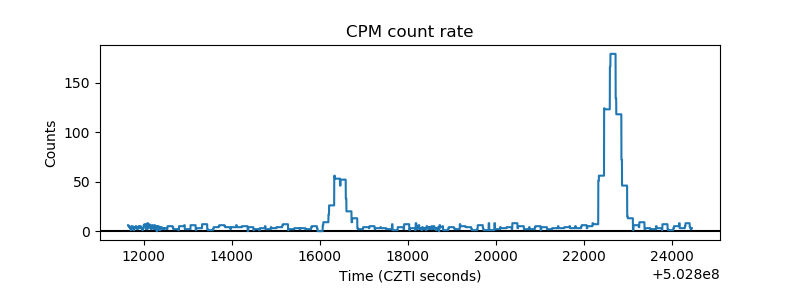 |
| CZT Counter | 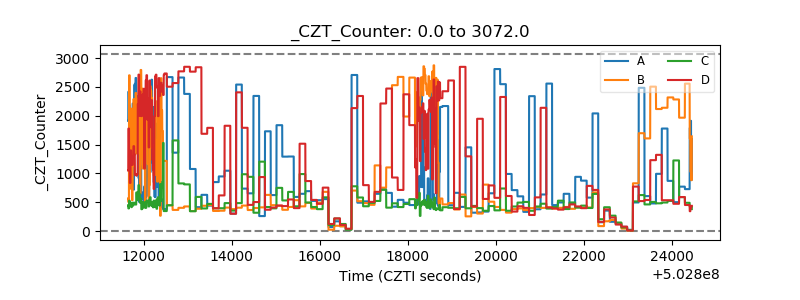 |
| +2.5 Volts monitor |  |
| +5 Volts monitor |  |
| _ROLL_ROT | 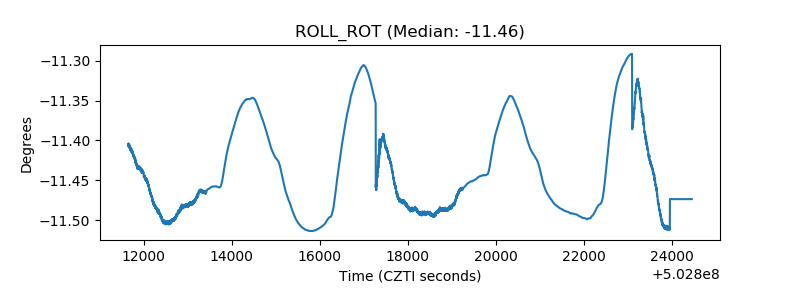 |
| _Roll_DEC | 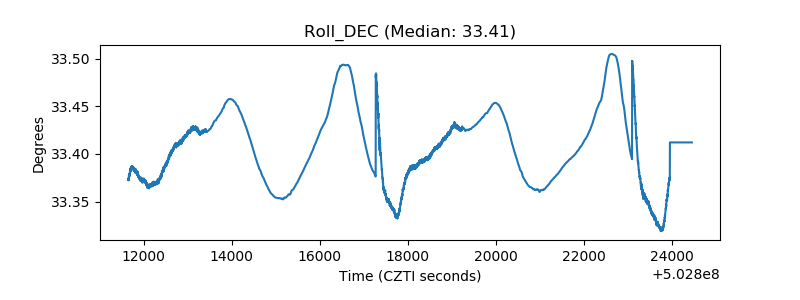 |
| _Roll_RA | 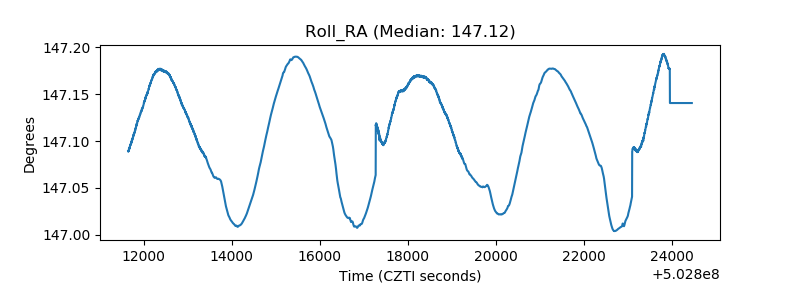 |
| Veto Counter |  |