| Param | Original file | Final file |
|---|---|---|
| Filename | modeM0/AS1A14_022T16_9000006532_55151cztM0_level2.fits | modeM0/AS1A14_022T16_9000006532_55151cztM0_level2_quad_clean.evt |
| Size (bytes) | 583,542,720 | 92,185,920 |
| Size | 556.5 MB | 87.9 MB |
| Events in quadrant A | 6,596,917 | 589,274 |
| Events in quadrant B | 5,807,910 | 588,079 |
| Events in quadrant C | 3,818,002 | 599,426 |
| Events in quadrant D | 4,849,612 | 539,853 |
| Mode SS | |||
|---|---|---|---|
| Quadrant | BADHDUFLAG | Total packets | Discarded packets |
| A | 0 | 140 | 0 |
| B | 0 | 140 | 0 |
| C | 0 | 140 | 0 |
| D | 0 | 140 | 0 |
| Mode M0 | |||
|---|---|---|---|
| Quadrant | BADHDUFLAG | Total packets | Discarded packets |
| A | 0 | 24262 | 2 |
| B | 0 | 22359 | 2 |
| C | 0 | 16271 | 2 |
| D | 0 | 19452 | 7 |
| Mode M9 | |||
|---|---|---|---|
| Quadrant | BADHDUFLAG | Total packets | Discarded packets |
| A | 0 | 16 | 0 |
| B | 0 | 17 | 0 |
| C | 0 | 17 | 0 |
| D | 0 | 17 | 0 |
| Quadrant | Total seconds | Saturated seconds | Saturation percentage |
|---|---|---|---|
| A | 6807 | 815 | 11.972969% |
| B | 6807 | 1074 | 15.777876% |
| C | 6807 | 157 | 2.306449% |
| D | 6806 | 547 | 8.037026% |
Noise dominated data is calculated using 1-second bins in cleaned event files. If a bin has >2000 counts, and if more than 50% of those come from <1% of pixels, then it is considered to be noise-dominated and hence unusable.
| Quadrant | # 1 sec bins | Bins with >0 counts | Bins with >2000 counts | High rate bins dominated by noise | Noise dominated (total time) | Noise dominated (detector-on time) | Marked lightcurve |
|---|---|---|---|---|---|---|---|
| A | 7712 | 6807 | 733 | 733 | 9.50% | 10.77% | 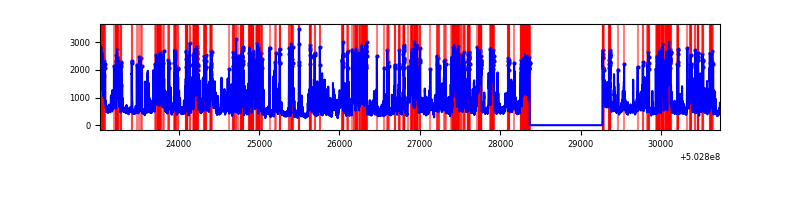 |
| B | 7712 | 6807 | 842 | 842 | 10.92% | 12.37% | 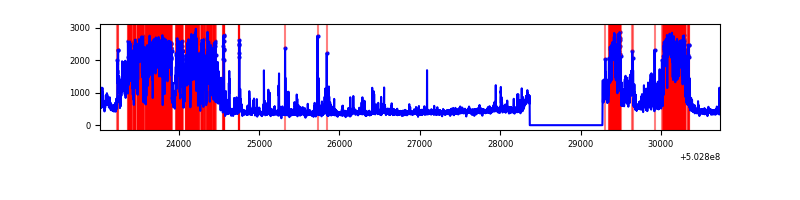 |
| C | 7712 | 6807 | 105 | 105 | 1.36% | 1.54% | 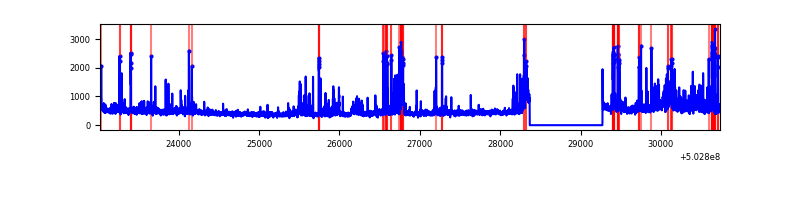 |
| D | 7710 | 6805 | 490 | 490 | 6.36% | 7.20% | 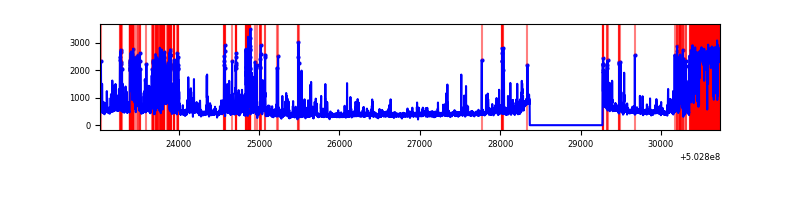 |
Top three noisy pixels from each quadrant. If the there are fewer than three noisy pixels in the level2.evt file, extra rows are filled as -1
| Pixel properties | Quadrant properties | ||||||
|---|---|---|---|---|---|---|---|
| Quadrant | DetID | PixID | Counts | Sigma | Mean | Median | Sigma |
| A | 3 | 78 | 3469070 | 19893.36 | 696 | 678 | 174.3 |
| A | 0 | 8 | 369798 | 2117.13 | 696 | 678 | 174.3 |
| A | 4 | 78 | 29809 | 167.08 | 696 | 678 | 174.3 |
| B | 2 | 249 | 2746446 | 18678.93 | 681 | 655 | 147.0 |
| B | 4 | 81 | 198276 | 1344.37 | 681 | 655 | 147.0 |
| B | 5 | 185 | 42412 | 284.06 | 681 | 655 | 147.0 |
| C | 13 | 3 | 283463 | 1451.74 | 704 | 696 | 194.8 |
| C | 9 | 38 | 224868 | 1150.91 | 704 | 696 | 194.8 |
| C | 6 | 223 | 165813 | 847.72 | 704 | 696 | 194.8 |
| D | 11 | 129 | 1684294 | 8600.61 | 686 | 655 | 195.8 |
| D | 11 | 176 | 182185 | 927.32 | 686 | 655 | 195.8 |
| D | 3 | 12 | 107744 | 547.05 | 686 | 655 | 195.8 |
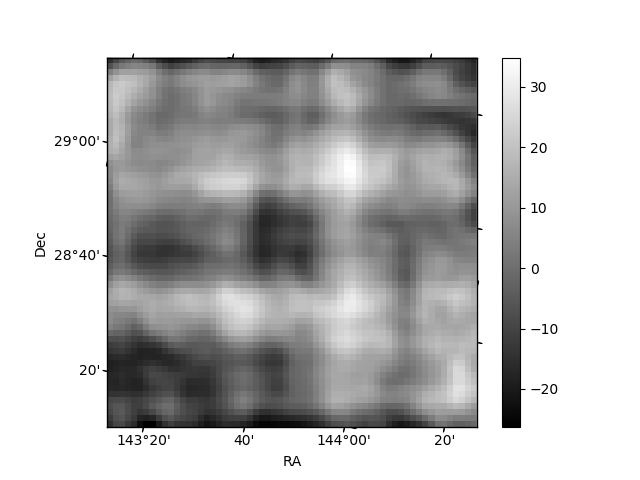
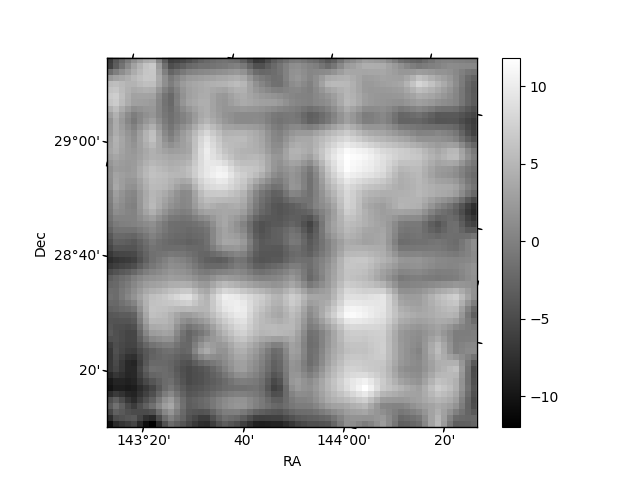
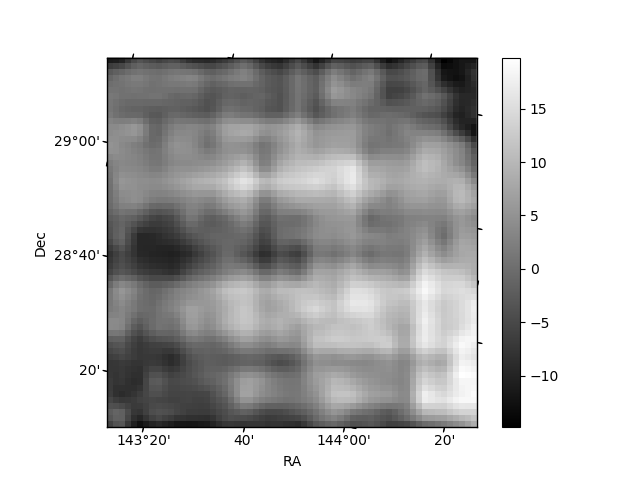
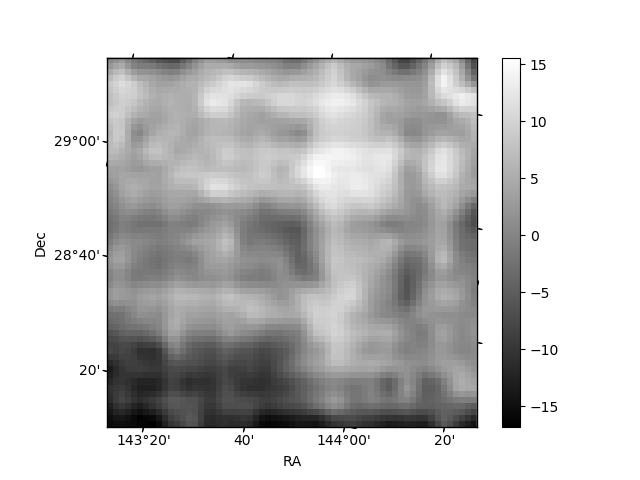
Histogram calculated using DETX and DETY for each event in the final _common_clean file
| Quadrant A | 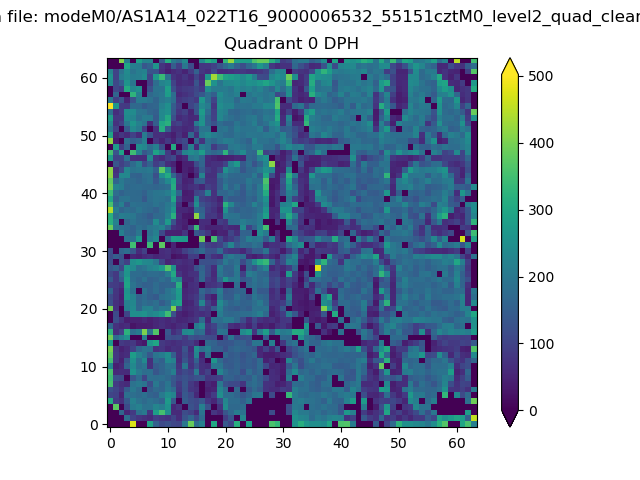 |
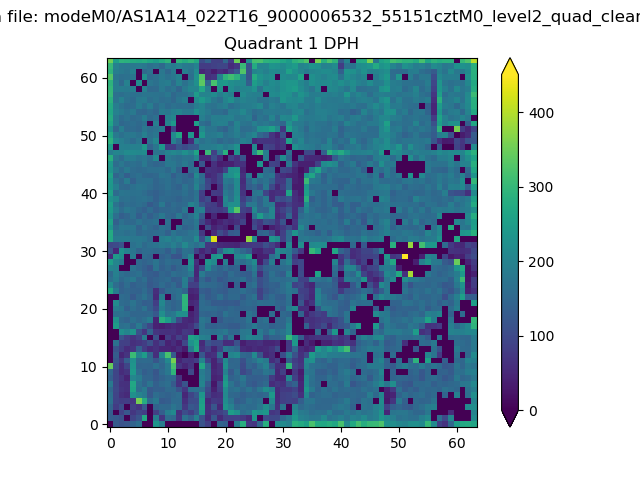 |
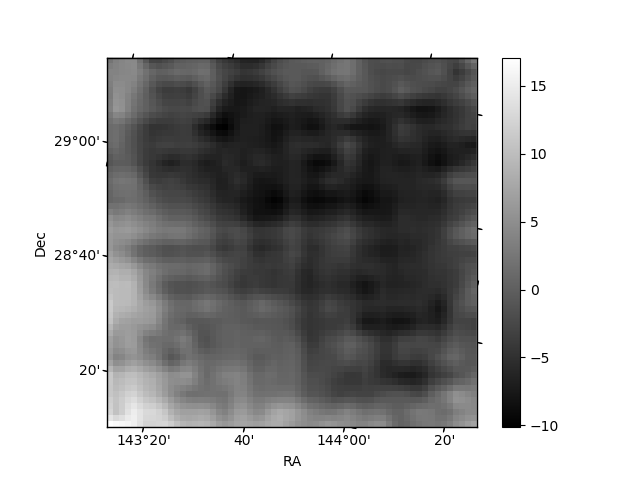
Quadrant B |
|---|---|---|---|
| Quadrant D | 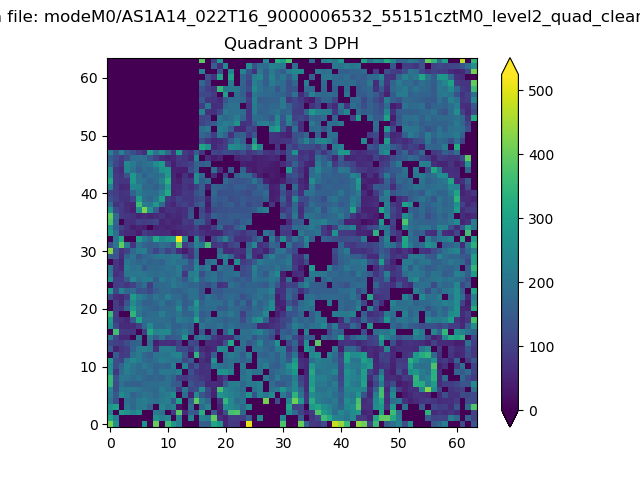 |
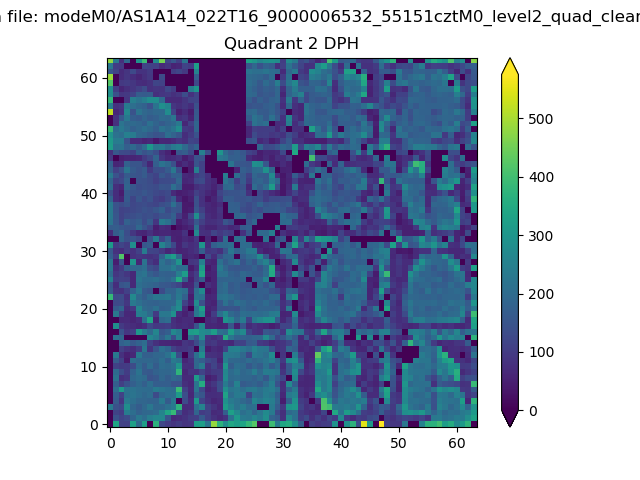 |
Quadrant C |
| Plot type | Count rate plots | Images |
|---|---|---|
| Comparison with Poisson distribution Blue bars denote a histogram of data divided into 1 sec bins. Red curve is a Poisson curve with rate = median count rate of data. |
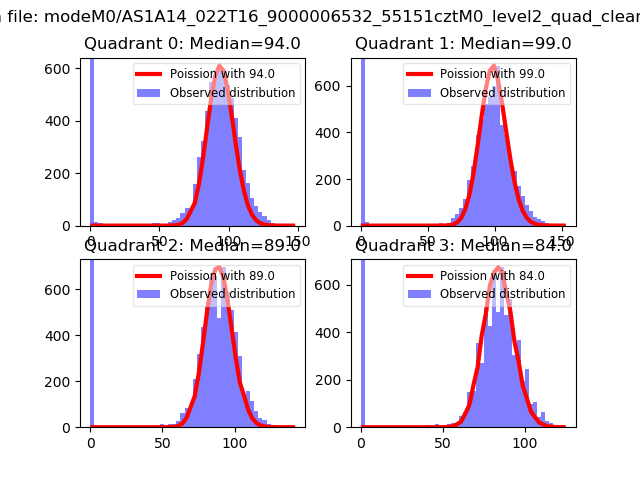 |
 |
| Quadrant-wise count rates Data is divided into 100 sec bins |
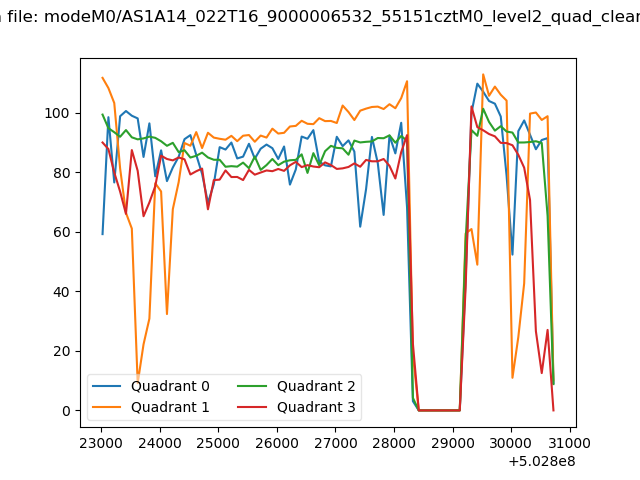 |
|
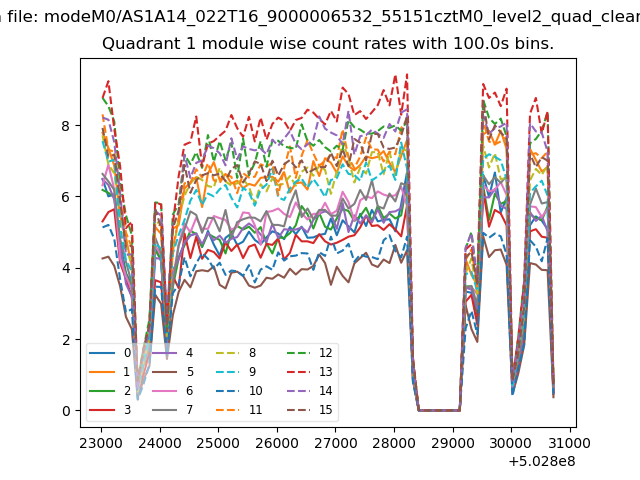
| Module-wise count rates for Quadrant A Data is divided into 100 sec bins |
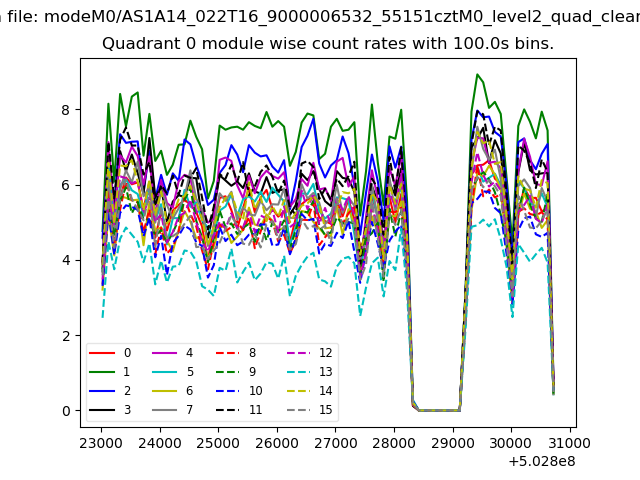 |
 |
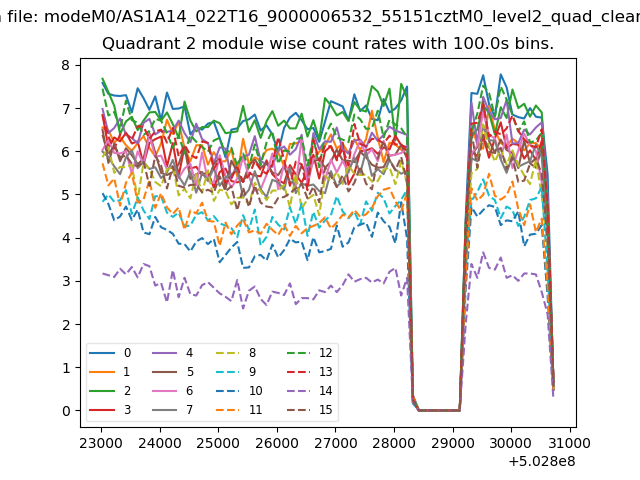
| Module-wise count rates for Quadrant B Data is divided into 100 sec bins |
 |
 |
| Module-wise count rates for Quadrant C Data is divided into 100 sec bins |
 |
 |
| Module-wise count rates for Quadrant D Data is divided into 100 sec bins |
 |
 |
| Parameter | Plot |
|---|---|
| CZT HV Monitor | 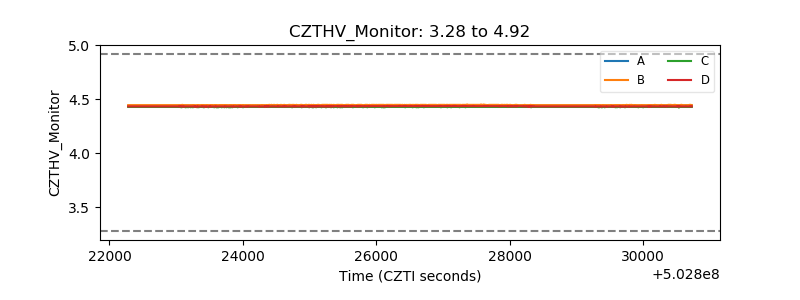 |
| D_VDD | 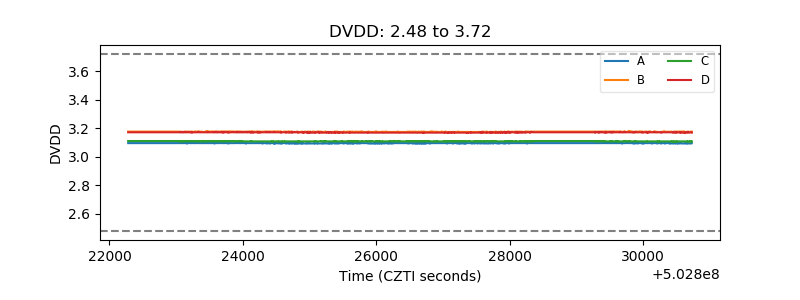 |
| Temperature 1 | 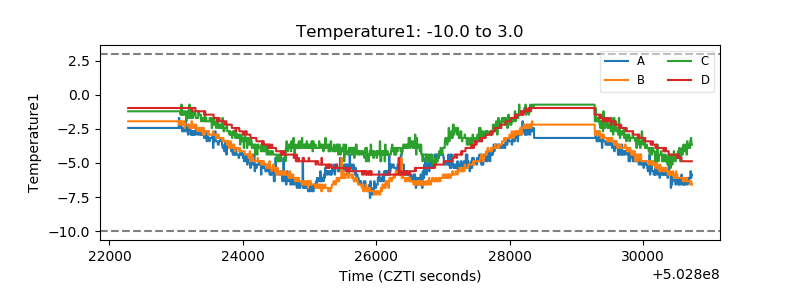 |
| Veto HV Monitor | 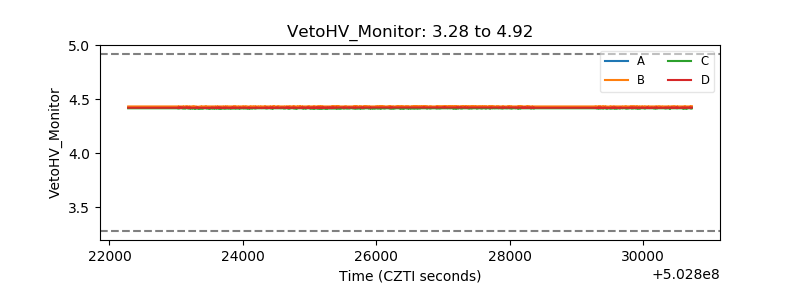 |
| Veto LLD | 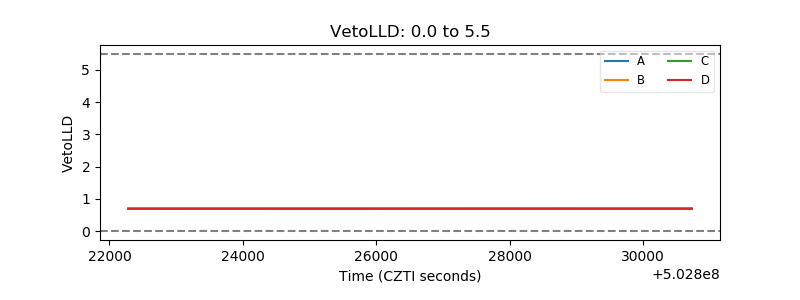 |
| Alpha Counter | 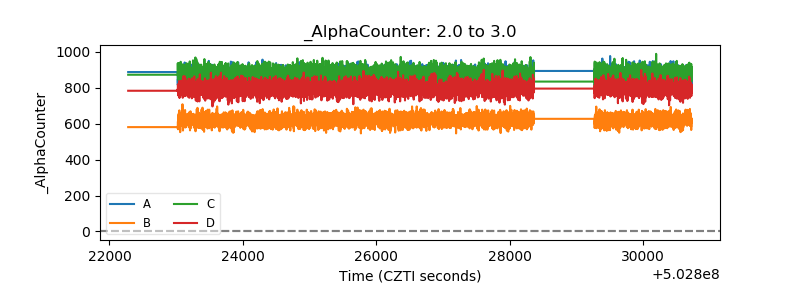 |
| _CPM_Rate | 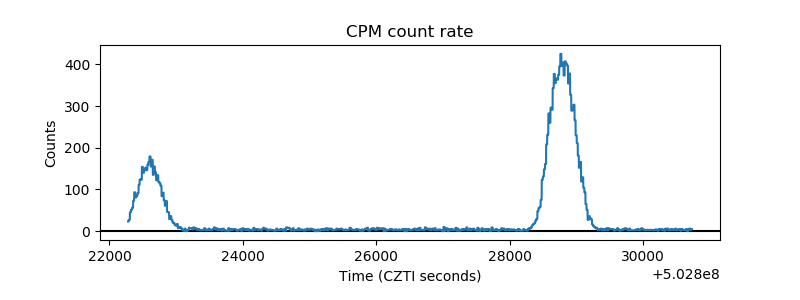 |
| CZT Counter | 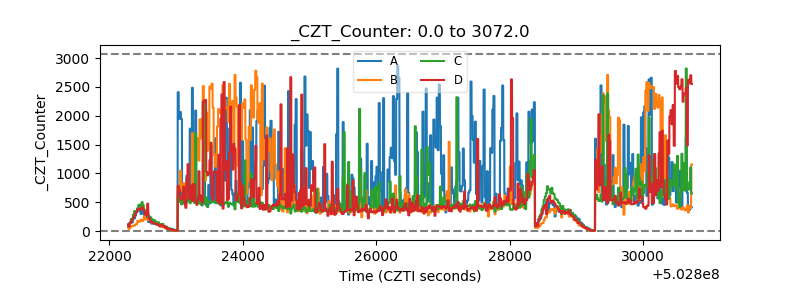 |
| +2.5 Volts monitor |  |
| +5 Volts monitor |  |
| _ROLL_ROT |  |
| _Roll_DEC |  |
| _Roll_RA | 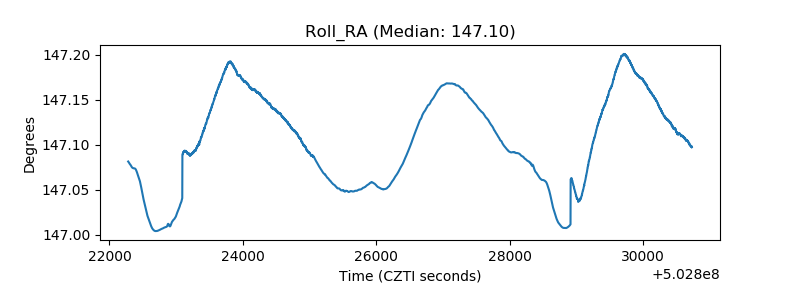 |
| Veto Counter | 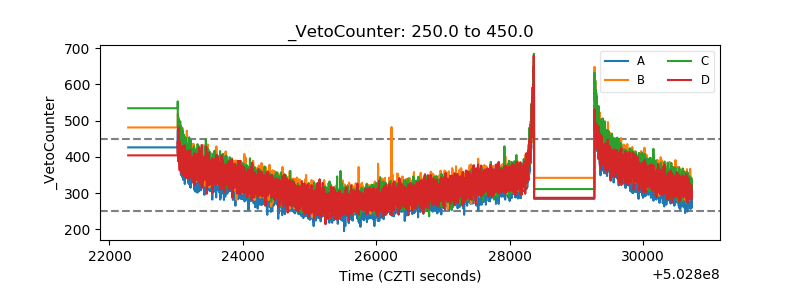 |