| Param | Original file | Final file |
|---|---|---|
| Filename | modeM0/AS1A14_022T16_9000006532_55154cztM0_level2.fits | modeM0/AS1A14_022T16_9000006532_55154cztM0_level2_quad_clean.evt |
| Size (bytes) | 518,155,200 | 88,876,800 |
| Size | 494.2 MB | 84.8 MB |
| Events in quadrant A | 3,850,907 | 602,425 |
| Events in quadrant B | 3,760,202 | 621,176 |
| Events in quadrant C | 7,350,809 | 495,978 |
| Events in quadrant D | 3,730,354 | 532,875 |
| Mode SS | |||
|---|---|---|---|
| Quadrant | BADHDUFLAG | Total packets | Discarded packets |
| A | 0 | 128 | 0 |
| B | 0 | 128 | 0 |
| C | 0 | 128 | 0 |
| D | 0 | 128 | 0 |
| Mode M0 | |||
|---|---|---|---|
| Quadrant | BADHDUFLAG | Total packets | Discarded packets |
| A | 0 | 15910 | 2 |
| B | 0 | 15958 | 2 |
| C | 0 | 26068 | 2 |
| D | 0 | 15754 | 2 |
| Mode M9 | |||
|---|---|---|---|
| Quadrant | BADHDUFLAG | Total packets | Discarded packets |
| A | 0 | 13 | 0 |
| B | 0 | 14 | 0 |
| C | 0 | 14 | 0 |
| D | 0 | 14 | 0 |
| Quadrant | Total seconds | Saturated seconds | Saturation percentage |
|---|---|---|---|
| A | 6283 | 166 | 2.642050% |
| B | 6283 | 416 | 6.621041% |
| C | 6283 | 1249 | 19.879039% |
| D | 6282 | 223 | 3.549825% |
Noise dominated data is calculated using 1-second bins in cleaned event files. If a bin has >2000 counts, and if more than 50% of those come from <1% of pixels, then it is considered to be noise-dominated and hence unusable.
| Quadrant | # 1 sec bins | Bins with >0 counts | Bins with >2000 counts | High rate bins dominated by noise | Noise dominated (total time) | Noise dominated (detector-on time) | Marked lightcurve |
|---|---|---|---|---|---|---|---|
| A | 7418 | 6284 | 163 | 163 | 2.20% | 2.59% |  |
| B | 7418 | 6284 | 324 | 324 | 4.37% | 5.16% | 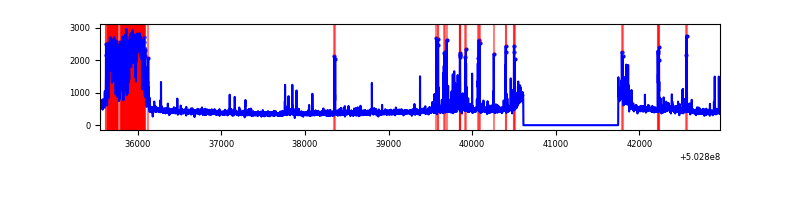 |
| C | 7418 | 6284 | 1381 | 1381 | 18.62% | 21.98% | 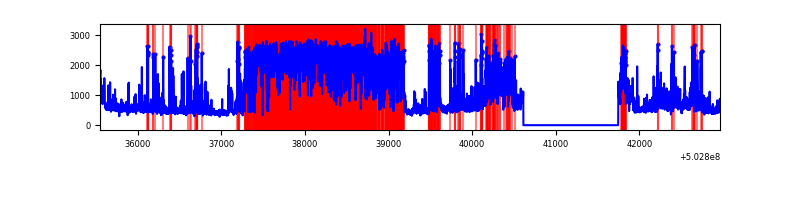 |
| D | 7417 | 6283 | 204 | 204 | 2.75% | 3.25% | 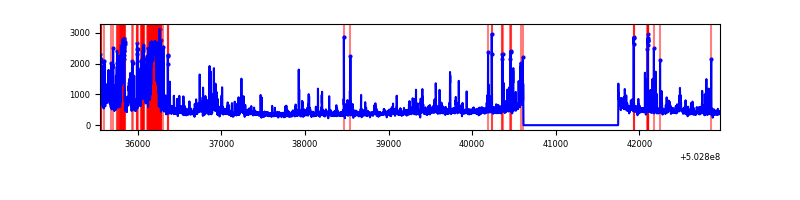 |
Top three noisy pixels from each quadrant. If the there are fewer than three noisy pixels in the level2.evt file, extra rows are filled as -1
| Pixel properties | Quadrant properties | ||||||
|---|---|---|---|---|---|---|---|
| Quadrant | DetID | PixID | Counts | Sigma | Mean | Median | Sigma |
| A | 3 | 78 | 1101412 | 6662.96 | 662 | 646 | 165.2 |
| A | 12 | 115 | 146192 | 880.99 | 662 | 646 | 165.2 |
| A | 13 | 254 | 12947 | 74.46 | 662 | 646 | 165.2 |
| B | 2 | 249 | 1044487 | 7483.18 | 647 | 623 | 139.5 |
| B | 5 | 185 | 41819 | 295.32 | 647 | 623 | 139.5 |
| B | 4 | 81 | 33764 | 237.58 | 647 | 623 | 139.5 |
| C | 9 | 38 | 3735679 | 21745.81 | 623 | 618 | 171.8 |
| C | 13 | 3 | 615738 | 3581.28 | 623 | 618 | 171.8 |
| C | 1 | 16 | 146931 | 851.85 | 623 | 618 | 171.8 |
| D | 11 | 129 | 902439 | 4960.09 | 637 | 609 | 181.8 |
| D | 2 | 252 | 120998 | 662.14 | 637 | 609 | 181.8 |
| D | 5 | 173 | 48419 | 262.96 | 637 | 609 | 181.8 |
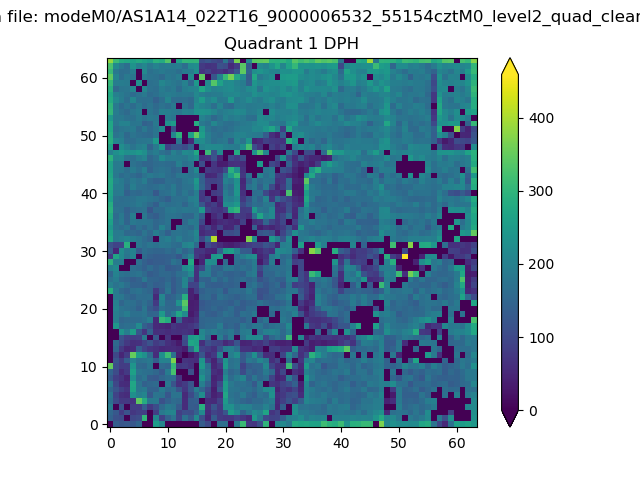
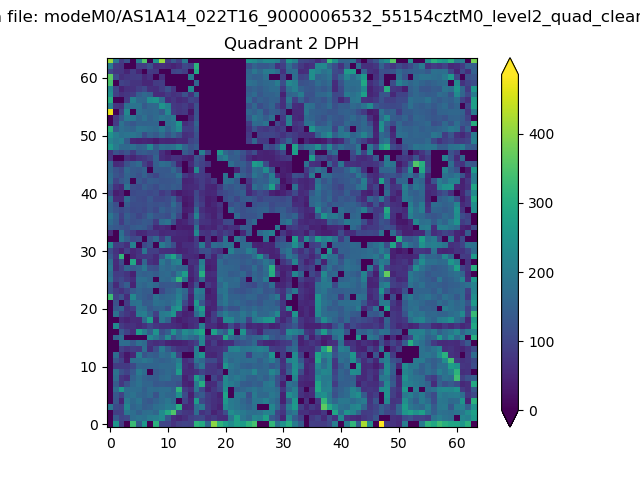
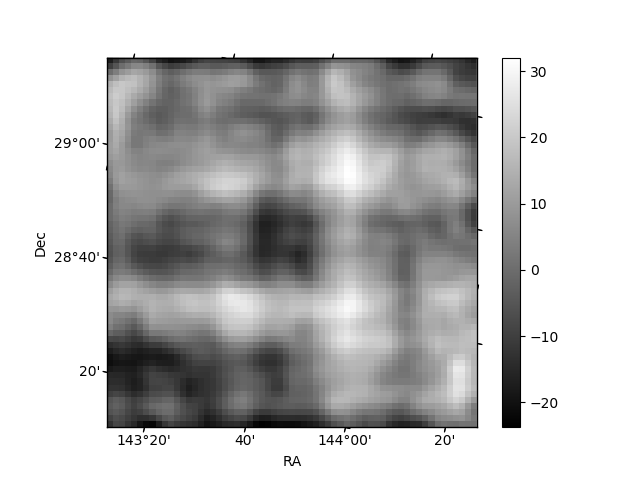
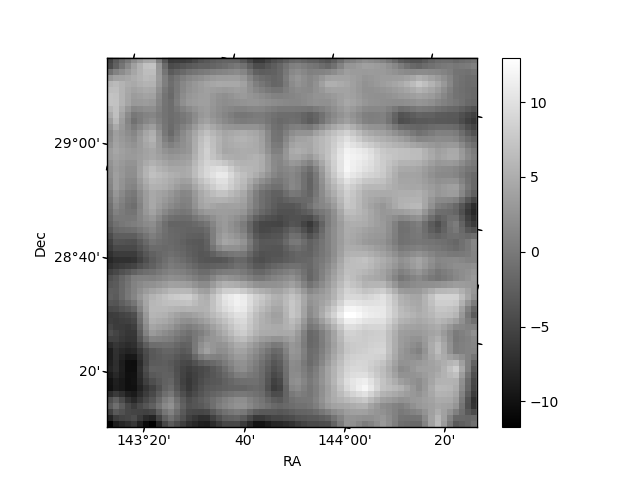
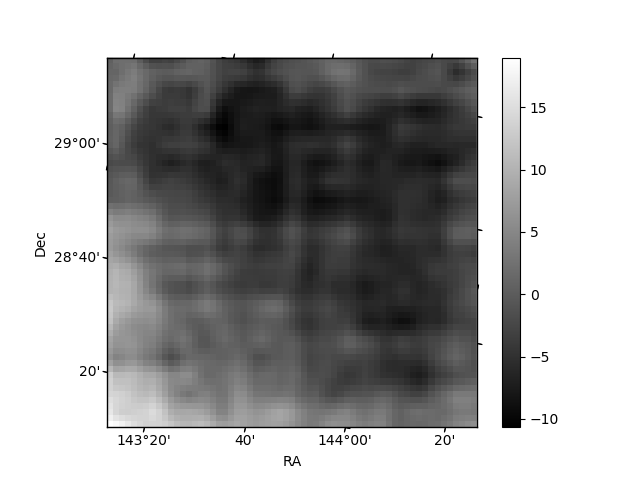
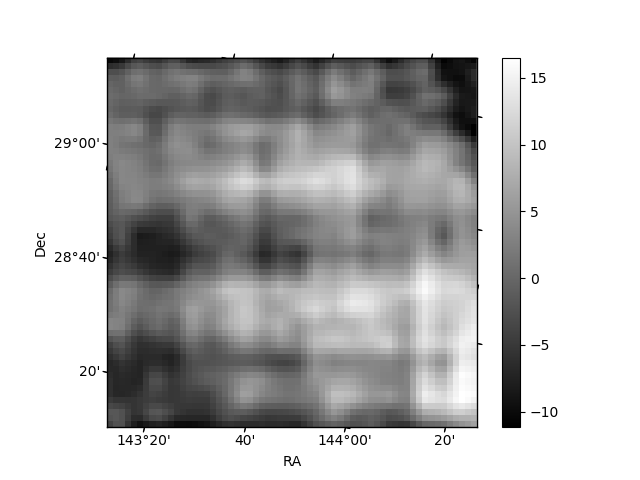
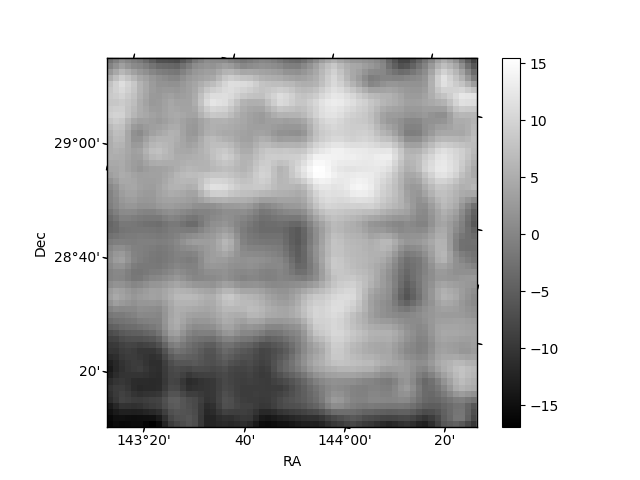
Histogram calculated using DETX and DETY for each event in the final _common_clean file
| Quadrant A | 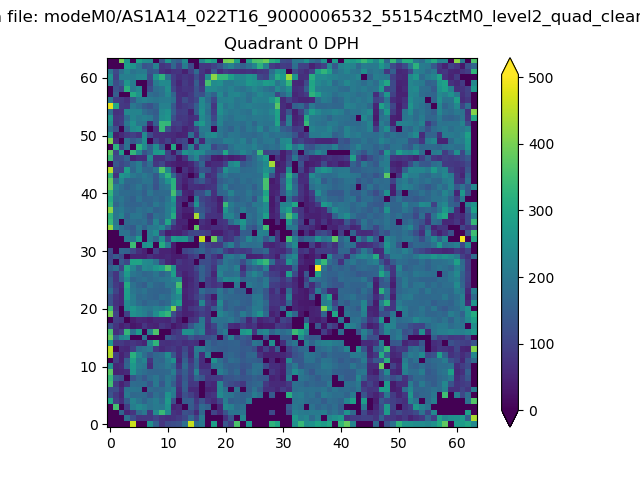 |
 |
Quadrant B |
|---|---|---|---|
| Quadrant D | 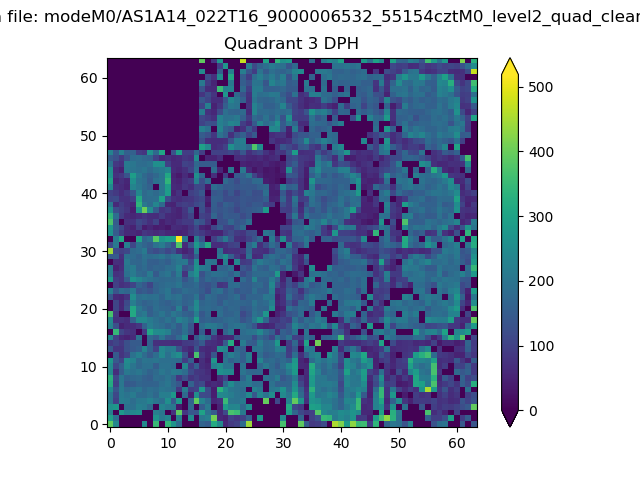 |
 |
Quadrant C |
| Plot type | Count rate plots | Images |
|---|---|---|
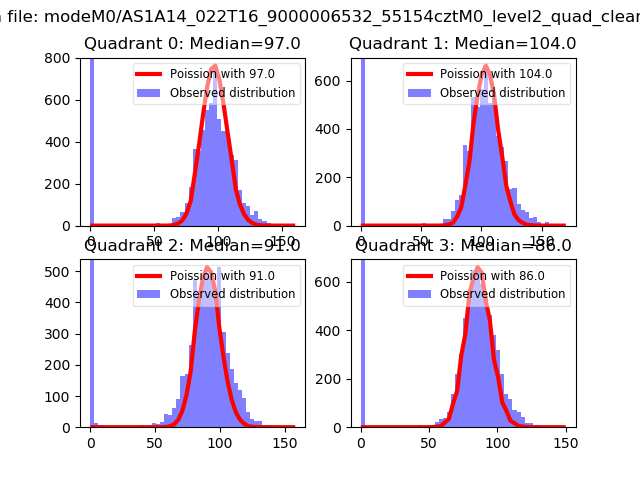
| Comparison with Poisson distribution Blue bars denote a histogram of data divided into 1 sec bins. Red curve is a Poisson curve with rate = median count rate of data. |
 |
 |
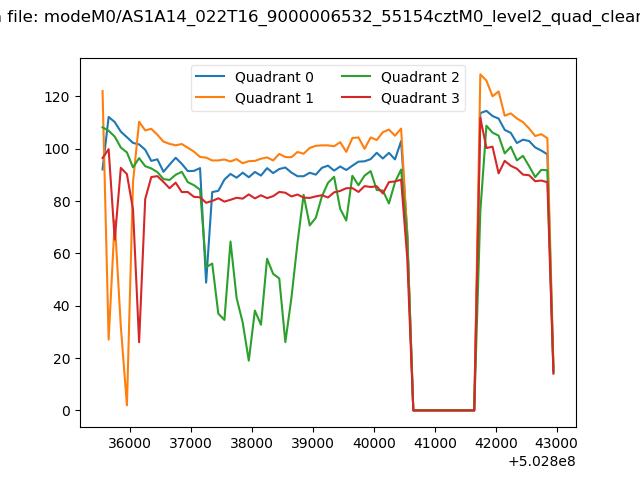
| Quadrant-wise count rates Data is divided into 100 sec bins |
 |
|
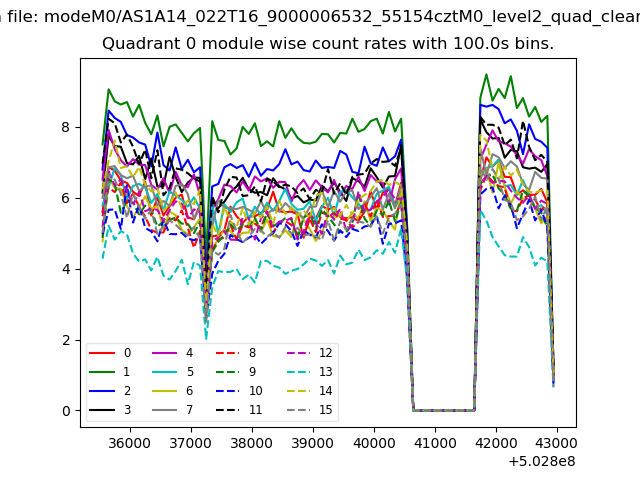
| Module-wise count rates for Quadrant A Data is divided into 100 sec bins |
 |
 |
| Module-wise count rates for Quadrant B Data is divided into 100 sec bins |
 |
 |
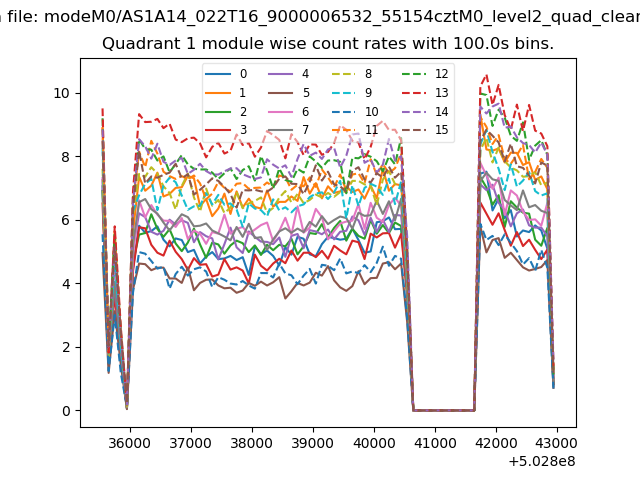
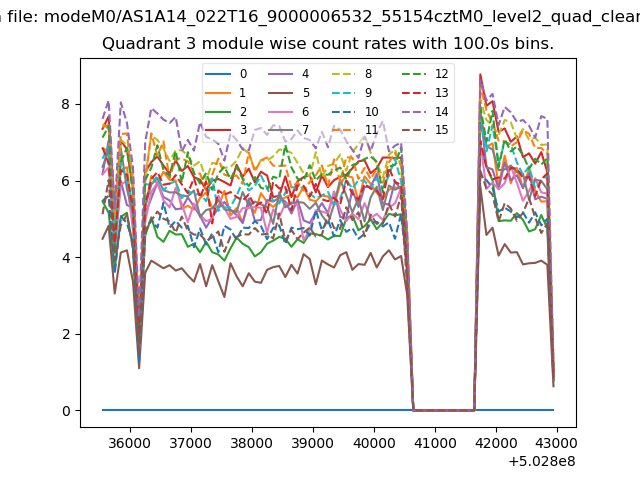
| Module-wise count rates for Quadrant C Data is divided into 100 sec bins |
 |
 |
| Module-wise count rates for Quadrant D Data is divided into 100 sec bins |
 |
 |
| Parameter | Plot |
|---|---|
| CZT HV Monitor |  |
| D_VDD | 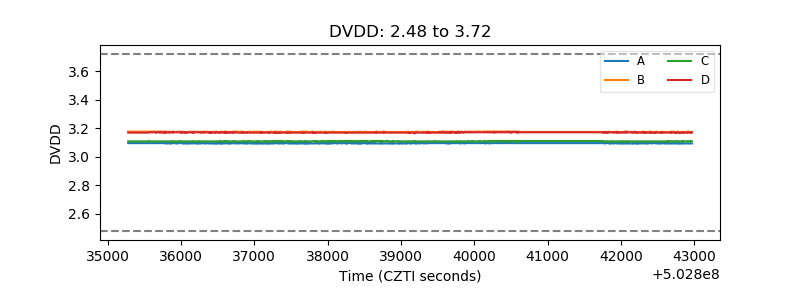 |
| Temperature 1 | 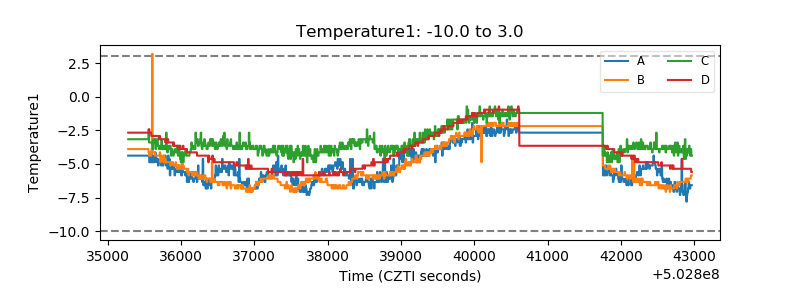 |
| Veto HV Monitor | 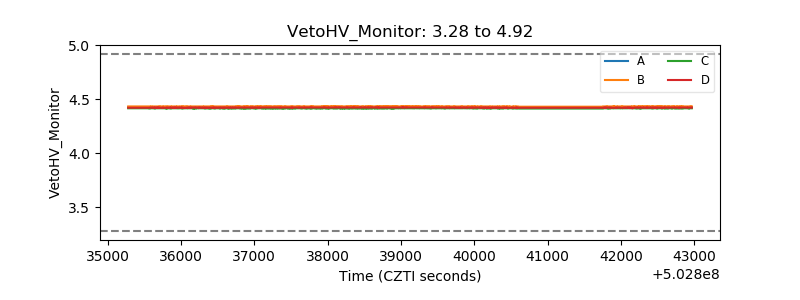 |
| Veto LLD | 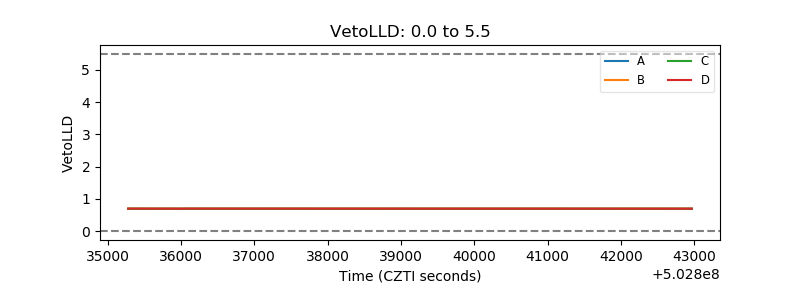 |
| Alpha Counter | 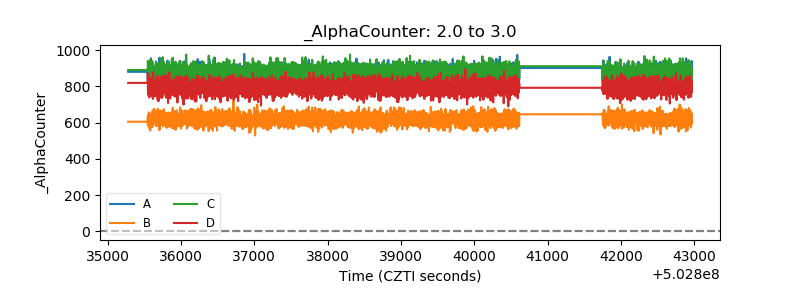 |
| _CPM_Rate | 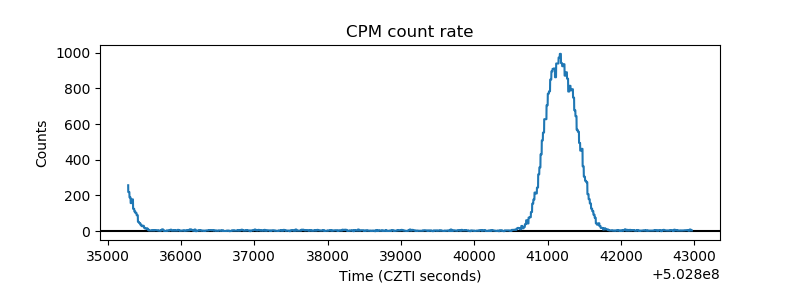 |
| CZT Counter | 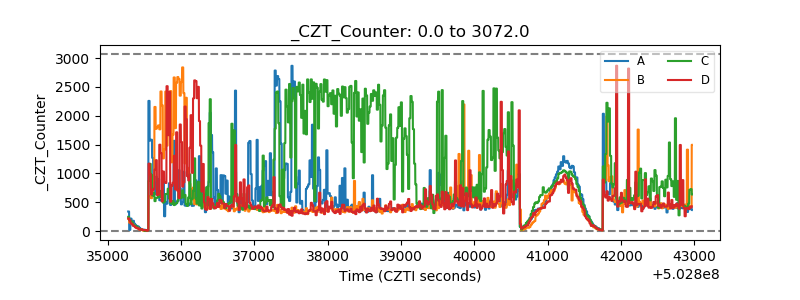 |
| +2.5 Volts monitor |  |
| +5 Volts monitor | 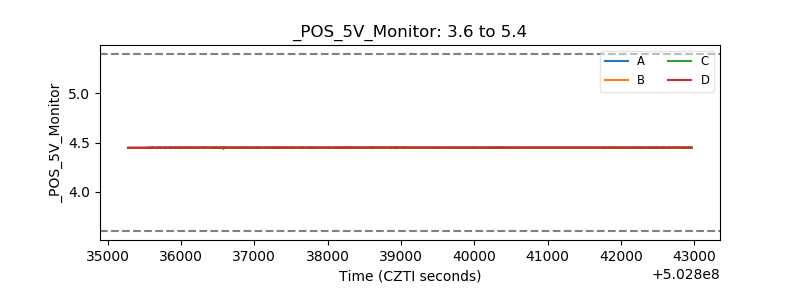 |
| _ROLL_ROT | 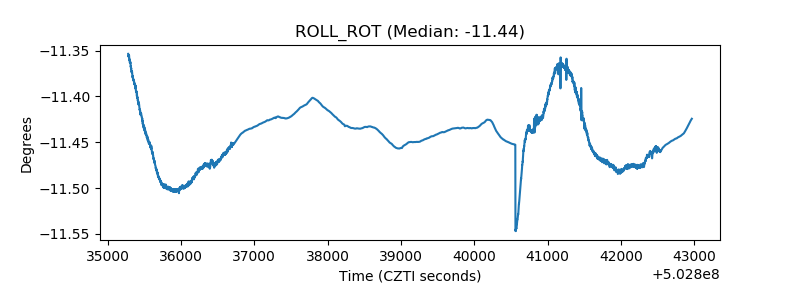 |
| _Roll_DEC | 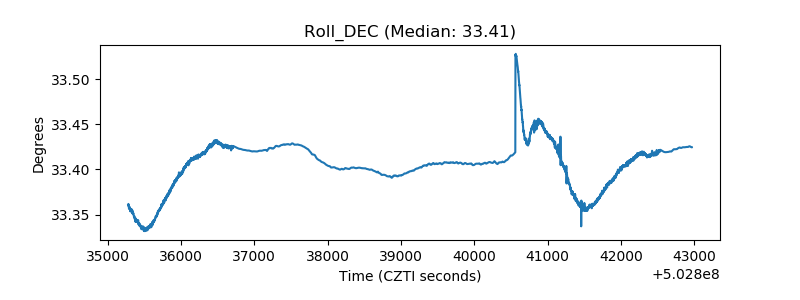 |
| _Roll_RA | 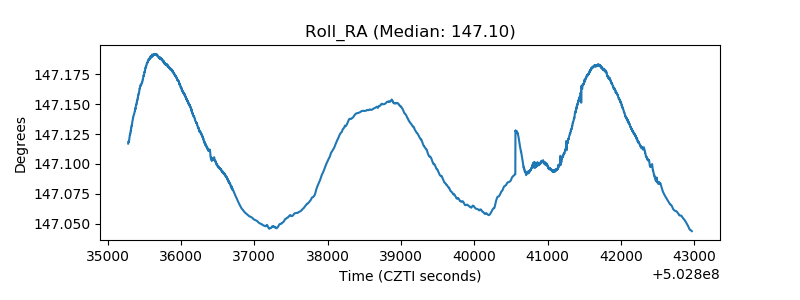 |
| Veto Counter |  |