| Param | Original file | Final file |
|---|---|---|
| Filename | modeM0/AS1A14_022T16_9000006532_55155cztM0_level2.fits | modeM0/AS1A14_022T16_9000006532_55155cztM0_level2_quad_clean.evt |
| Size (bytes) | 400,504,320 | 94,800,960 |
| Size | 382.0 MB | 90.4 MB |
| Events in quadrant A | 3,024,023 | 626,556 |
| Events in quadrant B | 3,027,406 | 675,002 |
| Events in quadrant C | 4,435,880 | 583,592 |
| Events in quadrant D | 3,845,053 | 543,523 |
| Mode SS | |||
|---|---|---|---|
| Quadrant | BADHDUFLAG | Total packets | Discarded packets |
| A | 0 | 128 | 0 |
| B | 0 | 128 | 0 |
| C | 0 | 128 | 0 |
| D | 0 | 128 | 0 |
| Mode M0 | |||
|---|---|---|---|
| Quadrant | BADHDUFLAG | Total packets | Discarded packets |
| A | 0 | 13713 | 2 |
| B | 0 | 13678 | 2 |
| C | 0 | 17455 | 2 |
| D | 0 | 16165 | 2 |
| Mode M9 | |||
|---|---|---|---|
| Quadrant | BADHDUFLAG | Total packets | Discarded packets |
| A | 0 | 15 | 0 |
| B | 0 | 16 | 0 |
| C | 0 | 16 | 0 |
| D | 0 | 16 | 0 |
| Quadrant | Total seconds | Saturated seconds | Saturation percentage |
|---|---|---|---|
| A | 6336 | 51 | 0.804924% |
| B | 6336 | 79 | 1.246843% |
| C | 6336 | 238 | 3.756313% |
| D | 6336 | 248 | 3.914141% |
Noise dominated data is calculated using 1-second bins in cleaned event files. If a bin has >2000 counts, and if more than 50% of those come from <1% of pixels, then it is considered to be noise-dominated and hence unusable.
| Quadrant | # 1 sec bins | Bins with >0 counts | Bins with >2000 counts | High rate bins dominated by noise | Noise dominated (total time) | Noise dominated (detector-on time) | Marked lightcurve |
|---|---|---|---|---|---|---|---|
| A | 7506 | 6336 | 24 | 24 | 0.32% | 0.38% | 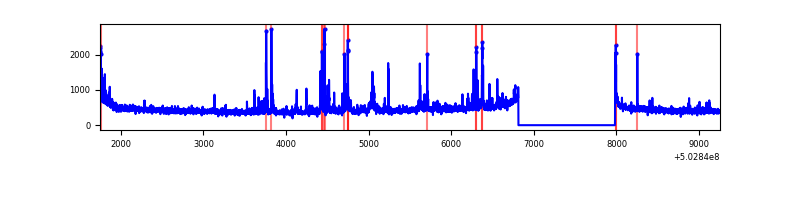 |
| B | 7506 | 6336 | 23 | 23 | 0.31% | 0.36% | 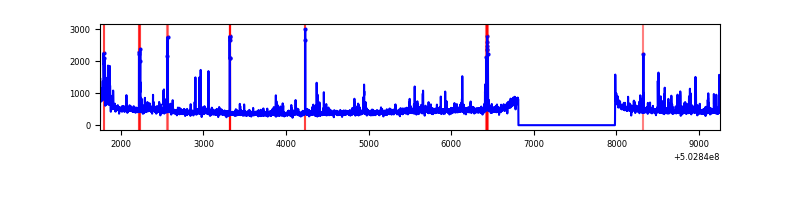 |
| C | 7506 | 6336 | 208 | 208 | 2.77% | 3.28% | 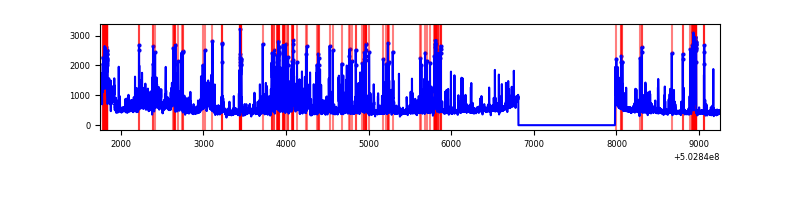 |
| D | 7506 | 6337 | 272 | 272 | 3.62% | 4.29% | 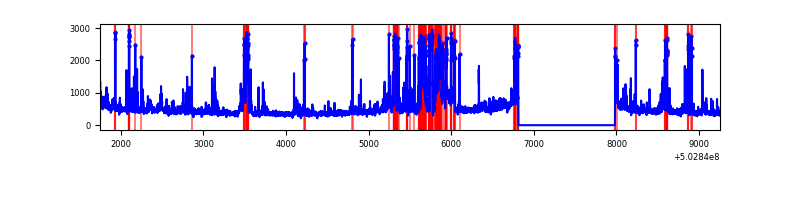 |
Top three noisy pixels from each quadrant. If the there are fewer than three noisy pixels in the level2.evt file, extra rows are filled as -1
| Pixel properties | Quadrant properties | ||||||
|---|---|---|---|---|---|---|---|
| Quadrant | DetID | PixID | Counts | Sigma | Mean | Median | Sigma |
| A | 3 | 78 | 309701 | 1842.25 | 681 | 664 | 167.7 |
| A | 12 | 115 | 19173 | 110.34 | 681 | 664 | 167.7 |
| A | 4 | 157 | 13285 | 75.24 | 681 | 664 | 167.7 |
| B | 5 | 185 | 104935 | 720.65 | 678 | 656 | 144.7 |
| B | 4 | 81 | 81732 | 560.3 | 678 | 656 | 144.7 |
| B | 2 | 249 | 79584 | 545.45 | 678 | 656 | 144.7 |
| C | 13 | 3 | 708728 | 3925.57 | 655 | 649 | 180.4 |
| C | 9 | 38 | 573822 | 3177.65 | 655 | 649 | 180.4 |
| C | 6 | 223 | 202528 | 1119.21 | 655 | 649 | 180.4 |
| D | 3 | 12 | 597022 | 3237.38 | 643 | 614 | 184.2 |
| D | 2 | 172 | 234948 | 1271.99 | 643 | 614 | 184.2 |
| D | 11 | 129 | 97431 | 525.53 | 643 | 614 | 184.2 |
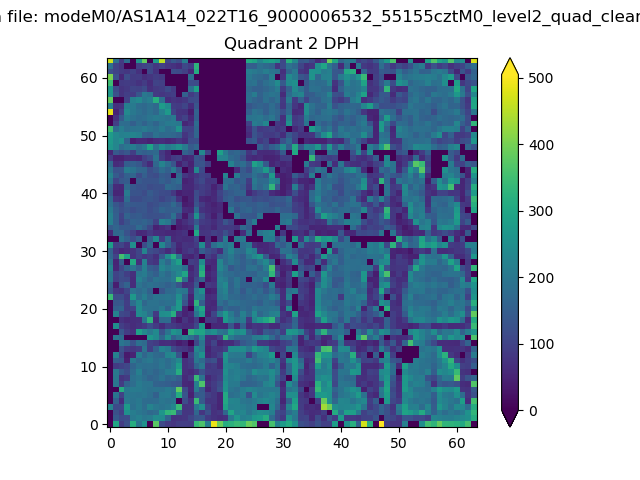
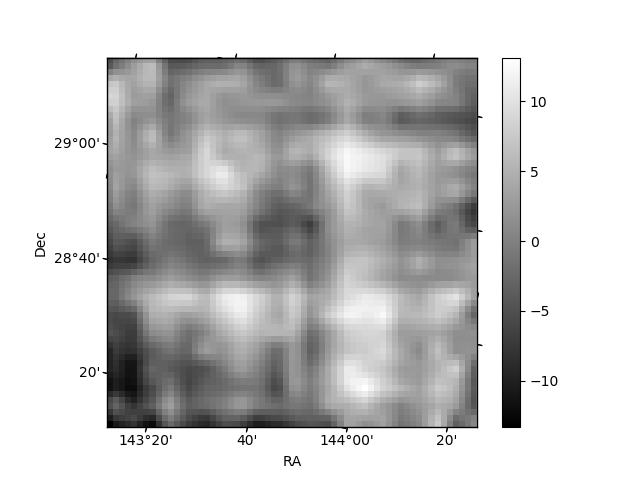
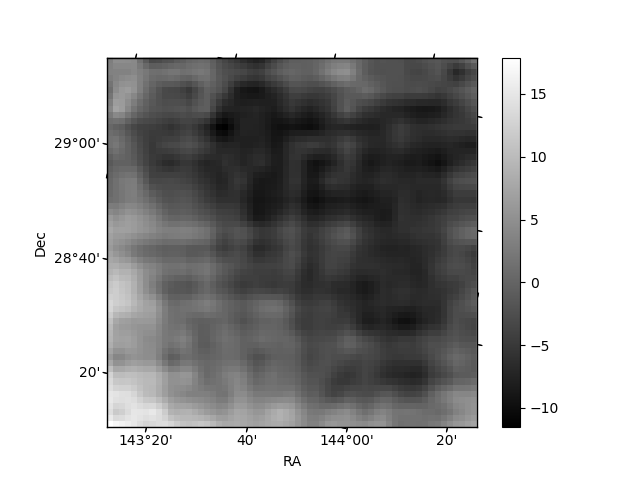
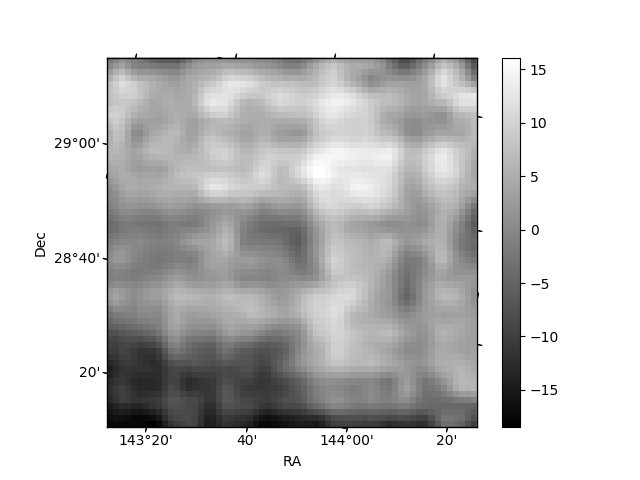
Histogram calculated using DETX and DETY for each event in the final _common_clean file
| Quadrant A |  |
 |
Quadrant B |
|---|---|---|---|
| Quadrant D |  |
 |
Quadrant C |
| Plot type | Count rate plots | Images |
|---|---|---|
| Comparison with Poisson distribution Blue bars denote a histogram of data divided into 1 sec bins. Red curve is a Poisson curve with rate = median count rate of data. |
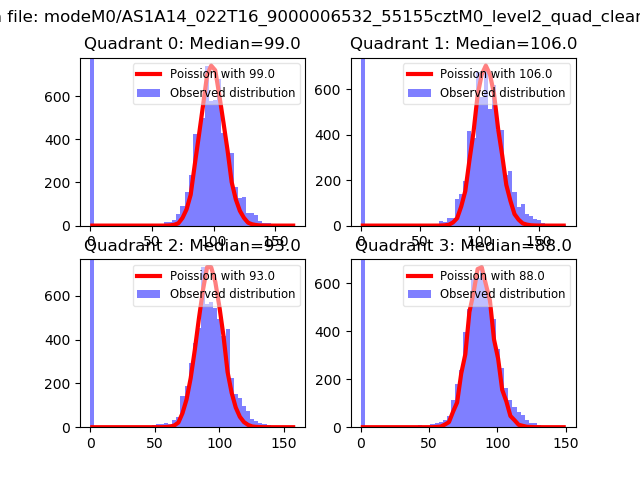 |
 |
| Quadrant-wise count rates Data is divided into 100 sec bins |
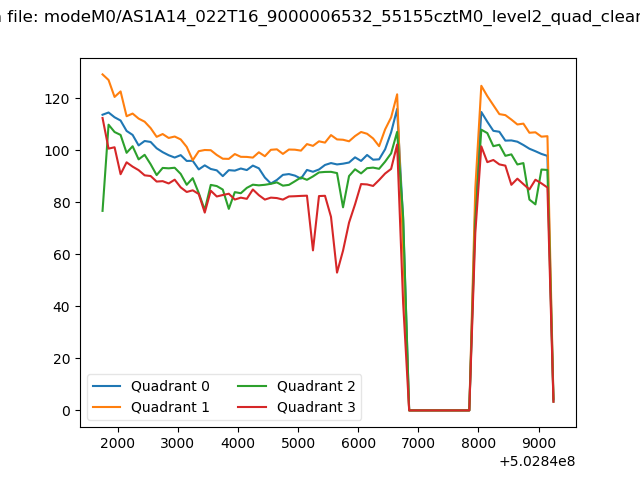 |
|
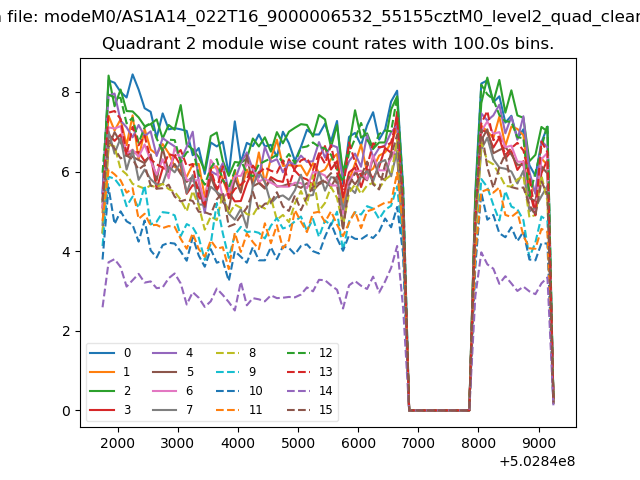
| Module-wise count rates for Quadrant A Data is divided into 100 sec bins |
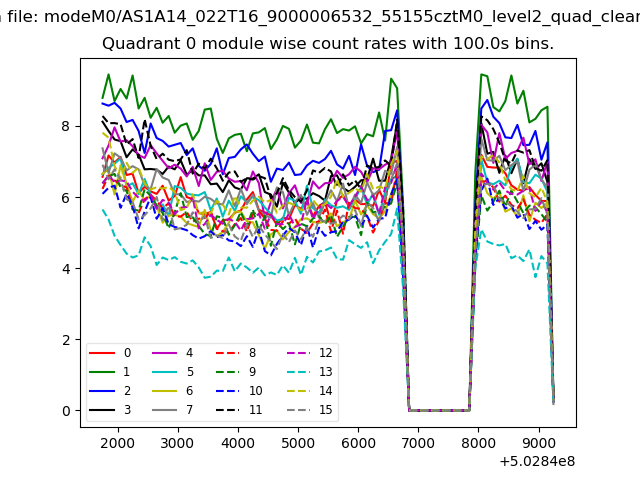 |
 |
| Module-wise count rates for Quadrant B Data is divided into 100 sec bins |
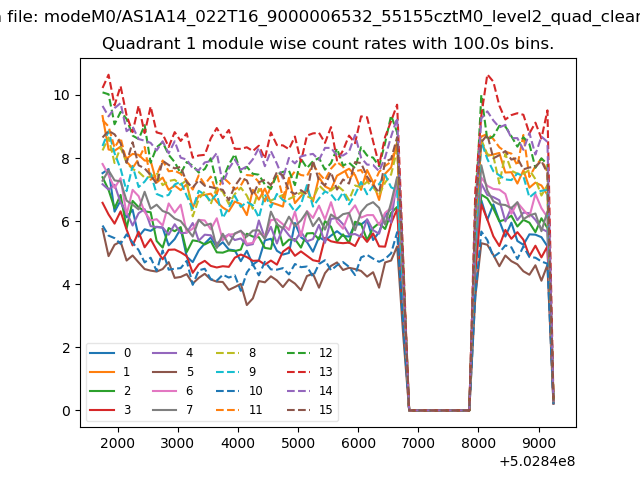 |
 |
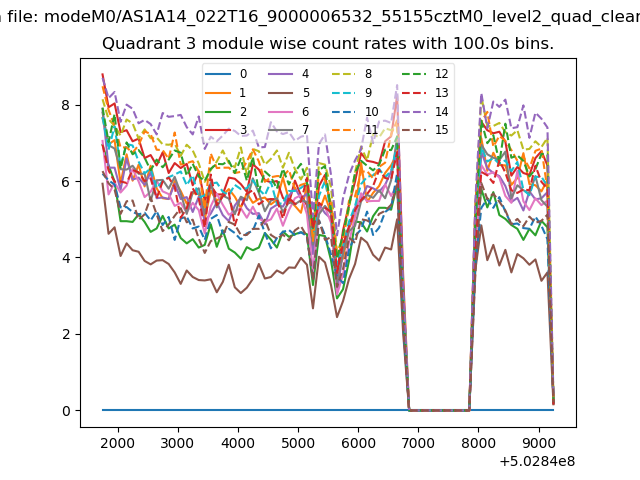
| Module-wise count rates for Quadrant C Data is divided into 100 sec bins |
 |
 |
| Module-wise count rates for Quadrant D Data is divided into 100 sec bins |
 |
 |
| Parameter | Plot |
|---|---|
| CZT HV Monitor |  |
| D_VDD | 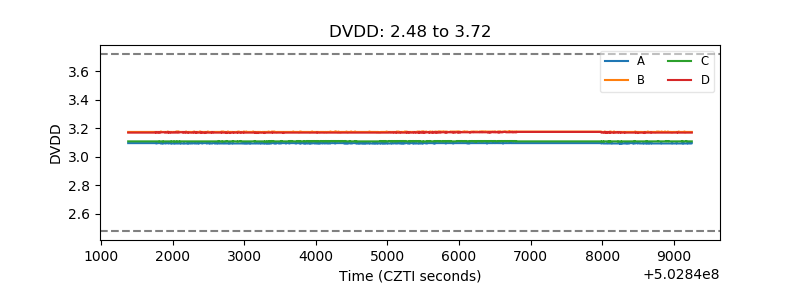 |
| Temperature 1 | 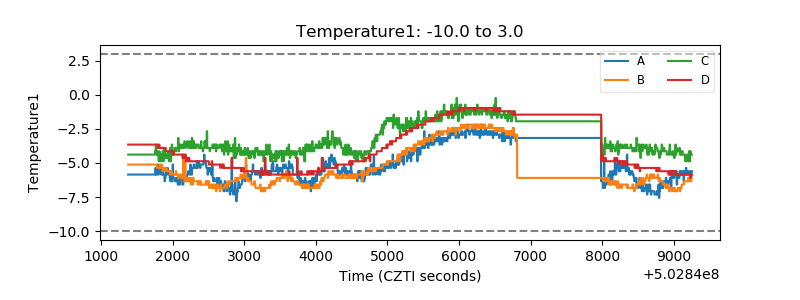 |
| Veto HV Monitor | 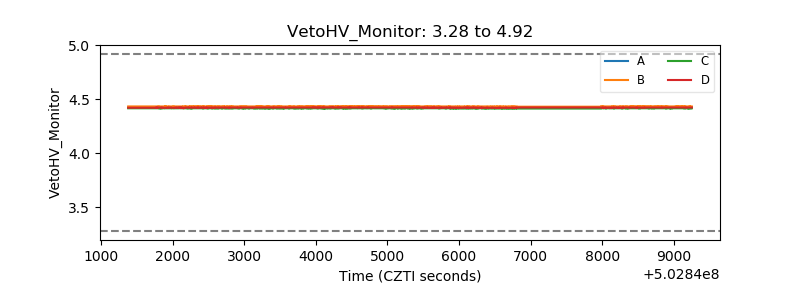 |
| Veto LLD | 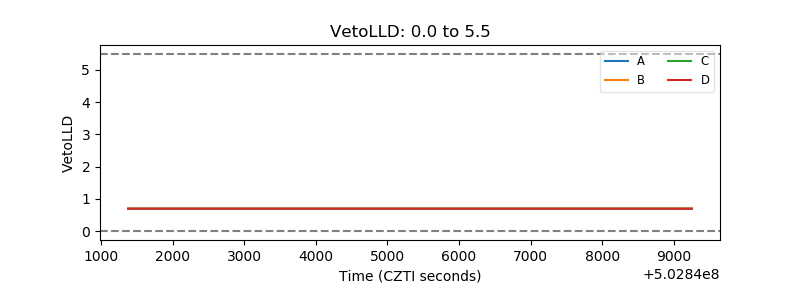 |
| Alpha Counter | 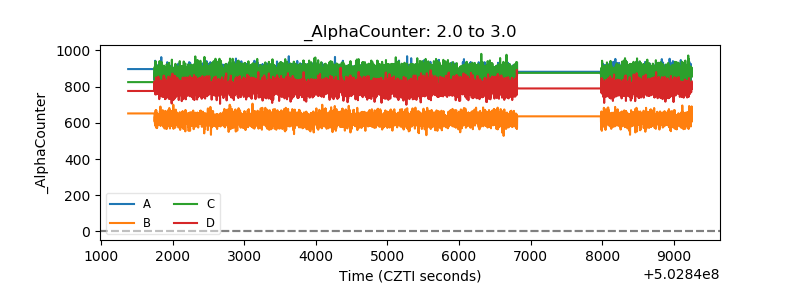 |
| _CPM_Rate | 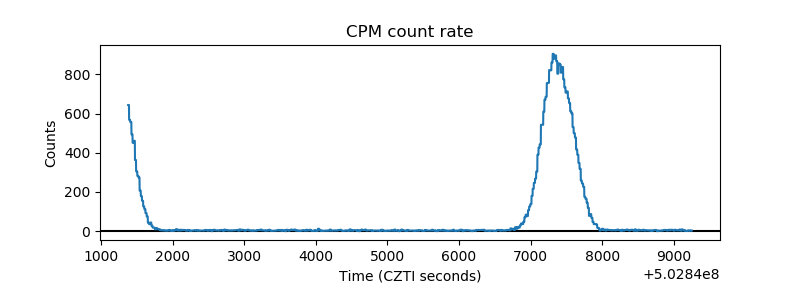 |
| CZT Counter | 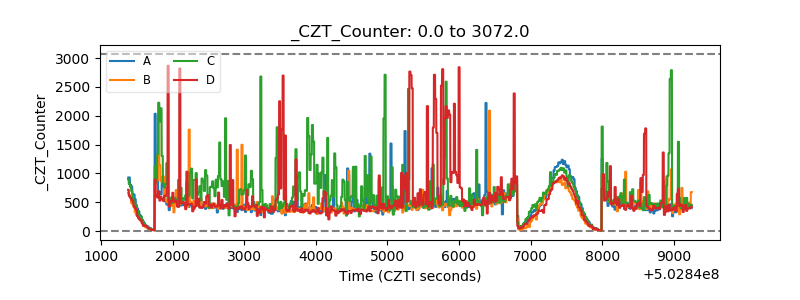 |
| +2.5 Volts monitor |  |
| +5 Volts monitor |  |
| _ROLL_ROT | 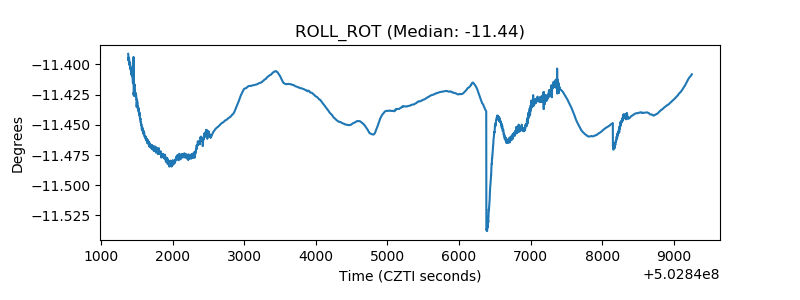 |
| _Roll_DEC | 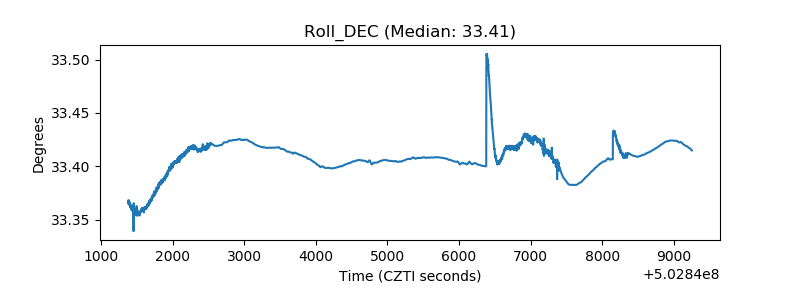 |
| _Roll_RA | 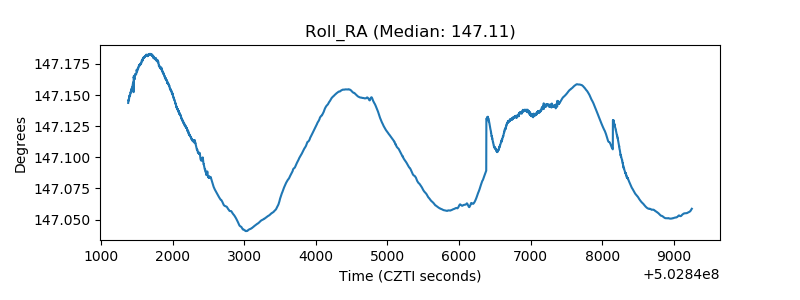 |
| Veto Counter | 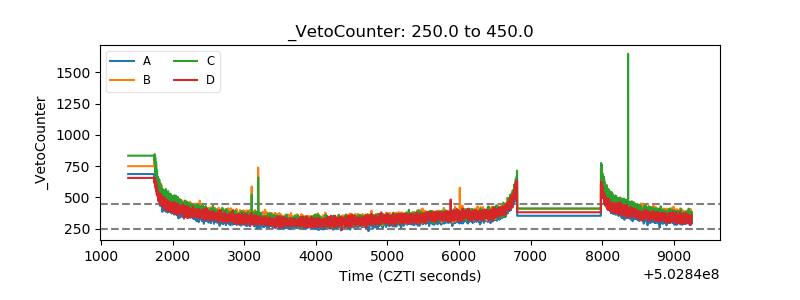 |