| Param | Original file | Final file |
|---|---|---|
| Filename | modeM0/AS1A14_022T16_9000006532_55156cztM0_level2.fits | modeM0/AS1A14_022T16_9000006532_55156cztM0_level2_quad_clean.evt |
| Size (bytes) | 429,598,080 | 103,325,760 |
| Size | 409.7 MB | 98.5 MB |
| Events in quadrant A | 3,730,123 | 679,848 |
| Events in quadrant B | 3,346,737 | 734,896 |
| Events in quadrant C | 4,289,255 | 636,770 |
| Events in quadrant D | 3,995,450 | 593,348 |
| Mode SS | |||
|---|---|---|---|
| Quadrant | BADHDUFLAG | Total packets | Discarded packets |
| A | 0 | 142 | 0 |
| B | 0 | 142 | 0 |
| C | 0 | 142 | 0 |
| D | 0 | 142 | 0 |
| Mode M0 | |||
|---|---|---|---|
| Quadrant | BADHDUFLAG | Total packets | Discarded packets |
| A | 0 | 16354 | 2 |
| B | 0 | 15145 | 2 |
| C | 0 | 17602 | 2 |
| D | 0 | 17161 | 2 |
| Mode M9 | |||
|---|---|---|---|
| Quadrant | BADHDUFLAG | Total packets | Discarded packets |
| A | 0 | 23 | 0 |
| B | 0 | 23 | 0 |
| C | 0 | 23 | 0 |
| D | 0 | 23 | 0 |
| Quadrant | Total seconds | Saturated seconds | Saturation percentage |
|---|---|---|---|
| A | 6952 | 146 | 2.100115% |
| B | 6952 | 129 | 1.855581% |
| C | 6952 | 260 | 3.739931% |
| D | 6952 | 231 | 3.322785% |
Noise dominated data is calculated using 1-second bins in cleaned event files. If a bin has >2000 counts, and if more than 50% of those come from <1% of pixels, then it is considered to be noise-dominated and hence unusable.
| Quadrant | # 1 sec bins | Bins with >0 counts | Bins with >2000 counts | High rate bins dominated by noise | Noise dominated (total time) | Noise dominated (detector-on time) | Marked lightcurve |
|---|---|---|---|---|---|---|---|
| A | 9262 | 6952 | 75 | 75 | 0.81% | 1.08% | 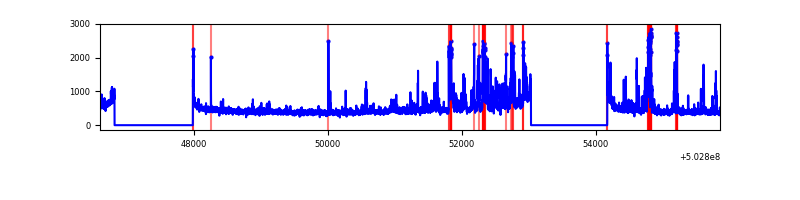 |
| B | 9262 | 6952 | 21 | 21 | 0.23% | 0.30% | 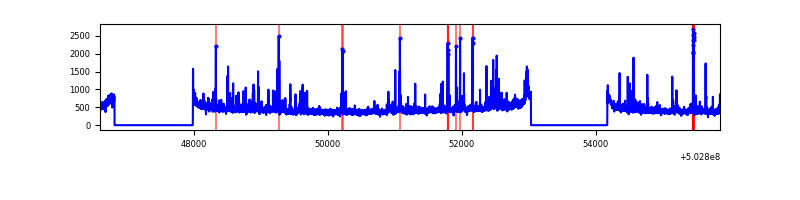 |
| C | 9262 | 6953 | 226 | 226 | 2.44% | 3.25% | 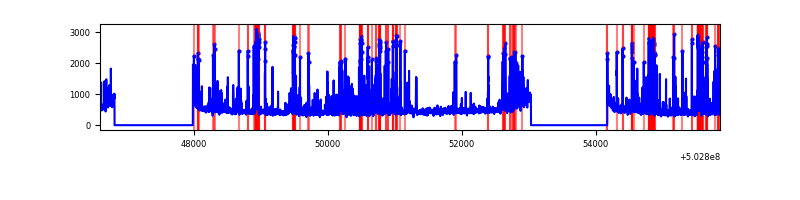 |
| D | 9262 | 6954 | 221 | 221 | 2.39% | 3.18% | 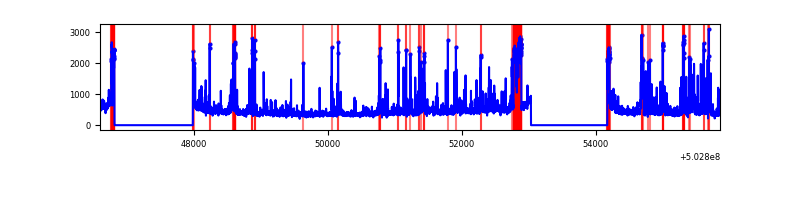 |
Top three noisy pixels from each quadrant. If the there are fewer than three noisy pixels in the level2.evt file, extra rows are filled as -1
| Pixel properties | Quadrant properties | ||||||
|---|---|---|---|---|---|---|---|
| Quadrant | DetID | PixID | Counts | Sigma | Mean | Median | Sigma |
| A | 3 | 78 | 709477 | 3828.35 | 745 | 730 | 185.1 |
| A | 0 | 8 | 39939 | 211.79 | 745 | 730 | 185.1 |
| A | 7 | 237 | 17320 | 89.61 | 745 | 730 | 185.1 |
| B | 4 | 81 | 119279 | 740.9 | 746 | 720 | 160.0 |
| B | 2 | 249 | 73374 | 454.03 | 746 | 720 | 160.0 |
| B | 5 | 185 | 71144 | 440.09 | 746 | 720 | 160.0 |
| C | 13 | 3 | 803409 | 4059.63 | 718 | 710 | 197.7 |
| C | 10 | 22 | 281711 | 1421.16 | 718 | 710 | 197.7 |
| C | 1 | 16 | 200939 | 1012.65 | 718 | 710 | 197.7 |
| D | 11 | 129 | 303056 | 1497.38 | 705 | 675 | 201.9 |
| D | 2 | 172 | 220882 | 1090.46 | 705 | 675 | 201.9 |
| D | 11 | 224 | 198314 | 978.7 | 705 | 675 | 201.9 |
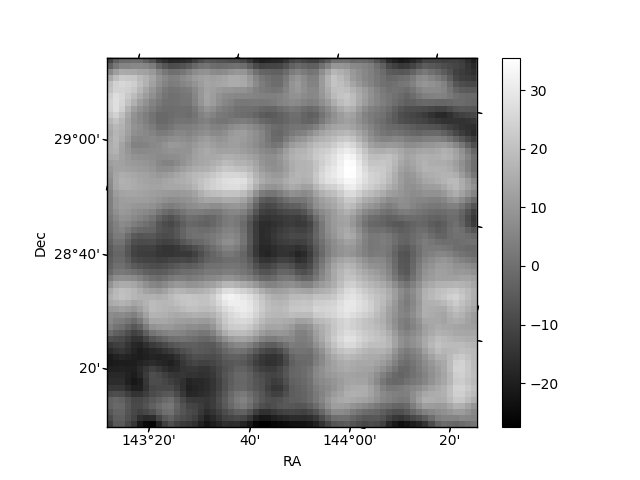
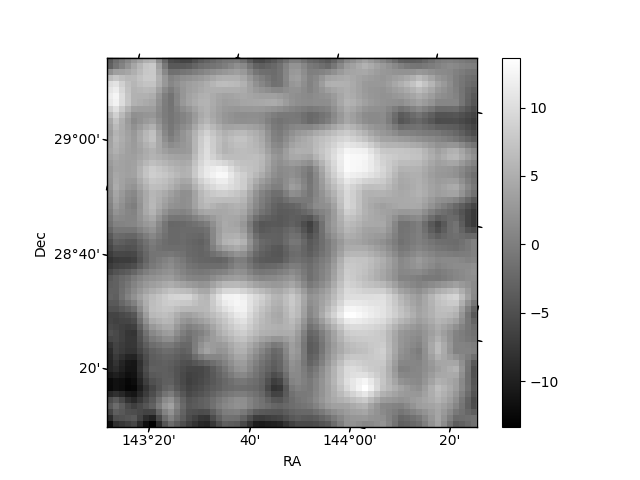
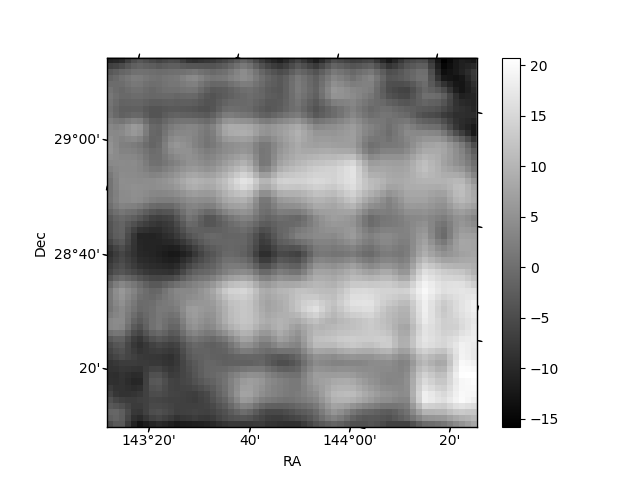
Histogram calculated using DETX and DETY for each event in the final _common_clean file
| Quadrant A | 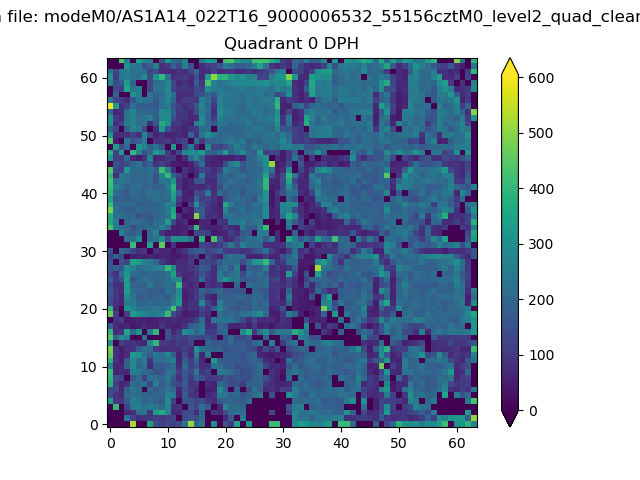 |
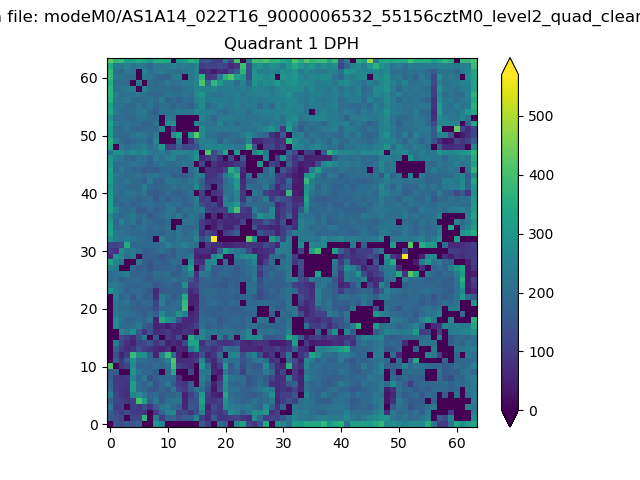 |
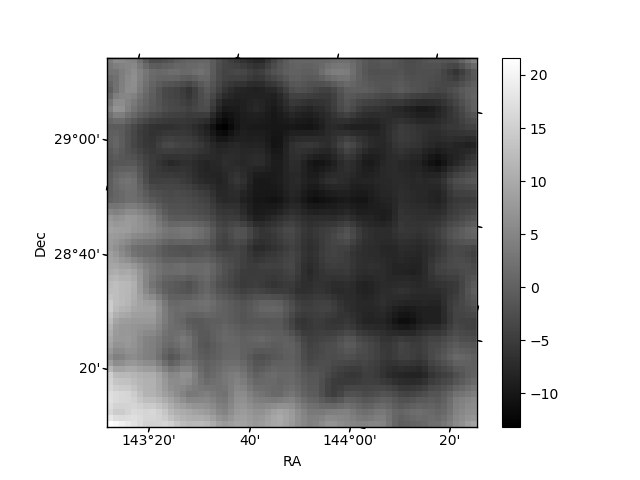
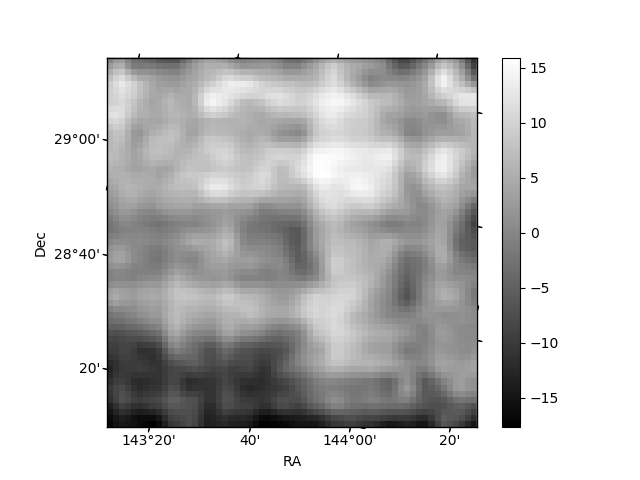
Quadrant B |
|---|---|---|---|
| Quadrant D | 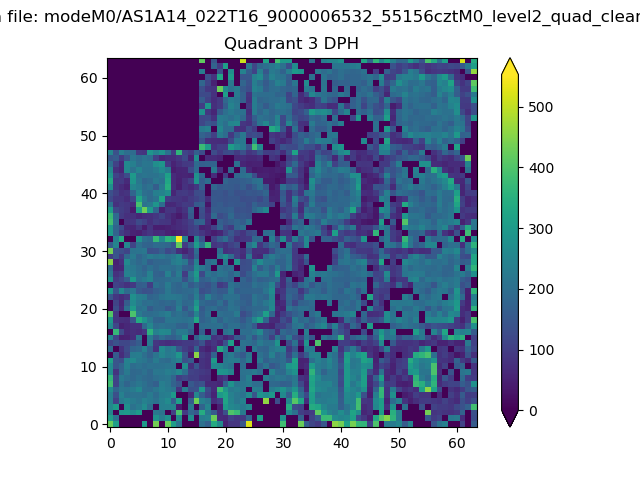 |
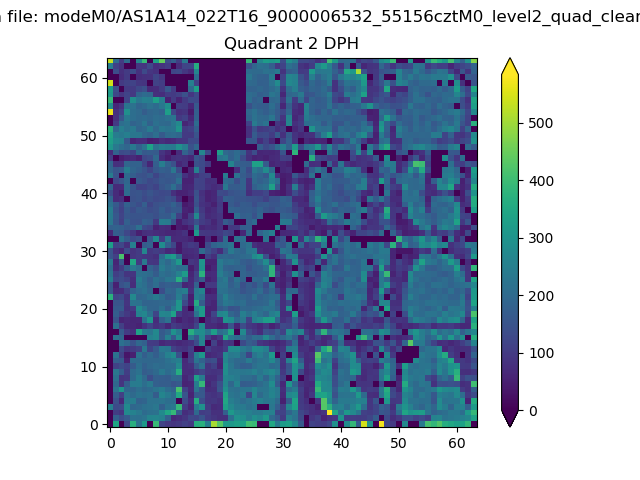 |
Quadrant C |
| Plot type | Count rate plots | Images |
|---|---|---|
| Comparison with Poisson distribution Blue bars denote a histogram of data divided into 1 sec bins. Red curve is a Poisson curve with rate = median count rate of data. |
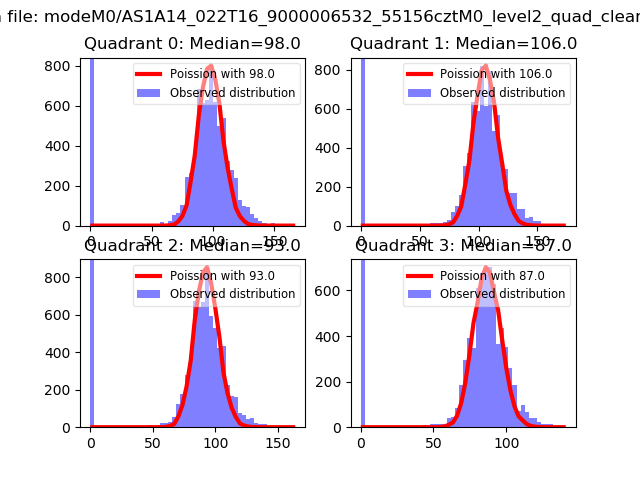 |
 |
| Quadrant-wise count rates Data is divided into 100 sec bins |
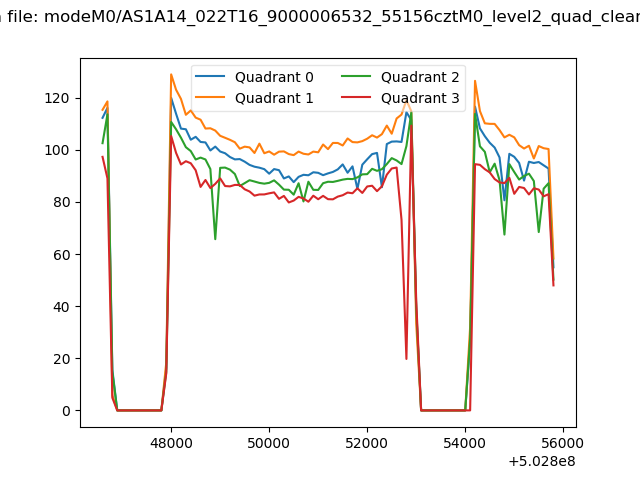 |
|
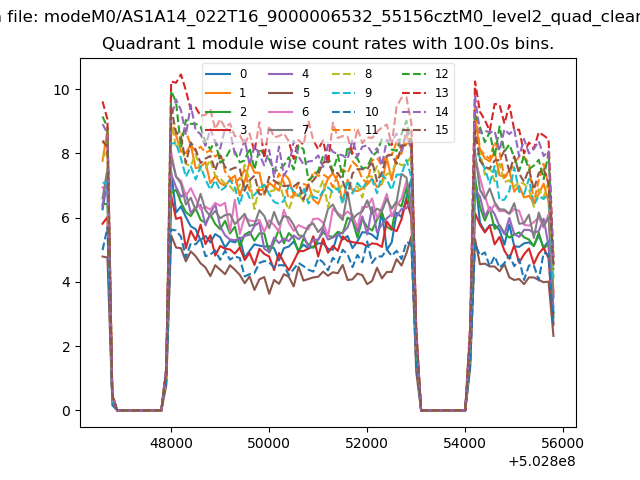
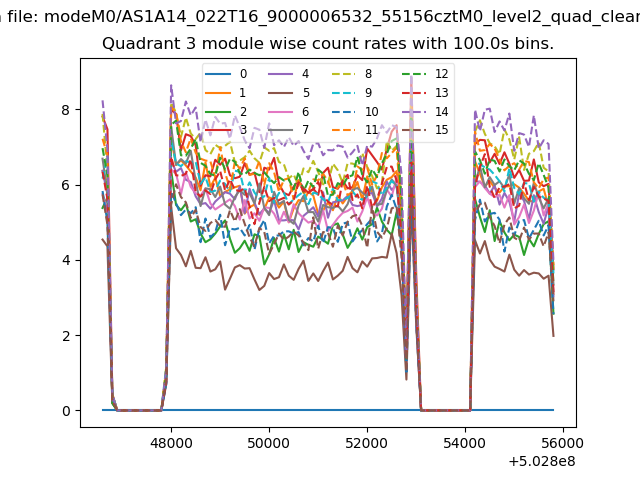
| Module-wise count rates for Quadrant A Data is divided into 100 sec bins |
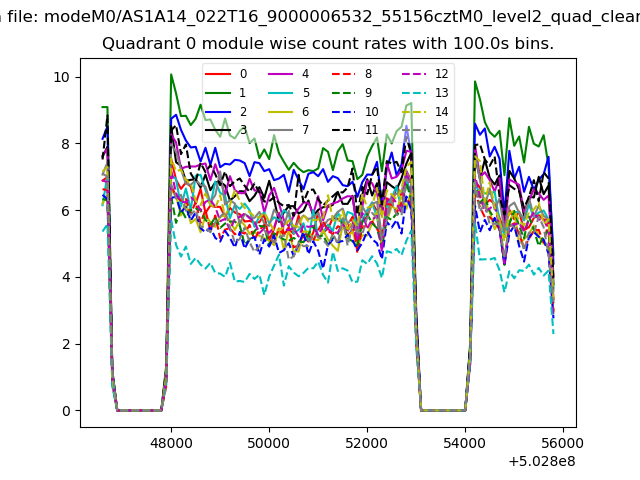 |
 |
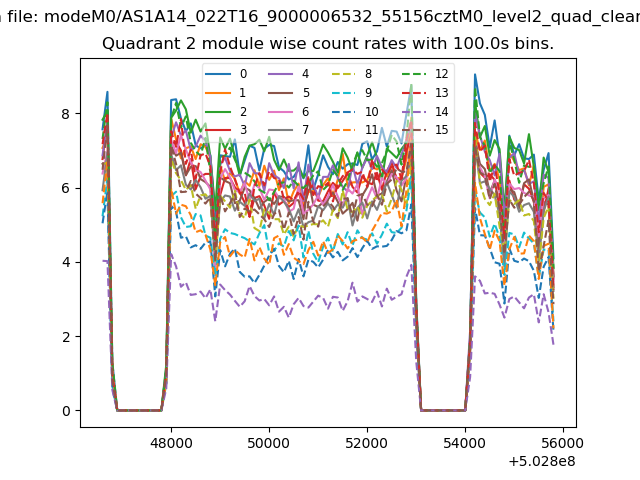
| Module-wise count rates for Quadrant B Data is divided into 100 sec bins |
 |
 |
| Module-wise count rates for Quadrant C Data is divided into 100 sec bins |
 |
 |
| Module-wise count rates for Quadrant D Data is divided into 100 sec bins |
 |
 |
| Parameter | Plot |
|---|---|
| CZT HV Monitor | 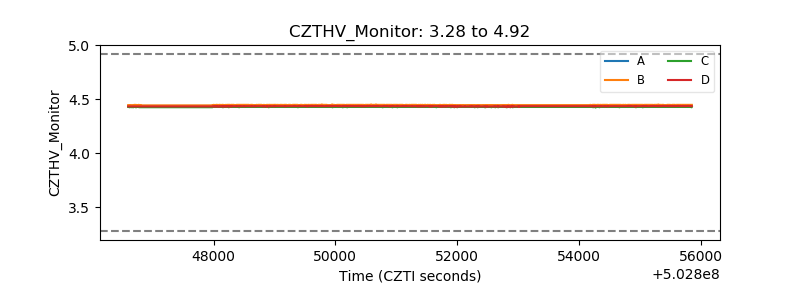 |
| D_VDD | 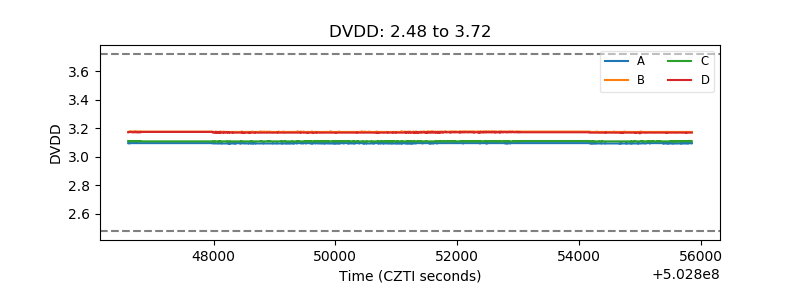 |
| Temperature 1 | 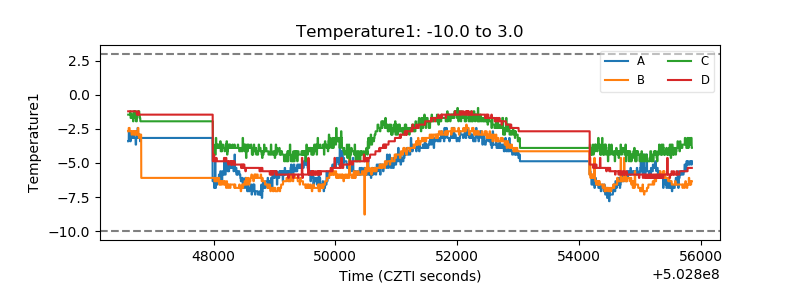 |
| Veto HV Monitor | 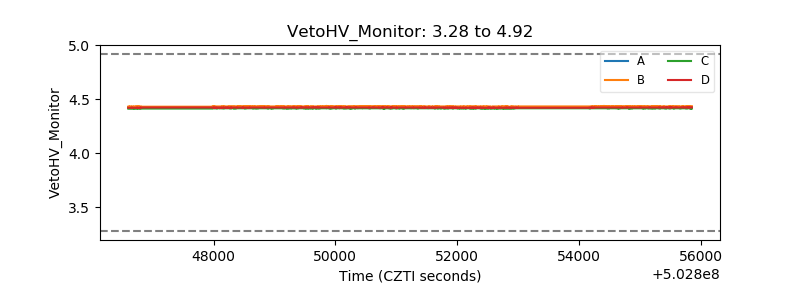 |
| Veto LLD | 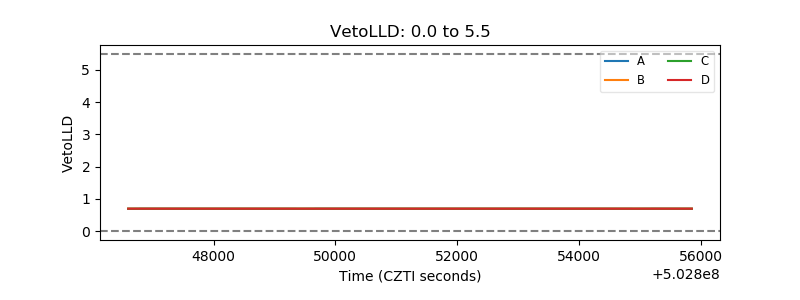 |
| Alpha Counter | 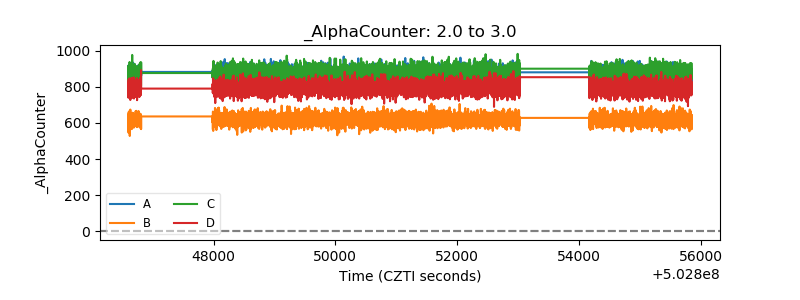 |
| _CPM_Rate | 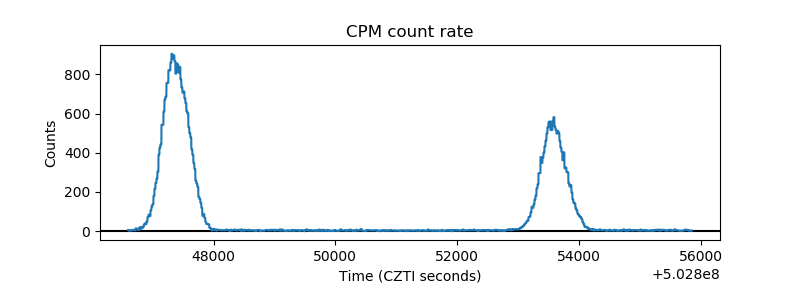 |
| CZT Counter | 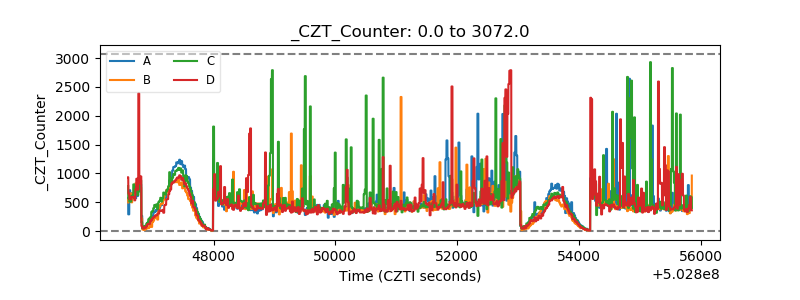 |
| +2.5 Volts monitor | 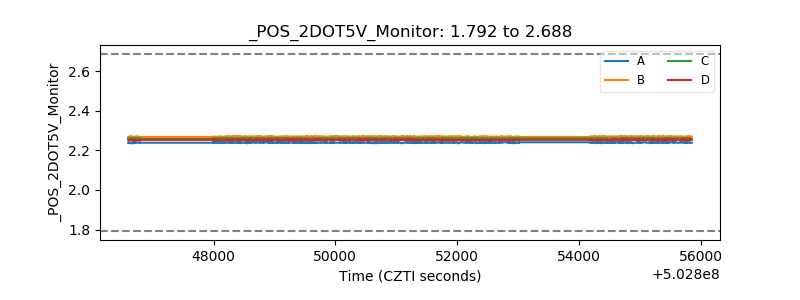 |
| +5 Volts monitor | 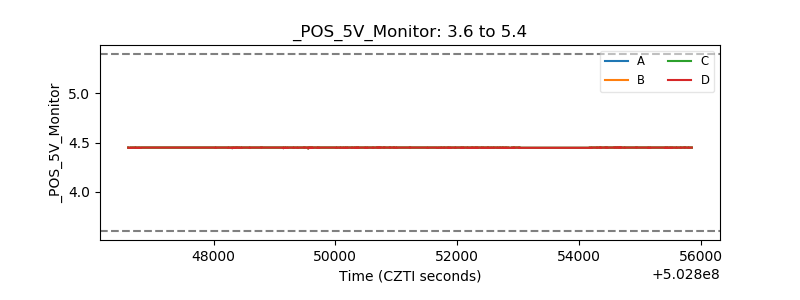 |
| _ROLL_ROT | 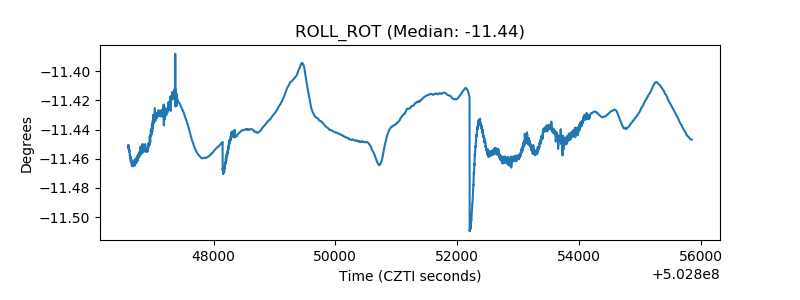 |
| _Roll_DEC | 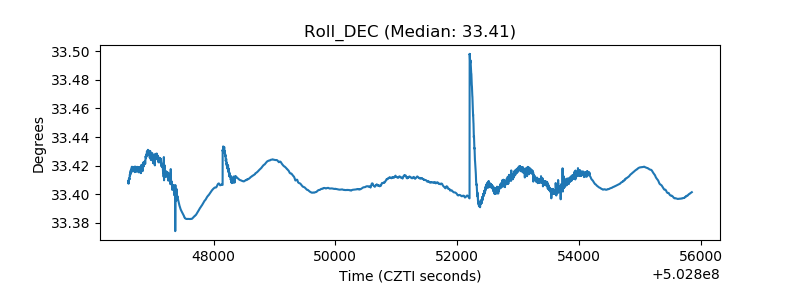 |
| _Roll_RA | 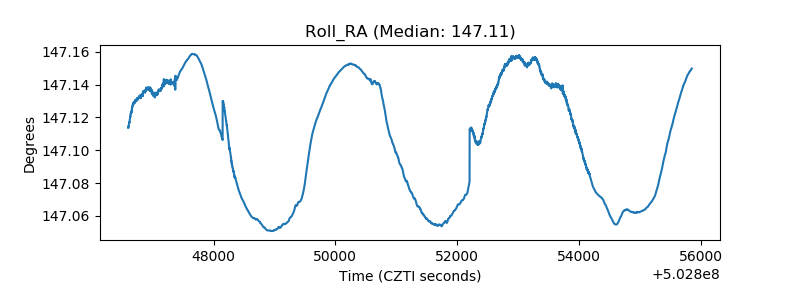 |
| Veto Counter | 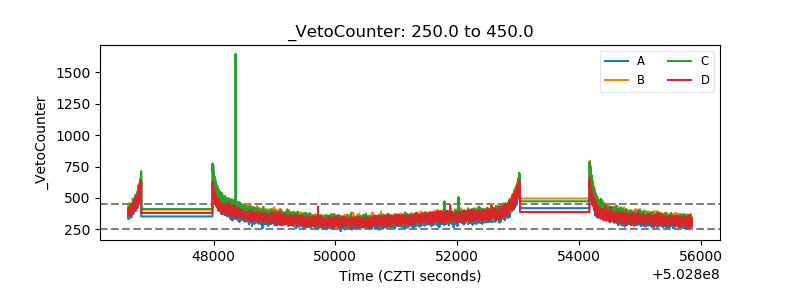 |