| Param | Original file | Final file |
|---|---|---|
| Filename | modeM0/AS1A14_022T16_9000006532_55157cztM0_level2.fits | modeM0/AS1A14_022T16_9000006532_55157cztM0_level2_quad_clean.evt |
| Size (bytes) | 462,816,000 | 103,714,560 |
| Size | 441.4 MB | 98.9 MB |
| Events in quadrant A | 4,432,026 | 677,981 |
| Events in quadrant B | 3,447,282 | 730,193 |
| Events in quadrant C | 4,346,025 | 639,771 |
| Events in quadrant D | 4,355,051 | 597,942 |
| Mode SS | |||
|---|---|---|---|
| Quadrant | BADHDUFLAG | Total packets | Discarded packets |
| A | 0 | 148 | 0 |
| B | 0 | 148 | 0 |
| C | 0 | 148 | 0 |
| D | 0 | 148 | 0 |
| Mode M0 | |||
|---|---|---|---|
| Quadrant | BADHDUFLAG | Total packets | Discarded packets |
| A | 0 | 18487 | 2 |
| B | 0 | 15748 | 2 |
| C | 0 | 17993 | 2 |
| D | 0 | 18116 | 2 |
| Mode M9 | |||
|---|---|---|---|
| Quadrant | BADHDUFLAG | Total packets | Discarded packets |
| A | 0 | 21 | 0 |
| B | 0 | 21 | 0 |
| C | 0 | 21 | 0 |
| D | 0 | 21 | 0 |
| Quadrant | Total seconds | Saturated seconds | Saturation percentage |
|---|---|---|---|
| A | 7095 | 181 | 2.551092% |
| B | 7095 | 202 | 2.847075% |
| C | 7096 | 243 | 3.424464% |
| D | 7096 | 198 | 2.790304% |
Noise dominated data is calculated using 1-second bins in cleaned event files. If a bin has >2000 counts, and if more than 50% of those come from <1% of pixels, then it is considered to be noise-dominated and hence unusable.
| Quadrant | # 1 sec bins | Bins with >0 counts | Bins with >2000 counts | High rate bins dominated by noise | Noise dominated (total time) | Noise dominated (detector-on time) | Marked lightcurve |
|---|---|---|---|---|---|---|---|
| A | 9240 | 7095 | 103 | 103 | 1.11% | 1.45% | 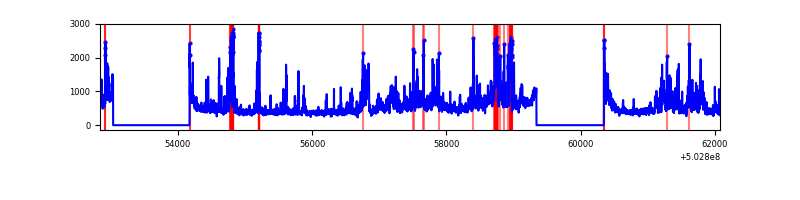 |
| B | 9240 | 7096 | 62 | 62 | 0.67% | 0.87% | 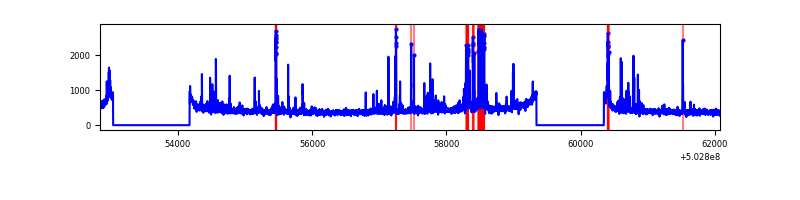 |
| C | 9241 | 7098 | 184 | 184 | 1.99% | 2.59% |  |
| D | 9241 | 7098 | 184 | 184 | 1.99% | 2.59% | 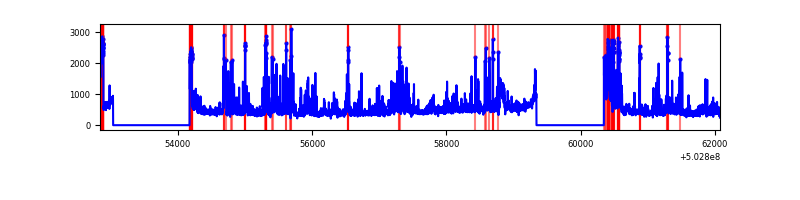 |
Top three noisy pixels from each quadrant. If the there are fewer than three noisy pixels in the level2.evt file, extra rows are filled as -1
| Pixel properties | Quadrant properties | ||||||
|---|---|---|---|---|---|---|---|
| Quadrant | DetID | PixID | Counts | Sigma | Mean | Median | Sigma |
| A | 3 | 78 | 765896 | 4011.61 | 759 | 741 | 190.7 |
| A | 12 | 115 | 612618 | 3208.0 | 759 | 741 | 190.7 |
| A | 0 | 8 | 82356 | 427.9 | 759 | 741 | 190.7 |
| B | 2 | 249 | 249040 | 1513.88 | 756 | 728 | 164.0 |
| B | 4 | 81 | 113040 | 684.73 | 756 | 728 | 164.0 |
| B | 0 | 182 | 56106 | 337.62 | 756 | 728 | 164.0 |
| C | 13 | 3 | 735630 | 3652.34 | 735 | 729 | 201.2 |
| C | 10 | 22 | 269187 | 1334.19 | 735 | 729 | 201.2 |
| C | 1 | 16 | 177384 | 877.95 | 735 | 729 | 201.2 |
| D | 11 | 129 | 341348 | 1658.82 | 724 | 690 | 205.4 |
| D | 3 | 12 | 335269 | 1629.22 | 724 | 690 | 205.4 |
| D | 11 | 224 | 236971 | 1150.56 | 724 | 690 | 205.4 |
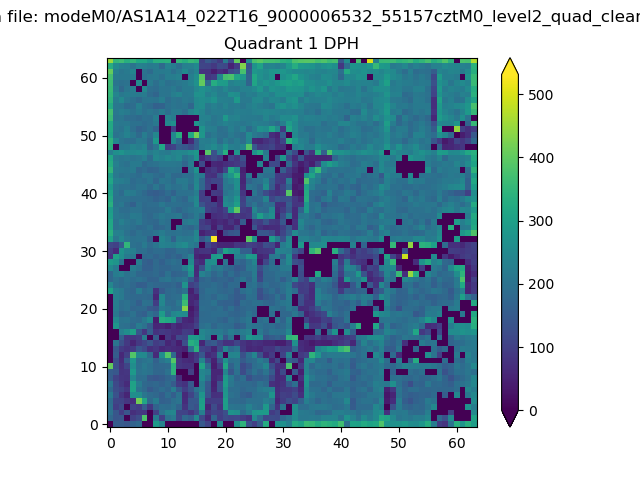
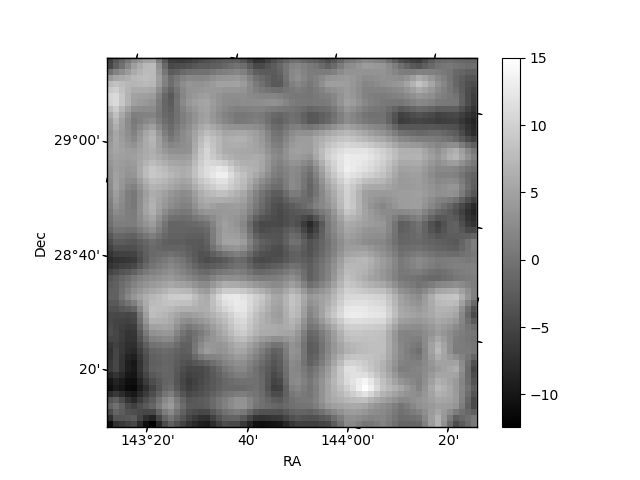
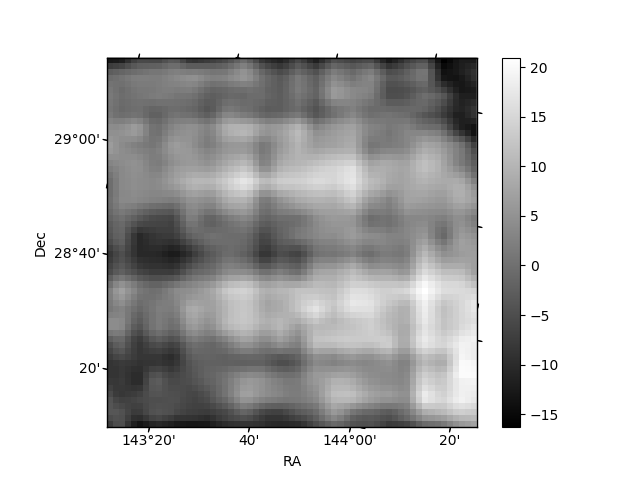
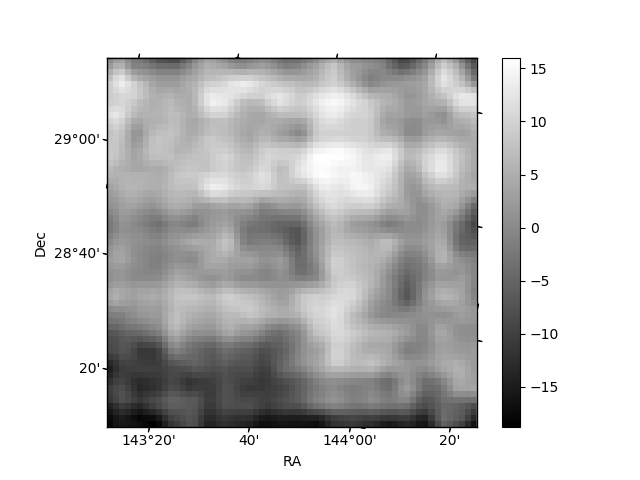
Histogram calculated using DETX and DETY for each event in the final _common_clean file
| Quadrant A | 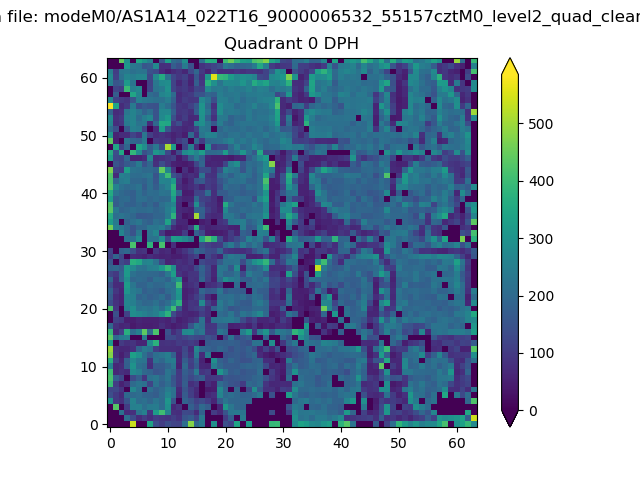 |
 |
Quadrant B |
|---|---|---|---|
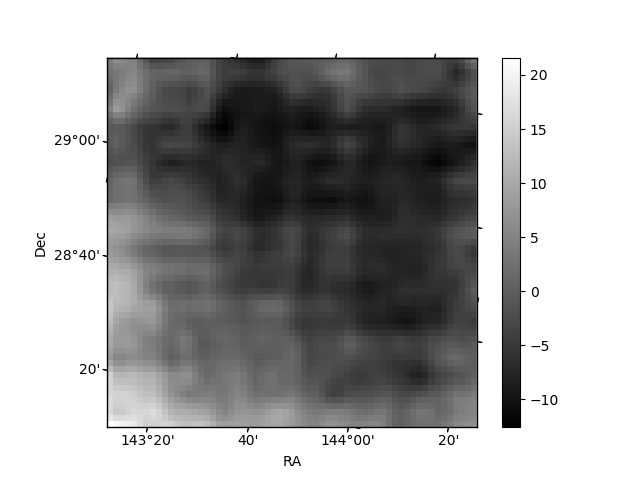
| Quadrant D | 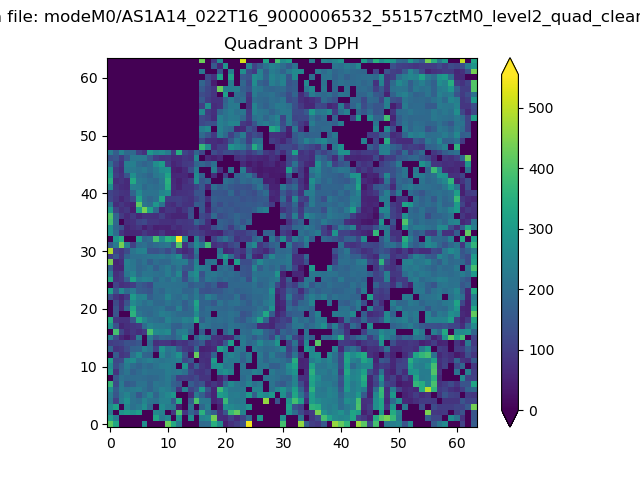 |
 |
Quadrant C |
| Plot type | Count rate plots | Images |
|---|---|---|
| Comparison with Poisson distribution Blue bars denote a histogram of data divided into 1 sec bins. Red curve is a Poisson curve with rate = median count rate of data. |
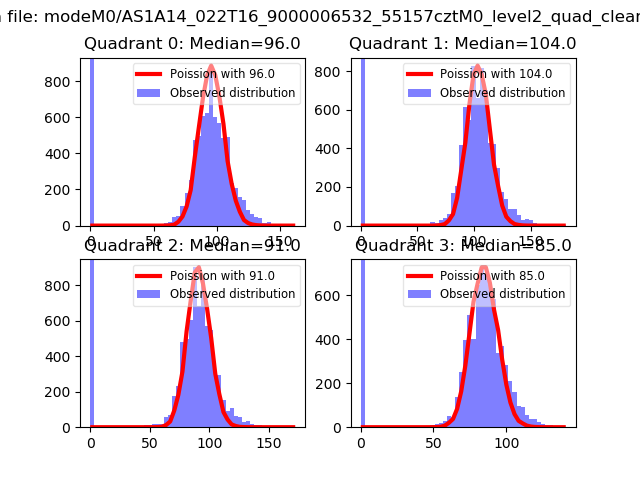 |
 |
| Quadrant-wise count rates Data is divided into 100 sec bins |
 |
|
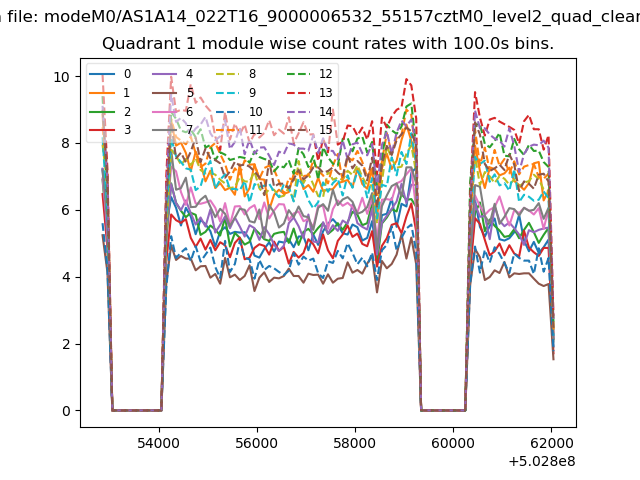
| Module-wise count rates for Quadrant A Data is divided into 100 sec bins |
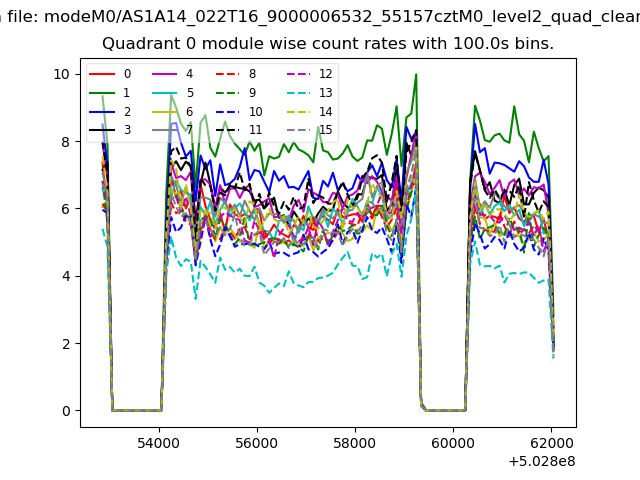 |
 |
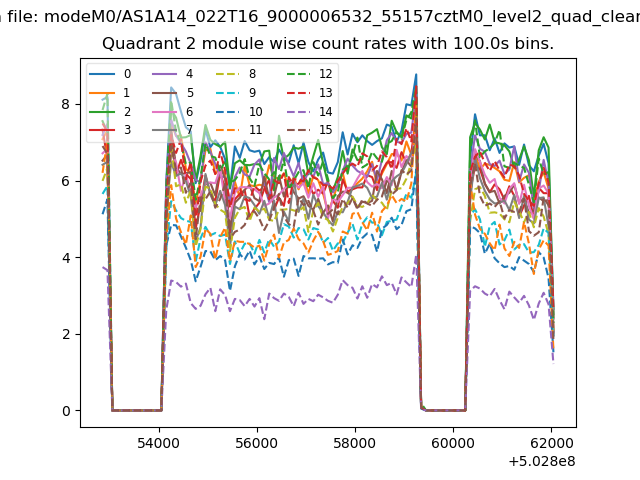
| Module-wise count rates for Quadrant B Data is divided into 100 sec bins |
 |
 |
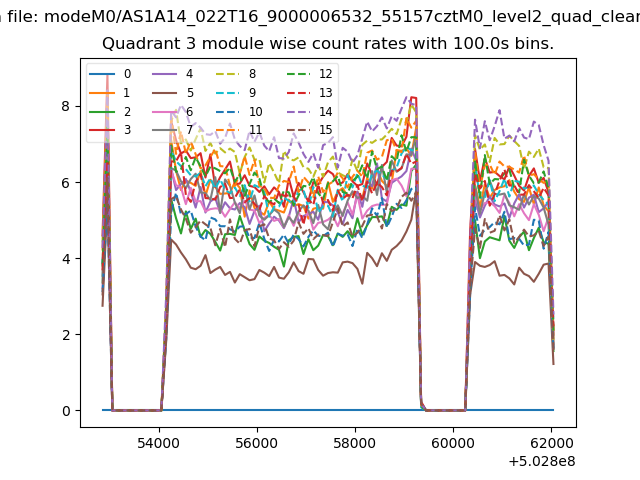
| Module-wise count rates for Quadrant C Data is divided into 100 sec bins |
 |
 |
| Module-wise count rates for Quadrant D Data is divided into 100 sec bins |
 |
 |
| Parameter | Plot |
|---|---|
| CZT HV Monitor | 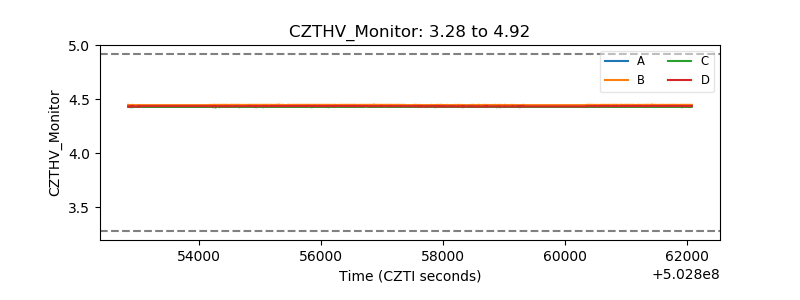 |
| D_VDD | 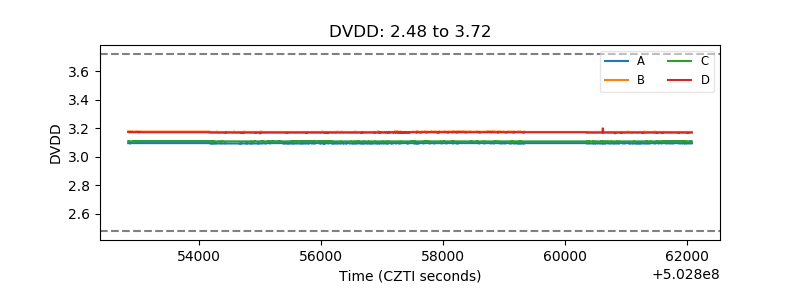 |
| Temperature 1 | 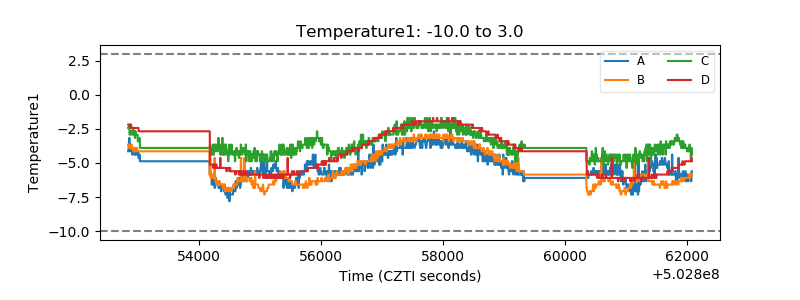 |
| Veto HV Monitor | 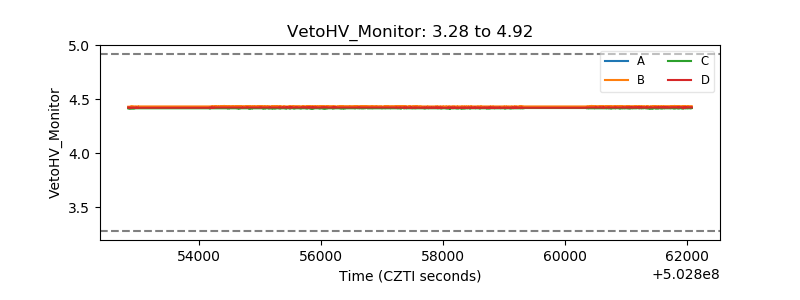 |
| Veto LLD | 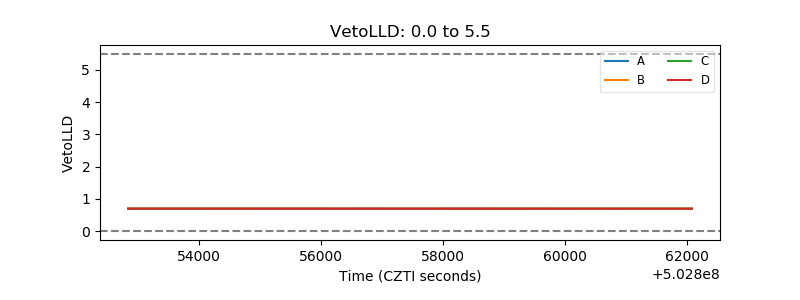 |
| Alpha Counter | 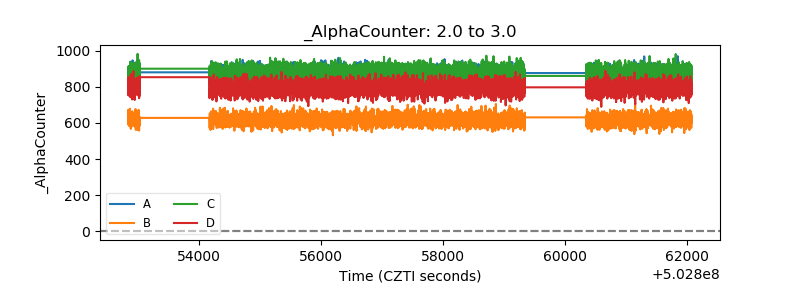 |
| _CPM_Rate | 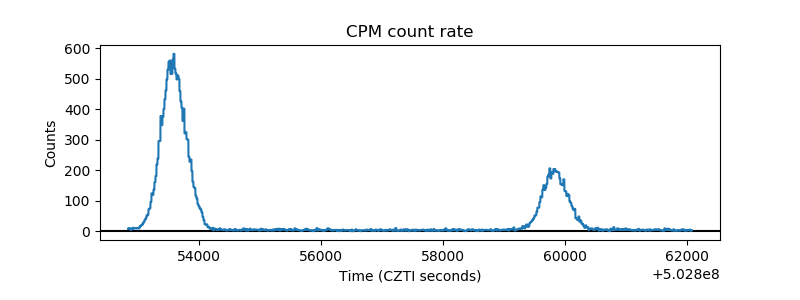 |
| CZT Counter | 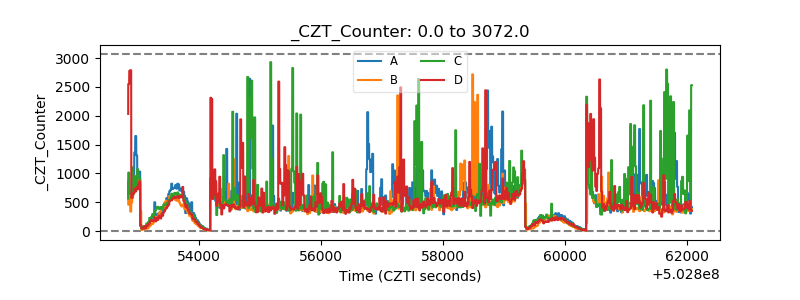 |
| +2.5 Volts monitor |  |
| +5 Volts monitor |  |
| _ROLL_ROT | 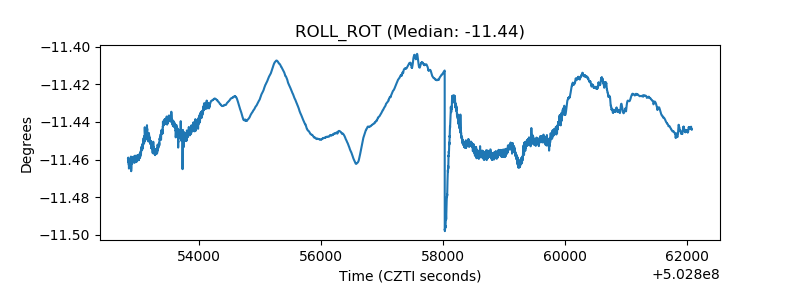 |
| _Roll_DEC | 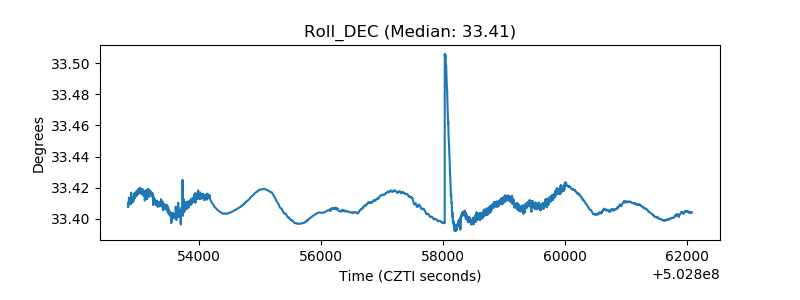 |
| _Roll_RA |  |
| Veto Counter | 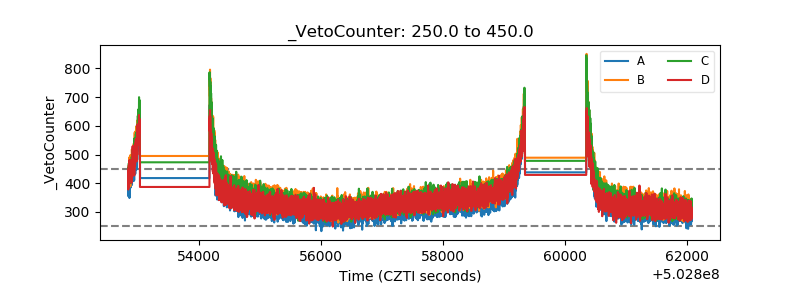 |