| Param | Original file | Final file |
|---|---|---|
| Filename | modeM0/AS1A14_022T16_9000006532_55158cztM0_level2.fits | modeM0/AS1A14_022T16_9000006532_55158cztM0_level2_quad_clean.evt |
| Size (bytes) | 436,933,440 | 102,660,480 |
| Size | 416.7 MB | 97.9 MB |
| Events in quadrant A | 4,493,652 | 656,665 |
| Events in quadrant B | 3,358,007 | 720,506 |
| Events in quadrant C | 4,090,844 | 634,473 |
| Events in quadrant D | 3,673,345 | 597,248 |
| Mode SS | |||
|---|---|---|---|
| Quadrant | BADHDUFLAG | Total packets | Discarded packets |
| A | 0 | 146 | 0 |
| B | 0 | 146 | 0 |
| C | 0 | 146 | 0 |
| D | 0 | 146 | 0 |
| Mode M0 | |||
|---|---|---|---|
| Quadrant | BADHDUFLAG | Total packets | Discarded packets |
| A | 0 | 18633 | 2 |
| B | 0 | 15612 | 2 |
| C | 0 | 17349 | 2 |
| D | 0 | 16344 | 2 |
| Mode M9 | |||
|---|---|---|---|
| Quadrant | BADHDUFLAG | Total packets | Discarded packets |
| A | 0 | 15 | 0 |
| B | 0 | 16 | 0 |
| C | 0 | 16 | 0 |
| D | 0 | 16 | 0 |
| Quadrant | Total seconds | Saturated seconds | Saturation percentage |
|---|---|---|---|
| A | 7174 | 268 | 3.735712% |
| B | 7174 | 152 | 2.118762% |
| C | 7174 | 178 | 2.481182% |
| D | 7174 | 134 | 1.867856% |
Noise dominated data is calculated using 1-second bins in cleaned event files. If a bin has >2000 counts, and if more than 50% of those come from <1% of pixels, then it is considered to be noise-dominated and hence unusable.
| Quadrant | # 1 sec bins | Bins with >0 counts | Bins with >2000 counts | High rate bins dominated by noise | Noise dominated (total time) | Noise dominated (detector-on time) | Marked lightcurve |
|---|---|---|---|---|---|---|---|
| A | 7869 | 7175 | 176 | 176 | 2.24% | 2.45% | 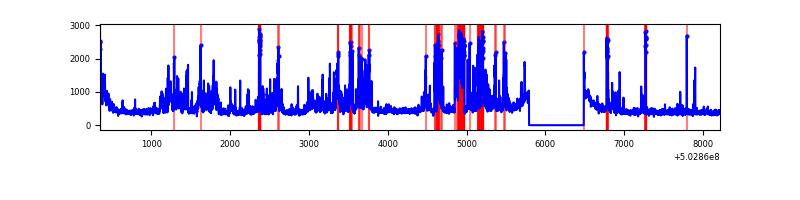 |
| B | 7868 | 7174 | 18 | 18 | 0.23% | 0.25% | 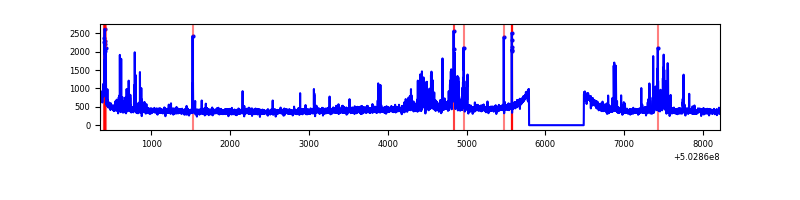 |
| C | 7868 | 7173 | 125 | 125 | 1.59% | 1.74% | 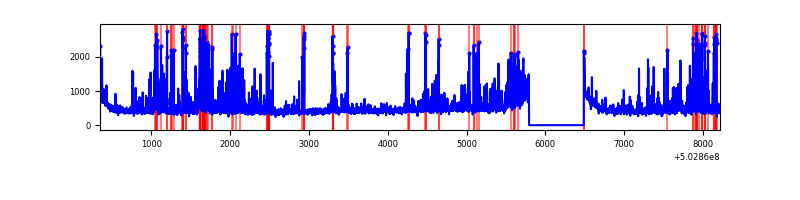 |
| D | 7868 | 7174 | 87 | 87 | 1.11% | 1.21% | 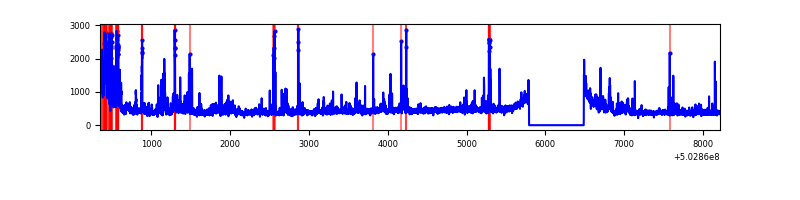 |
Top three noisy pixels from each quadrant. If the there are fewer than three noisy pixels in the level2.evt file, extra rows are filled as -1
| Pixel properties | Quadrant properties | ||||||
|---|---|---|---|---|---|---|---|
| Quadrant | DetID | PixID | Counts | Sigma | Mean | Median | Sigma |
| A | 3 | 78 | 1101569 | 5956.83 | 755 | 735 | 184.8 |
| A | 12 | 115 | 381940 | 2062.78 | 755 | 735 | 184.8 |
| A | 4 | 207 | 19627 | 102.23 | 755 | 735 | 184.8 |
| B | 2 | 249 | 177826 | 1086.44 | 751 | 722 | 163.0 |
| B | 5 | 185 | 90966 | 553.6 | 751 | 722 | 163.0 |
| B | 4 | 81 | 86536 | 526.42 | 751 | 722 | 163.0 |
| C | 13 | 3 | 554242 | 2738.22 | 734 | 725 | 202.1 |
| C | 6 | 223 | 132064 | 649.73 | 734 | 725 | 202.1 |
| C | 1 | 16 | 127782 | 628.54 | 734 | 725 | 202.1 |
| D | 3 | 12 | 304263 | 1467.2 | 732 | 700 | 206.9 |
| D | 8 | 160 | 122764 | 589.97 | 732 | 700 | 206.9 |
| D | 11 | 129 | 112453 | 540.13 | 732 | 700 | 206.9 |
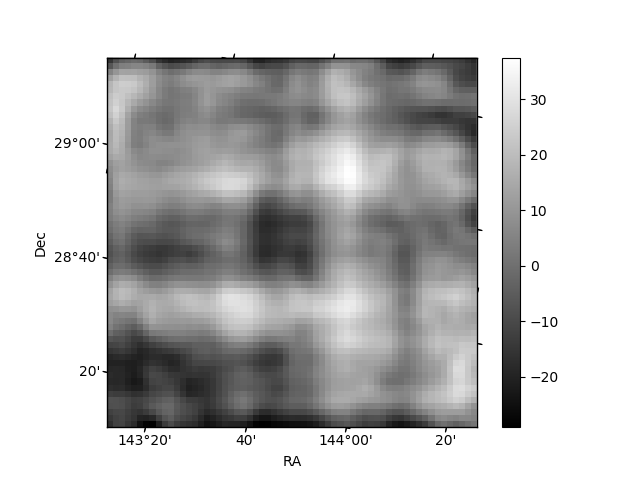
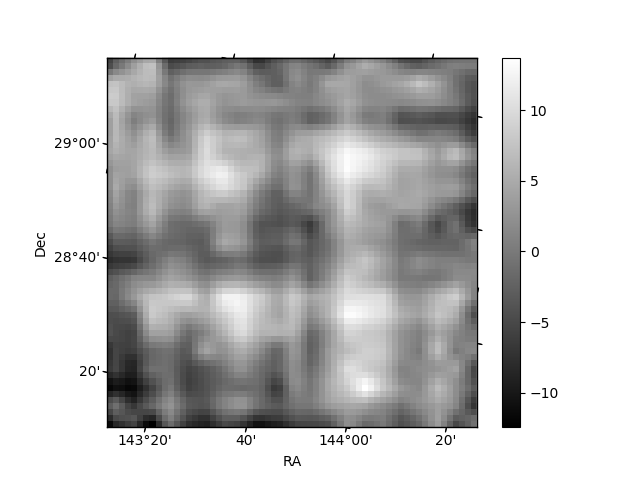
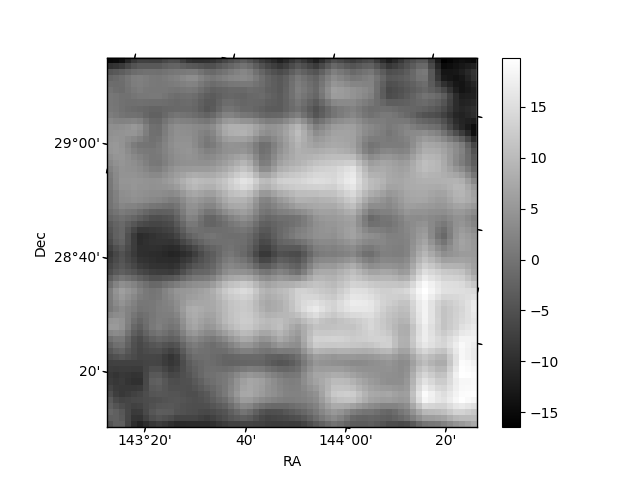
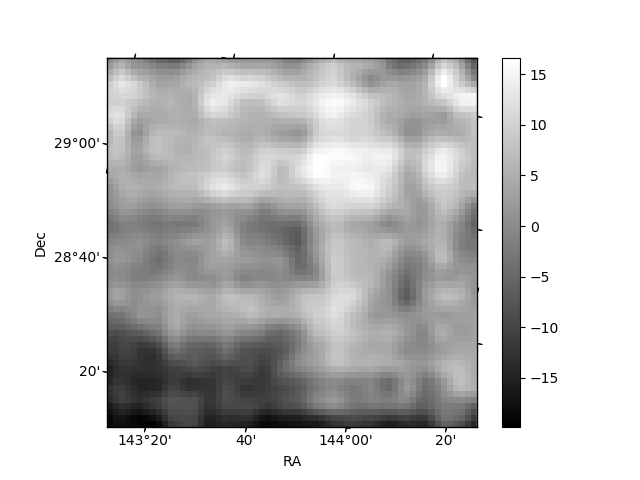
Histogram calculated using DETX and DETY for each event in the final _common_clean file
| Quadrant A | 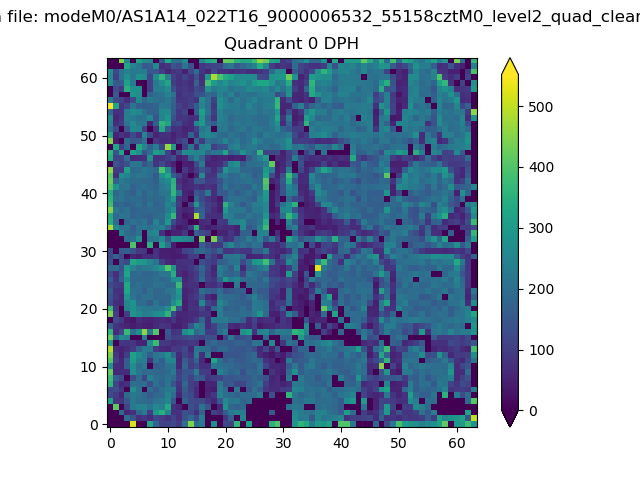 |
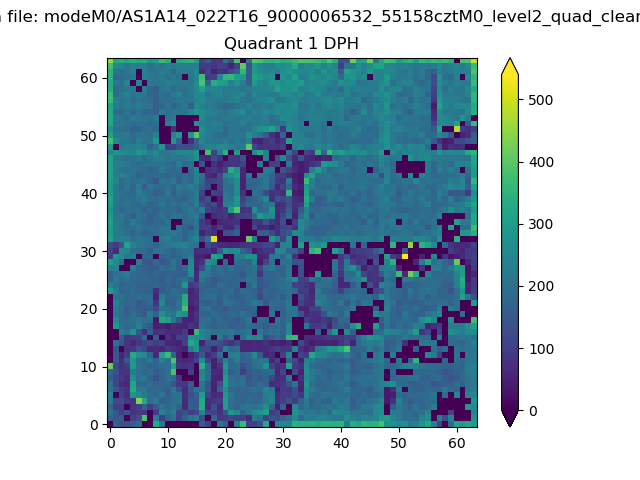 |
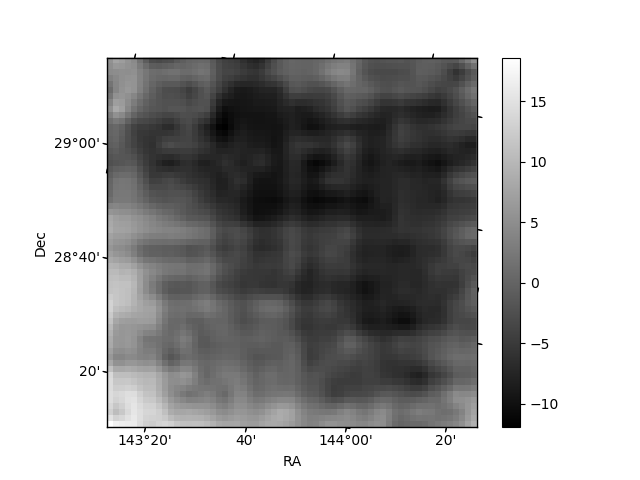
Quadrant B |
|---|---|---|---|
| Quadrant D | 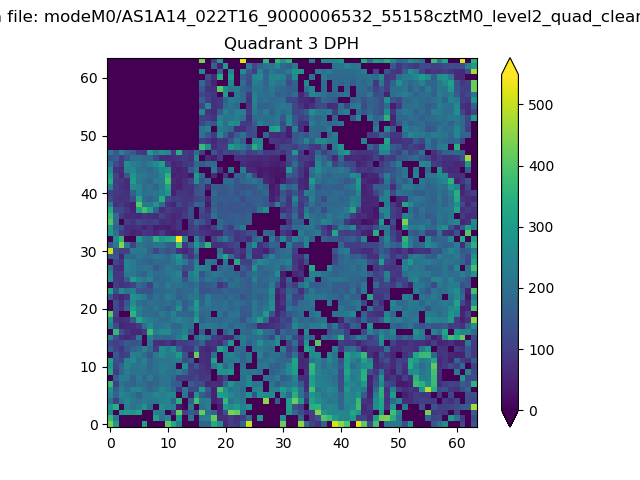 |
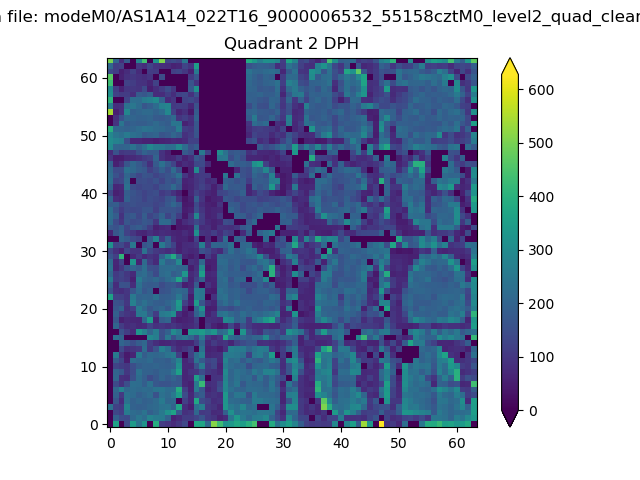 |
Quadrant C |
| Plot type | Count rate plots | Images |
|---|---|---|
| Comparison with Poisson distribution Blue bars denote a histogram of data divided into 1 sec bins. Red curve is a Poisson curve with rate = median count rate of data. |
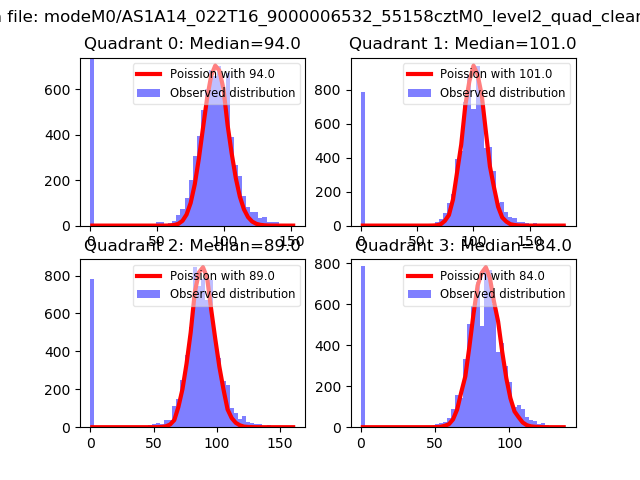 |
 |
| Quadrant-wise count rates Data is divided into 100 sec bins |
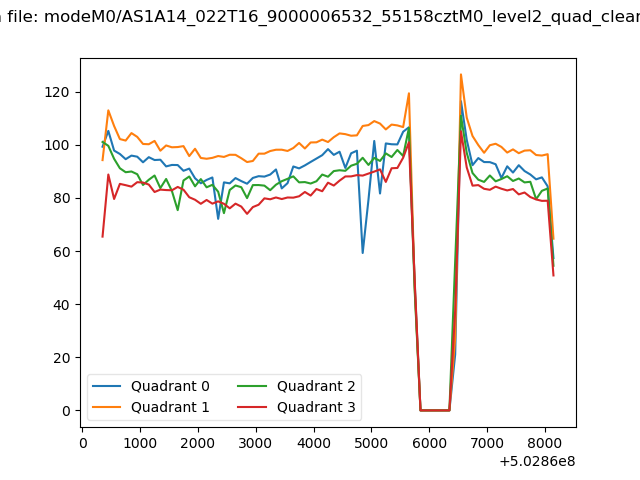 |
|
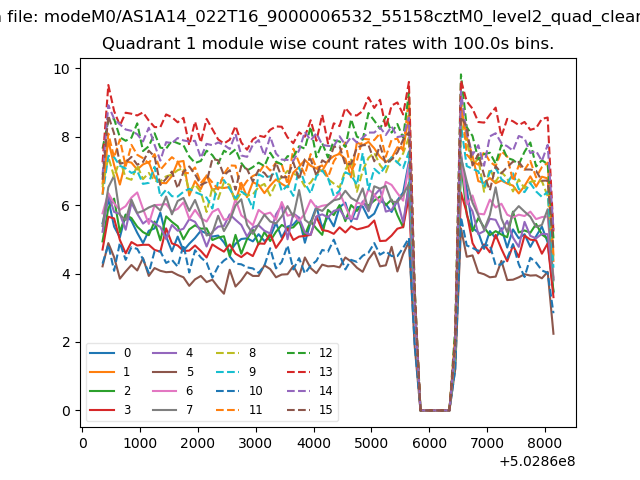
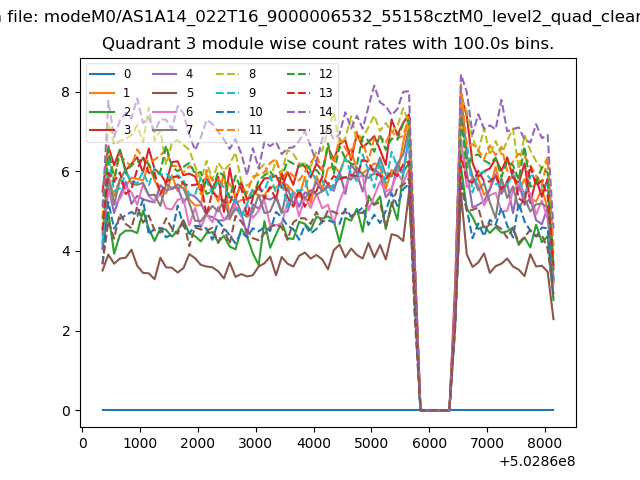
| Module-wise count rates for Quadrant A Data is divided into 100 sec bins |
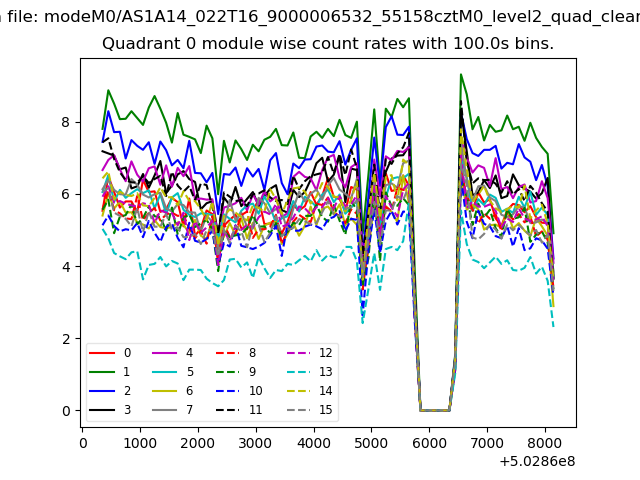 |
 |
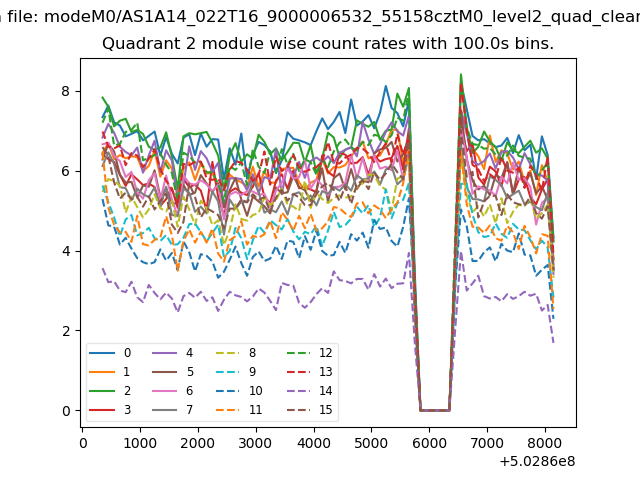
| Module-wise count rates for Quadrant B Data is divided into 100 sec bins |
 |
 |
| Module-wise count rates for Quadrant C Data is divided into 100 sec bins |
 |
 |
| Module-wise count rates for Quadrant D Data is divided into 100 sec bins |
 |
 |
| Parameter | Plot |
|---|---|
| CZT HV Monitor | 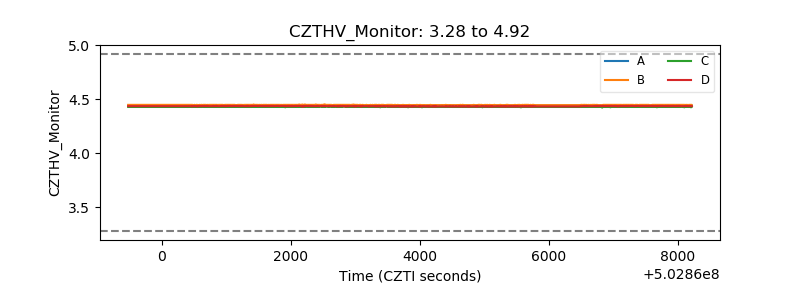 |
| D_VDD | 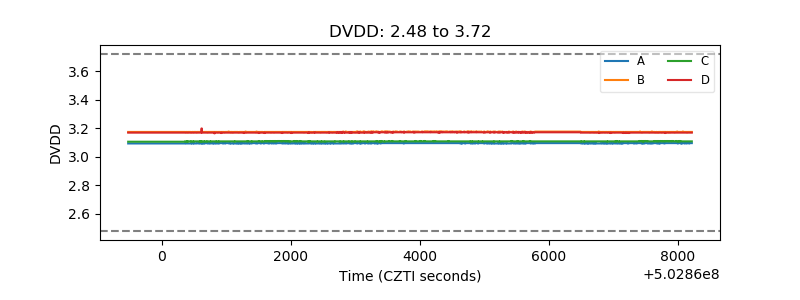 |
| Temperature 1 | 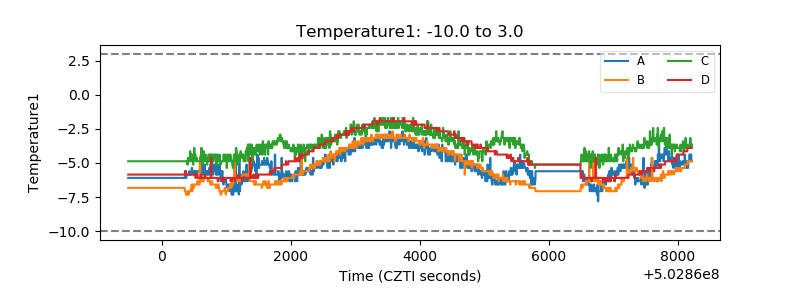 |
| Veto HV Monitor | 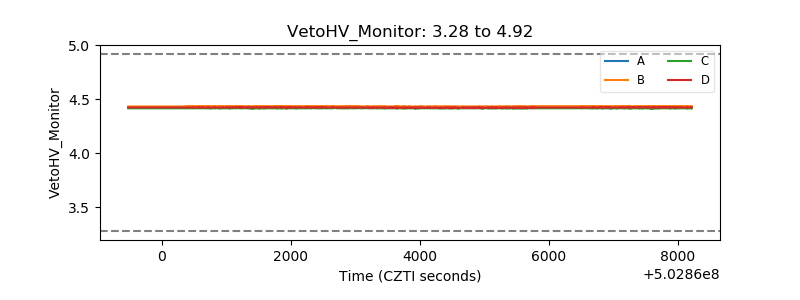 |
| Veto LLD | 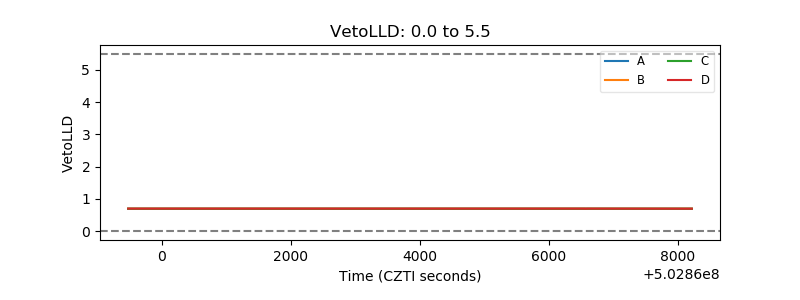 |
| Alpha Counter | 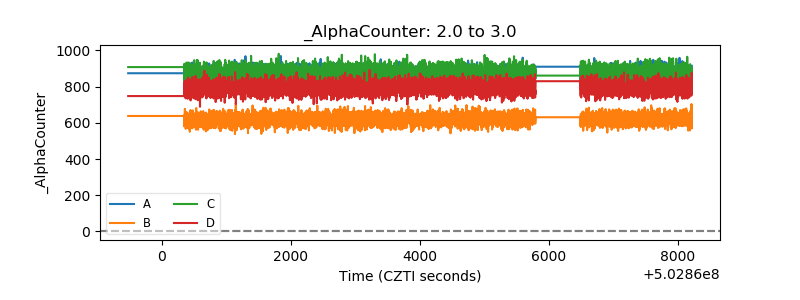 |
| _CPM_Rate | 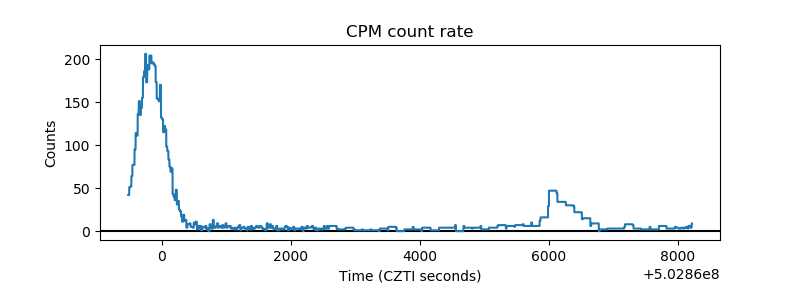 |
| CZT Counter | 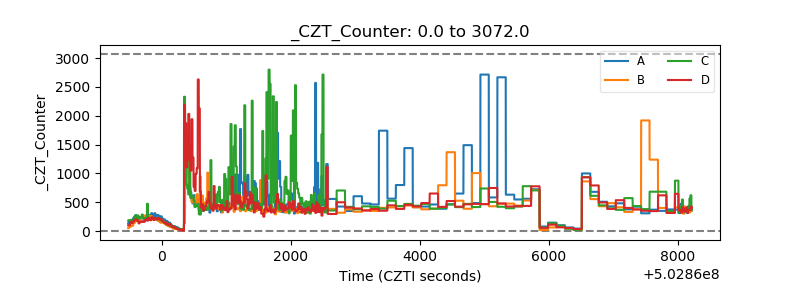 |
| +2.5 Volts monitor |  |
| +5 Volts monitor | 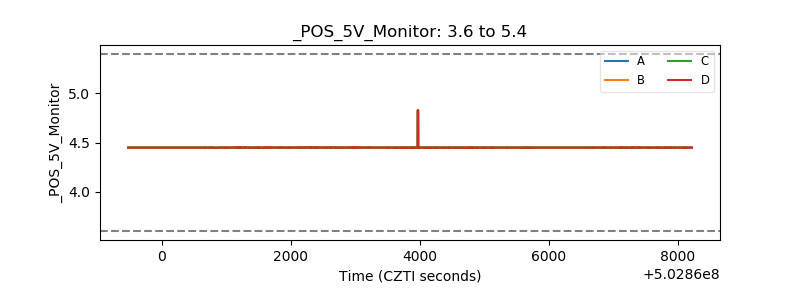 |
| _ROLL_ROT | 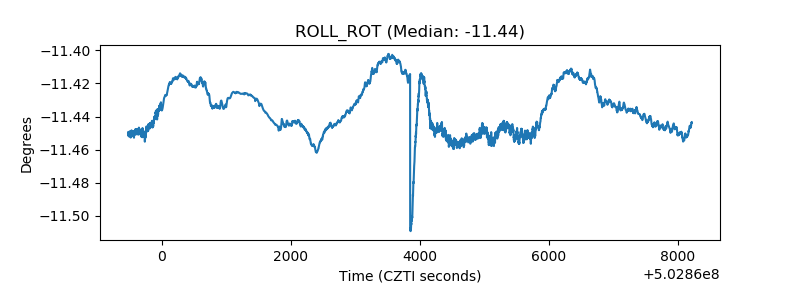 |
| _Roll_DEC | 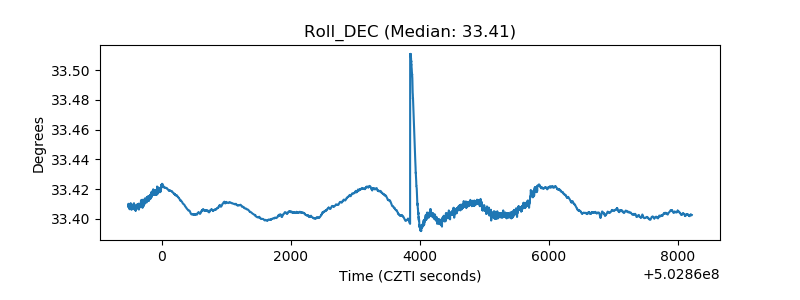 |
| _Roll_RA | 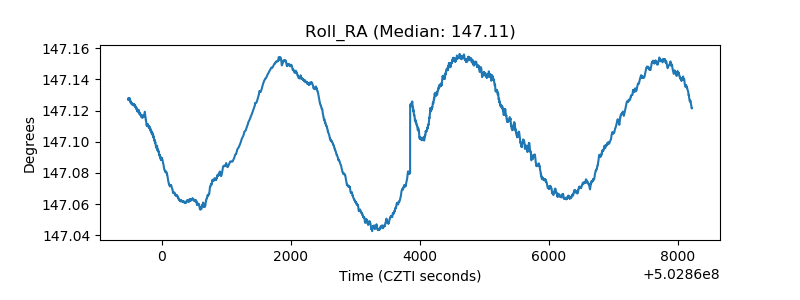 |
| Veto Counter | 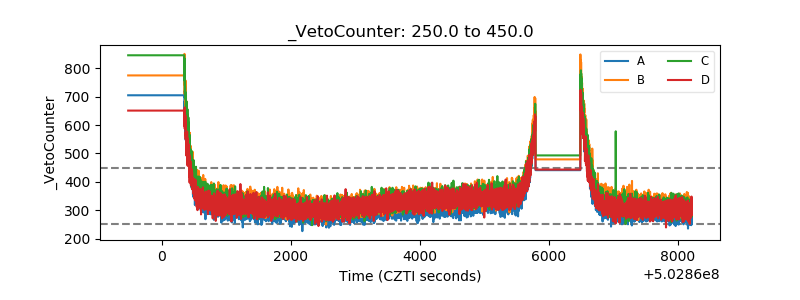 |