| Param | Original file | Final file |
|---|---|---|
| Filename | modeM0/AS1A14_022T16_9000006532_55159cztM0_level2.fits | modeM0/AS1A14_022T16_9000006532_55159cztM0_level2_quad_clean.evt |
| Size (bytes) | 459,282,240 | 110,001,600 |
| Size | 438.0 MB | 104.9 MB |
| Events in quadrant A | 4,412,005 | 700,102 |
| Events in quadrant B | 4,029,574 | 762,255 |
| Events in quadrant C | 4,175,827 | 682,112 |
| Events in quadrant D | 3,781,602 | 647,876 |
| Mode SS | |||
|---|---|---|---|
| Quadrant | BADHDUFLAG | Total packets | Discarded packets |
| A | 0 | 156 | 0 |
| B | 0 | 156 | 0 |
| C | 0 | 156 | 0 |
| D | 0 | 156 | 0 |
| Mode M0 | |||
|---|---|---|---|
| Quadrant | BADHDUFLAG | Total packets | Discarded packets |
| A | 0 | 18742 | 0 |
| B | 0 | 17956 | 0 |
| C | 0 | 18011 | 0 |
| D | 0 | 17001 | 0 |
| Quadrant | Total seconds | Saturated seconds | Saturation percentage |
|---|---|---|---|
| A | 7739 | 330 | 4.264117% |
| B | 7739 | 288 | 3.721411% |
| C | 7739 | 125 | 1.615196% |
| D | 7740 | 52 | 0.671835% |
Noise dominated data is calculated using 1-second bins in cleaned event files. If a bin has >2000 counts, and if more than 50% of those come from <1% of pixels, then it is considered to be noise-dominated and hence unusable.
| Quadrant | # 1 sec bins | Bins with >0 counts | Bins with >2000 counts | High rate bins dominated by noise | Noise dominated (total time) | Noise dominated (detector-on time) | Marked lightcurve |
|---|---|---|---|---|---|---|---|
| A | 7738 | 7738 | 163 | 163 | 2.11% | 2.11% | 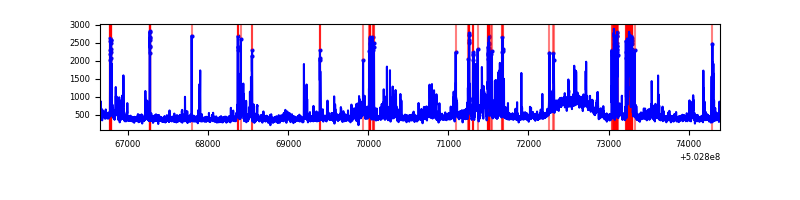 |
| B | 7738 | 7738 | 94 | 94 | 1.21% | 1.21% | 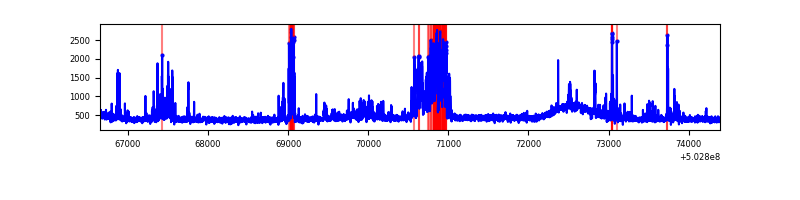 |
| C | 7738 | 7738 | 70 | 70 | 0.90% | 0.90% | 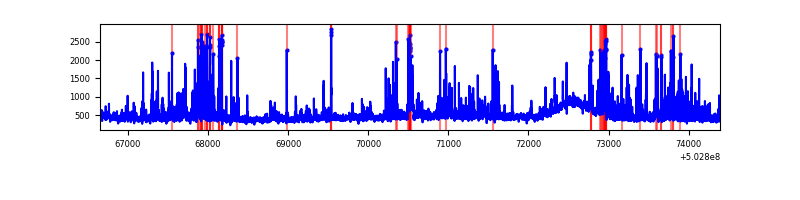 |
| D | 7739 | 7739 | 7 | 7 | 0.09% | 0.09% | 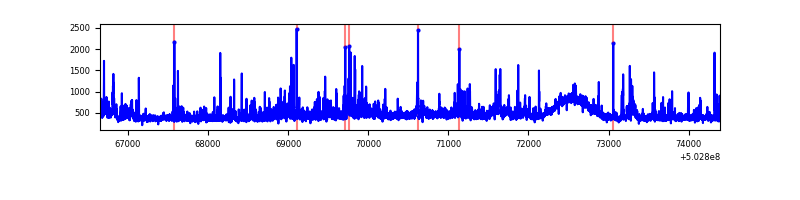 |
Top three noisy pixels from each quadrant. If the there are fewer than three noisy pixels in the level2.evt file, extra rows are filled as -1
| Pixel properties | Quadrant properties | ||||||
|---|---|---|---|---|---|---|---|
| Quadrant | DetID | PixID | Counts | Sigma | Mean | Median | Sigma |
| A | 3 | 78 | 1048902 | 5108.68 | 824 | 801 | 205.2 |
| A | 4 | 78 | 57140 | 274.61 | 824 | 801 | 205.2 |
| A | 0 | 8 | 32519 | 154.6 | 824 | 801 | 205.2 |
| B | 2 | 249 | 446837 | 2514.88 | 815 | 782 | 177.4 |
| B | 5 | 185 | 263276 | 1479.95 | 815 | 782 | 177.4 |
| B | 0 | 182 | 37621 | 207.7 | 815 | 782 | 177.4 |
| C | 13 | 3 | 451497 | 2050.22 | 803 | 798 | 219.8 |
| C | 1 | 16 | 166934 | 755.75 | 803 | 798 | 219.8 |
| C | 10 | 22 | 91421 | 412.24 | 803 | 798 | 219.8 |
| D | 2 | 249 | 273071 | 1207.26 | 806 | 772 | 225.6 |
| D | 3 | 12 | 81272 | 356.9 | 806 | 772 | 225.6 |
| D | 11 | 129 | 78790 | 345.9 | 806 | 772 | 225.6 |
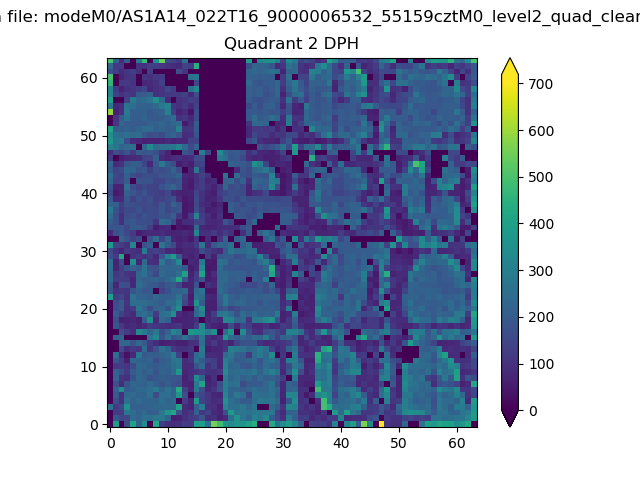
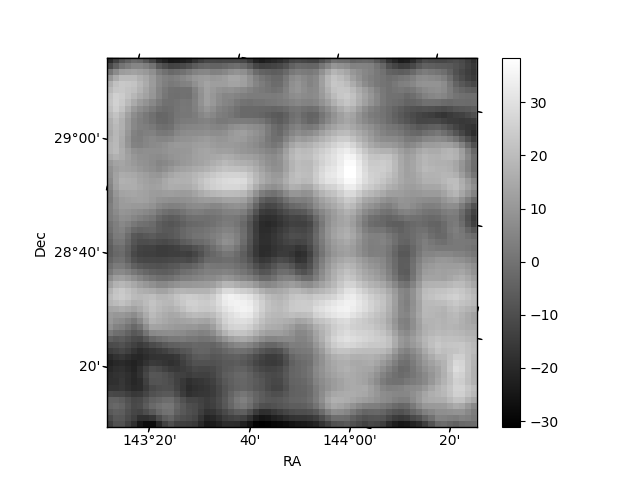
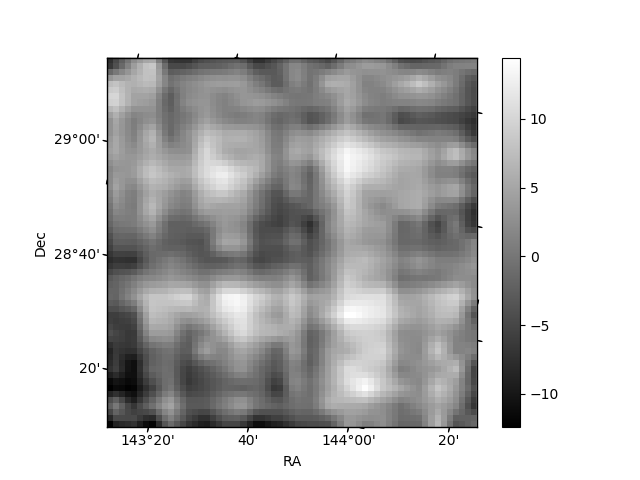
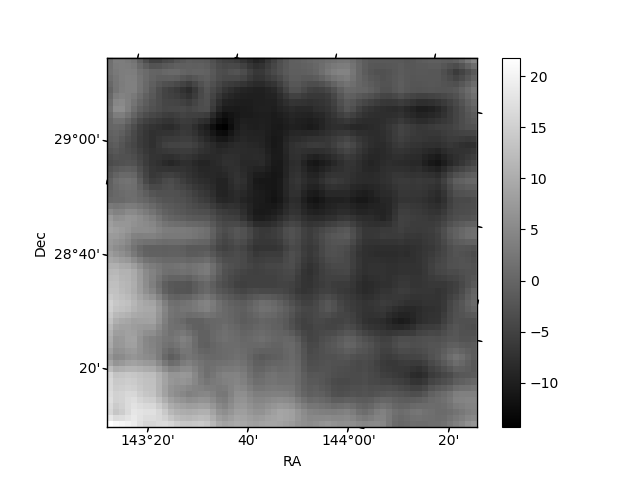
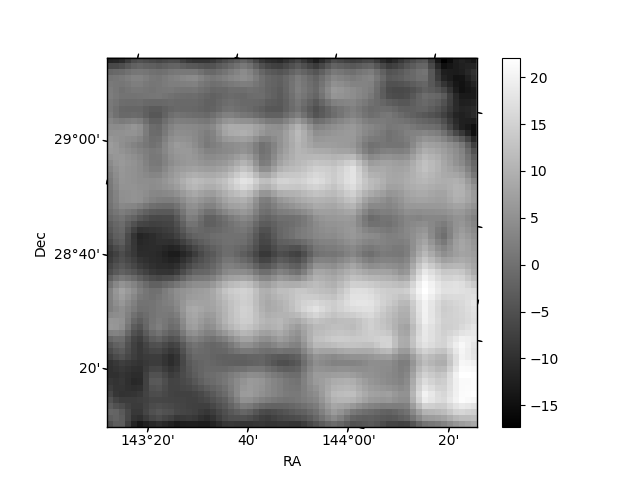
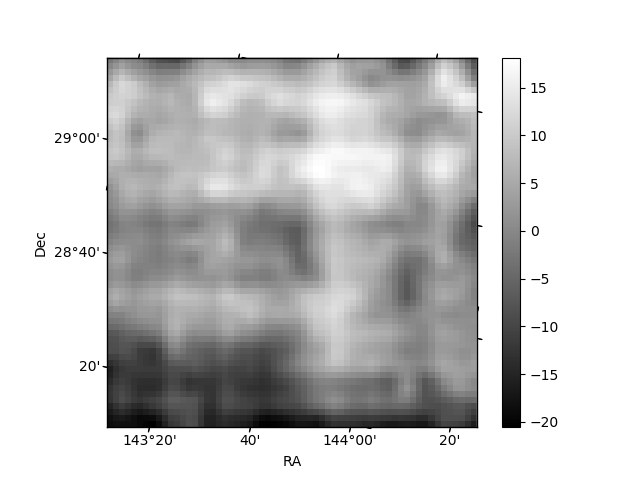
Histogram calculated using DETX and DETY for each event in the final _common_clean file
| Quadrant A | 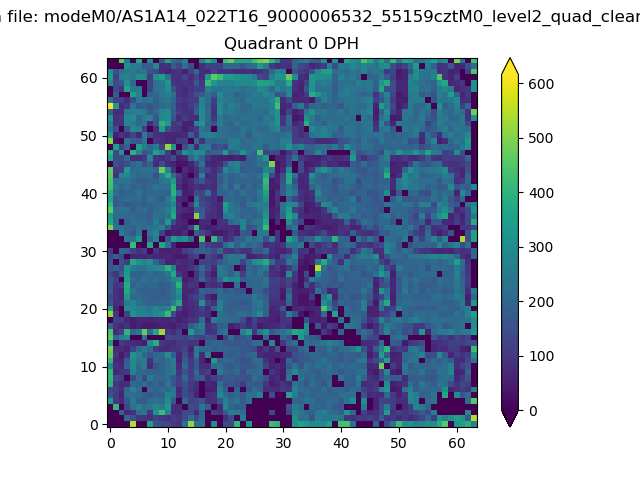 |
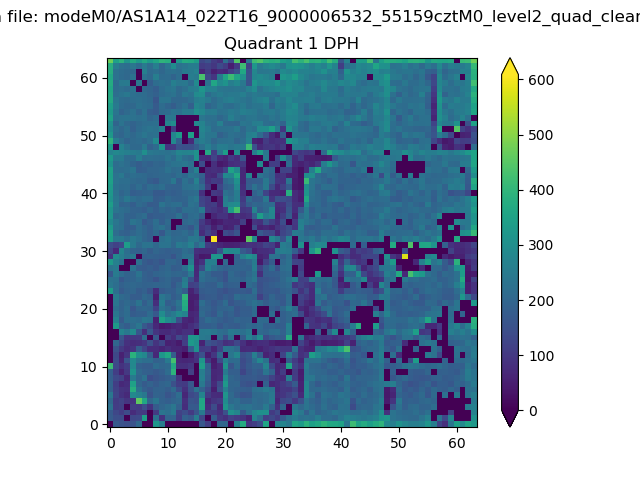 |
Quadrant B |
|---|---|---|---|
| Quadrant D | 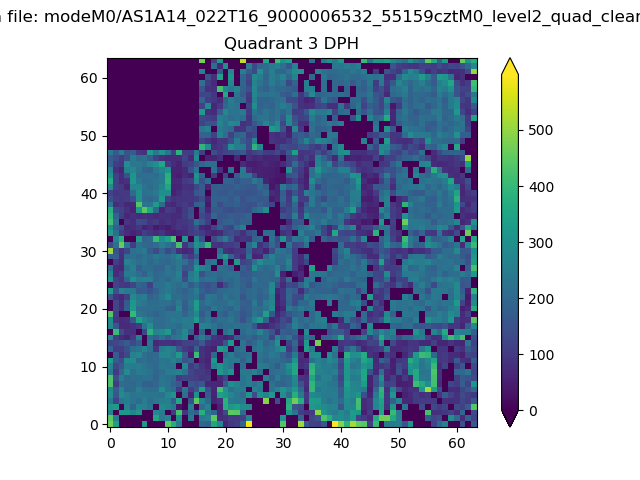 |
 |
Quadrant C |
| Plot type | Count rate plots | Images |
|---|---|---|
| Comparison with Poisson distribution Blue bars denote a histogram of data divided into 1 sec bins. Red curve is a Poisson curve with rate = median count rate of data. |
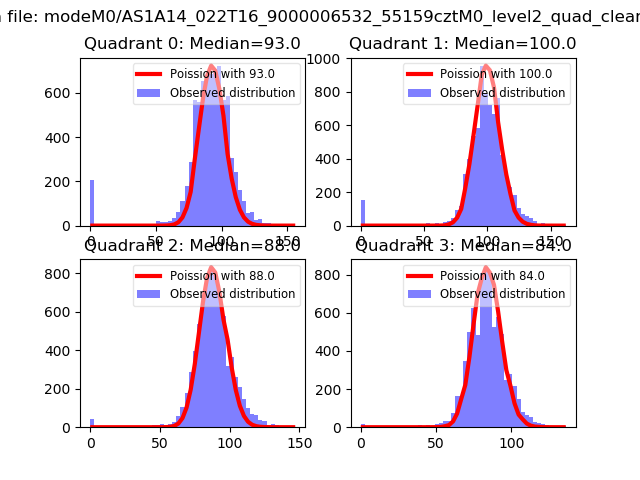 |
 |
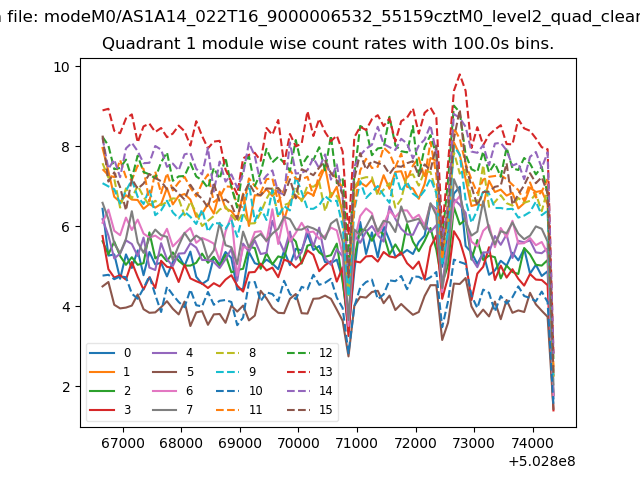
| Quadrant-wise count rates Data is divided into 100 sec bins |
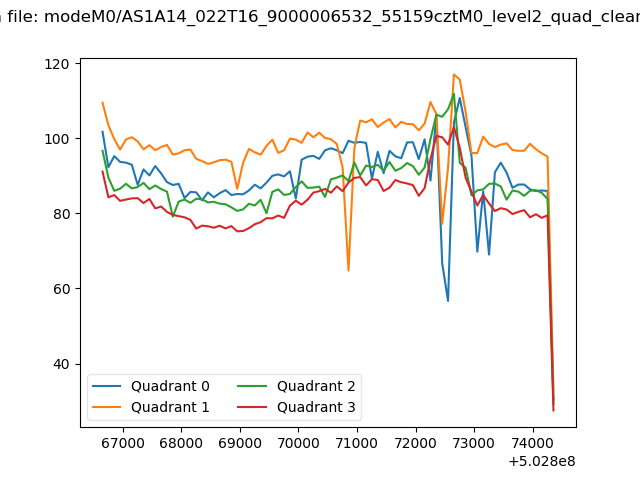 |
|
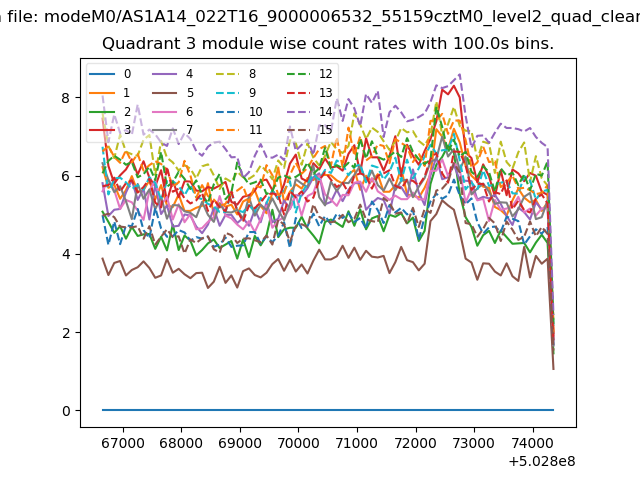
| Module-wise count rates for Quadrant A Data is divided into 100 sec bins |
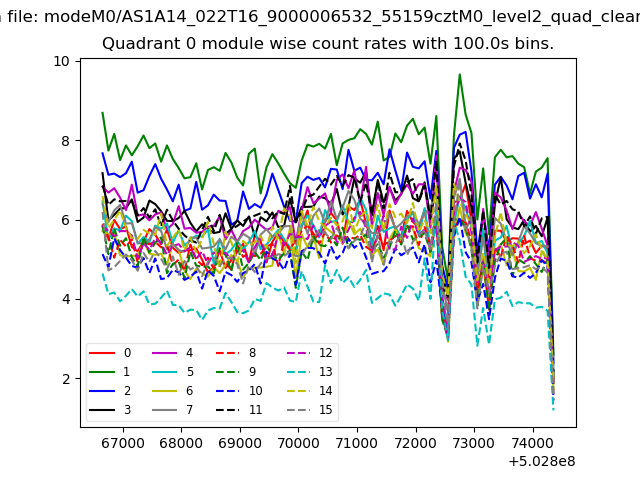 |
 |
| Module-wise count rates for Quadrant B Data is divided into 100 sec bins |
 |
 |
| Module-wise count rates for Quadrant C Data is divided into 100 sec bins |
 |
 |
| Module-wise count rates for Quadrant D Data is divided into 100 sec bins |
 |
 |
| Parameter | Plot |
|---|---|
| CZT HV Monitor | 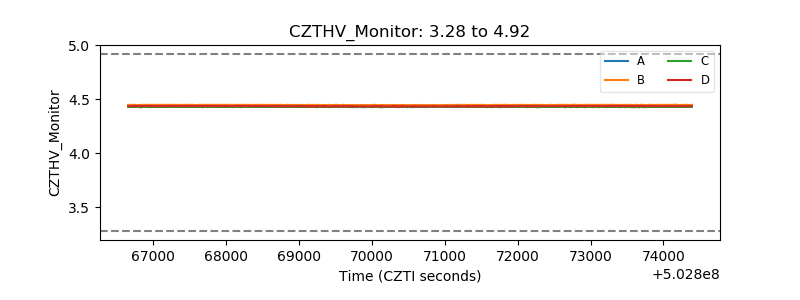 |
| D_VDD | 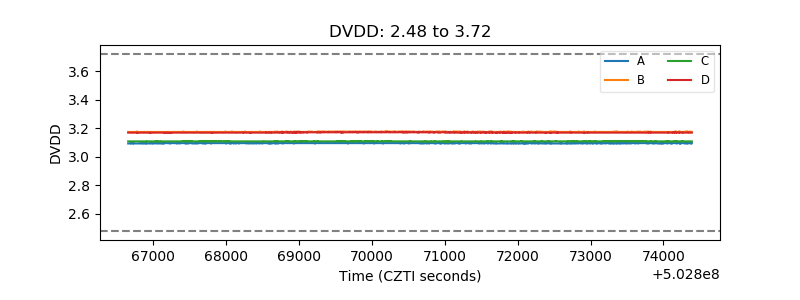 |
| Temperature 1 | 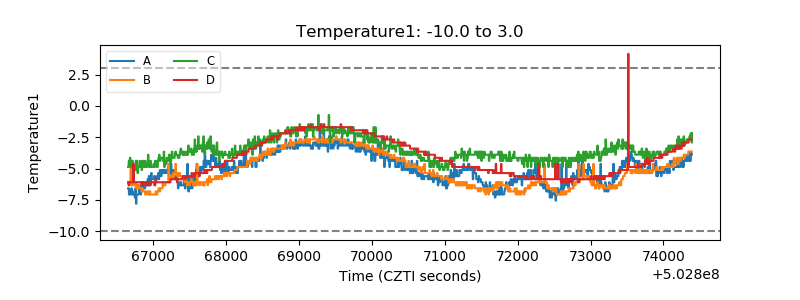 |
| Veto HV Monitor | 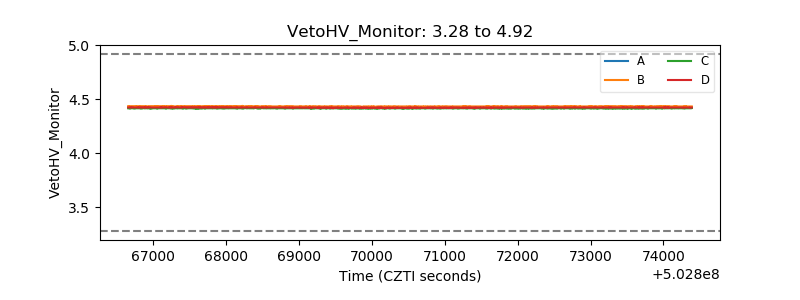 |
| Veto LLD | 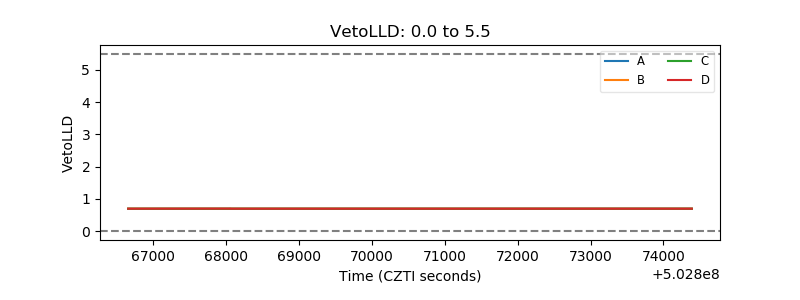 |
| Alpha Counter | 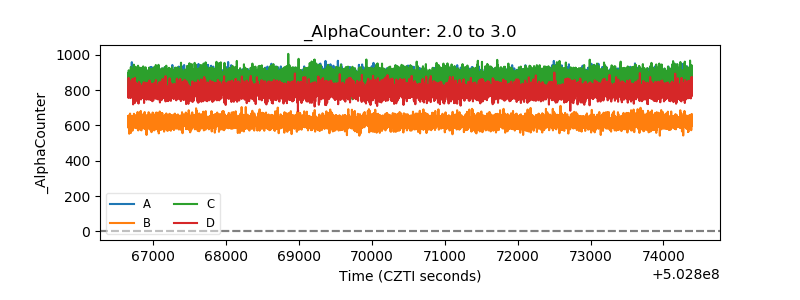 |
| _CPM_Rate | 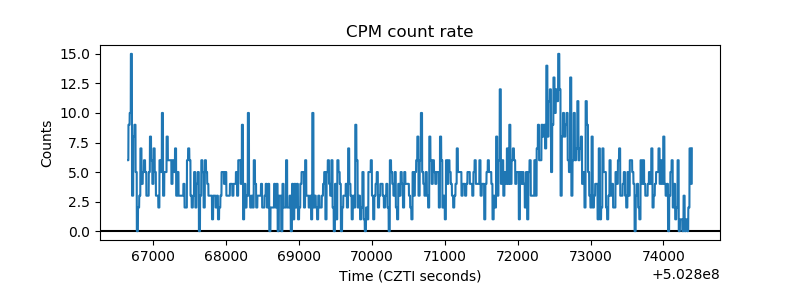 |
| CZT Counter | 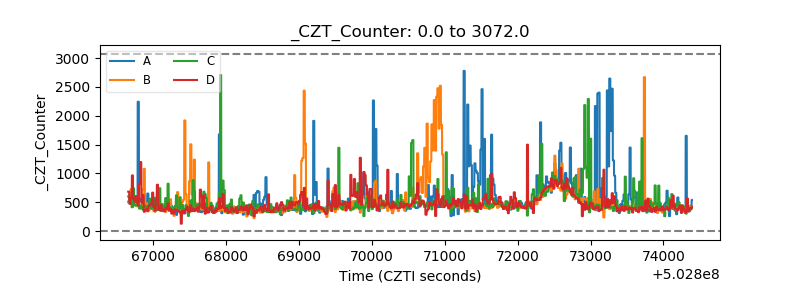 |
| +2.5 Volts monitor |  |
| +5 Volts monitor | 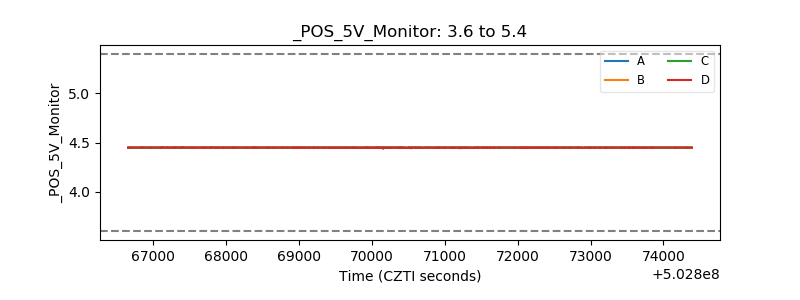 |
| _ROLL_ROT | 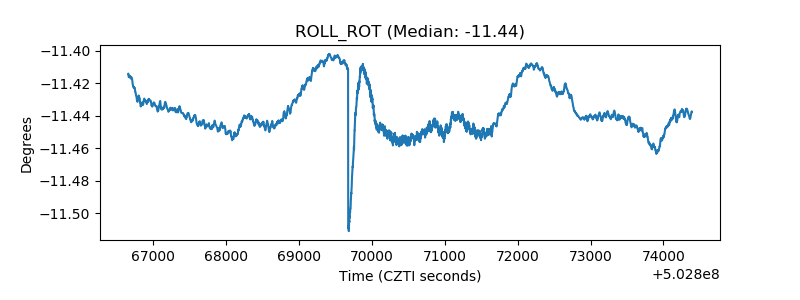 |
| _Roll_DEC | 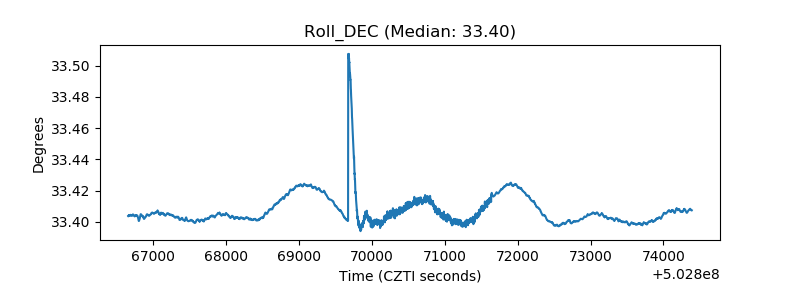 |
| _Roll_RA | 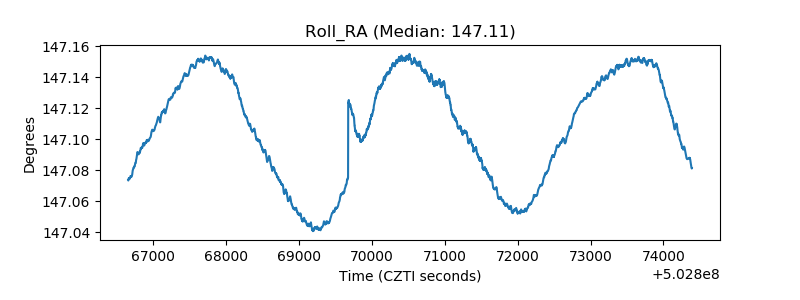 |
| Veto Counter | 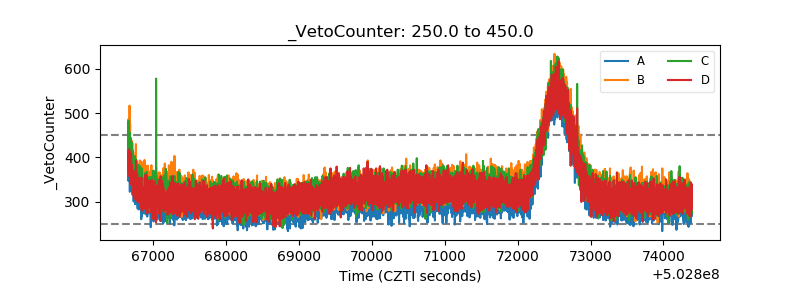 |