| Param | Original file | Final file |
|---|---|---|
| Filename | modeM0/AS1A14_022T16_9000006532_55160cztM0_level2.fits | modeM0/AS1A14_022T16_9000006532_55160cztM0_level2_quad_clean.evt |
| Size (bytes) | 451,068,480 | 99,694,080 |
| Size | 430.2 MB | 95.1 MB |
| Events in quadrant A | 5,059,304 | 628,670 |
| Events in quadrant B | 3,708,468 | 698,624 |
| Events in quadrant C | 3,860,509 | 615,463 |
| Events in quadrant D | 3,513,433 | 578,315 |
| Mode SS | |||
|---|---|---|---|
| Quadrant | BADHDUFLAG | Total packets | Discarded packets |
| A | 0 | 144 | 0 |
| B | 0 | 144 | 0 |
| C | 0 | 144 | 0 |
| D | 0 | 144 | 0 |
| Mode M0 | |||
|---|---|---|---|
| Quadrant | BADHDUFLAG | Total packets | Discarded packets |
| A | 0 | 20054 | 3 |
| B | 0 | 16453 | 0 |
| C | 0 | 16686 | 0 |
| D | 0 | 15760 | 0 |
| Quadrant | Total seconds | Saturated seconds | Saturation percentage |
|---|---|---|---|
| A | 7140 | 386 | 5.406162% |
| B | 7141 | 114 | 1.596415% |
| C | 7141 | 109 | 1.526397% |
| D | 7141 | 115 | 1.610419% |
Noise dominated data is calculated using 1-second bins in cleaned event files. If a bin has >2000 counts, and if more than 50% of those come from <1% of pixels, then it is considered to be noise-dominated and hence unusable.
| Quadrant | # 1 sec bins | Bins with >0 counts | Bins with >2000 counts | High rate bins dominated by noise | Noise dominated (total time) | Noise dominated (detector-on time) | Marked lightcurve |
|---|---|---|---|---|---|---|---|
| A | 7139 | 7139 | 393 | 393 | 5.50% | 5.50% | 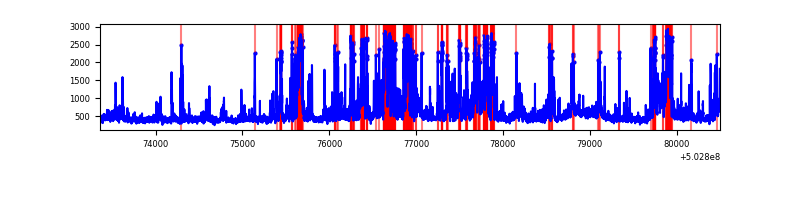 |
| B | 7140 | 7140 | 98 | 98 | 1.37% | 1.37% | 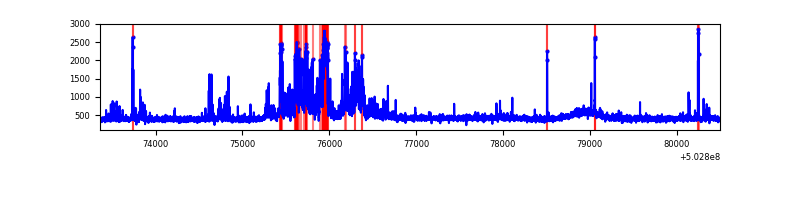 |
| C | 7141 | 7141 | 123 | 123 | 1.72% | 1.72% | 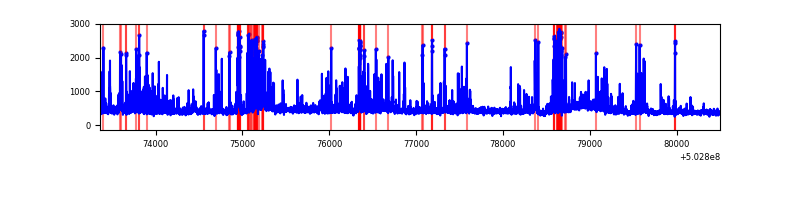 |
| D | 7141 | 7141 | 22 | 22 | 0.31% | 0.31% | 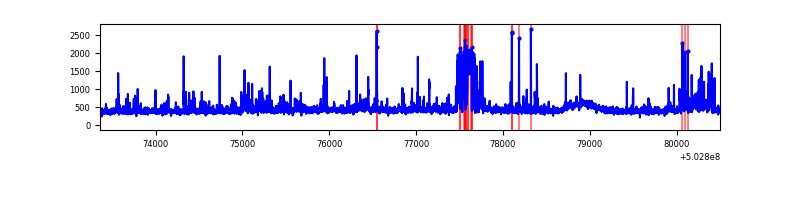 |
Top three noisy pixels from each quadrant. If the there are fewer than three noisy pixels in the level2.evt file, extra rows are filled as -1
| Pixel properties | Quadrant properties | ||||||
|---|---|---|---|---|---|---|---|
| Quadrant | DetID | PixID | Counts | Sigma | Mean | Median | Sigma |
| A | 3 | 78 | 1921302 | 10691.21 | 723 | 706 | 179.6 |
| A | 0 | 8 | 239869 | 1331.33 | 723 | 706 | 179.6 |
| A | 12 | 115 | 27986 | 151.86 | 723 | 706 | 179.6 |
| B | 2 | 249 | 715137 | 4617.04 | 723 | 697 | 154.7 |
| B | 5 | 185 | 55715 | 355.55 | 723 | 697 | 154.7 |
| B | 12 | 111 | 19316 | 120.32 | 723 | 697 | 154.7 |
| C | 13 | 3 | 664411 | 3426.71 | 706 | 698 | 193.7 |
| C | 1 | 16 | 136169 | 699.43 | 706 | 698 | 193.7 |
| C | 6 | 223 | 58580 | 298.84 | 706 | 698 | 193.7 |
| D | 2 | 172 | 262185 | 1317.18 | 704 | 675 | 198.5 |
| D | 11 | 129 | 149432 | 749.26 | 704 | 675 | 198.5 |
| D | 2 | 249 | 142701 | 715.36 | 704 | 675 | 198.5 |
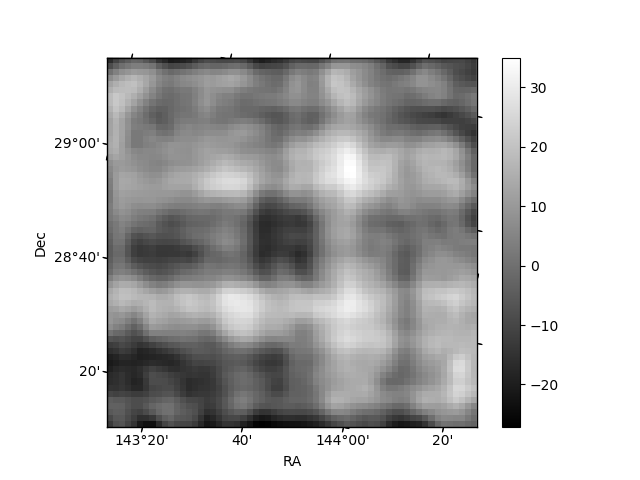
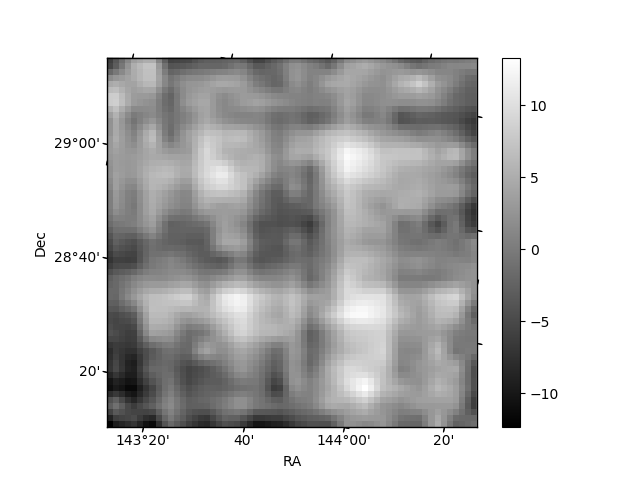
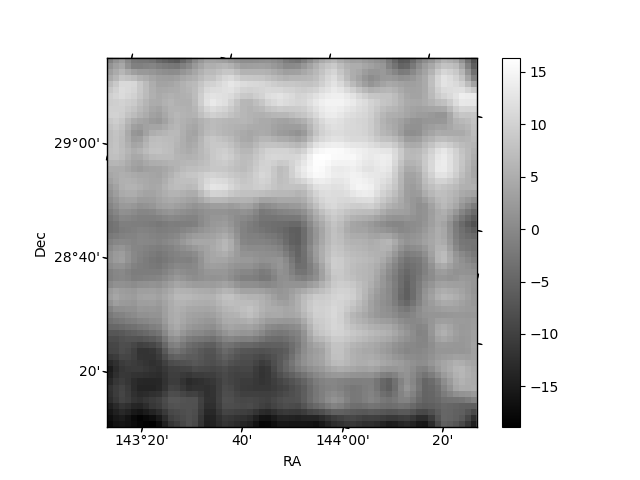
Histogram calculated using DETX and DETY for each event in the final _common_clean file
| Quadrant A | 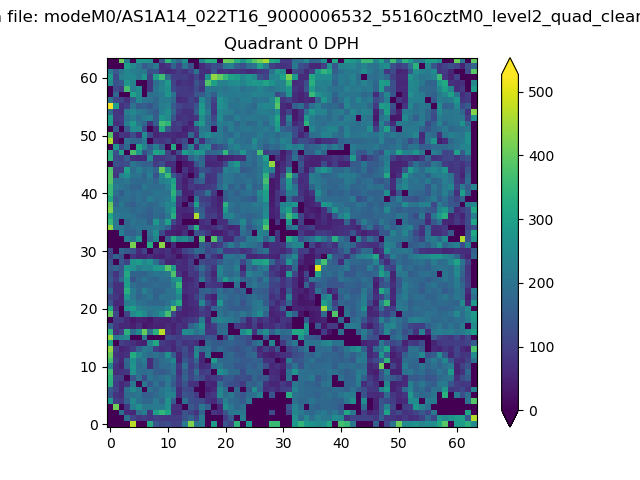 |
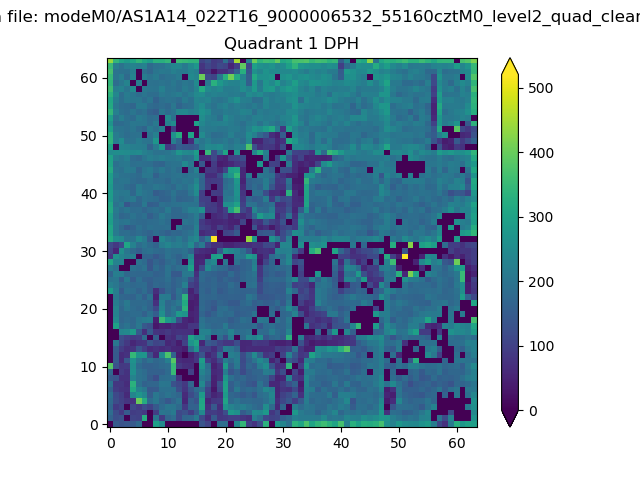 |
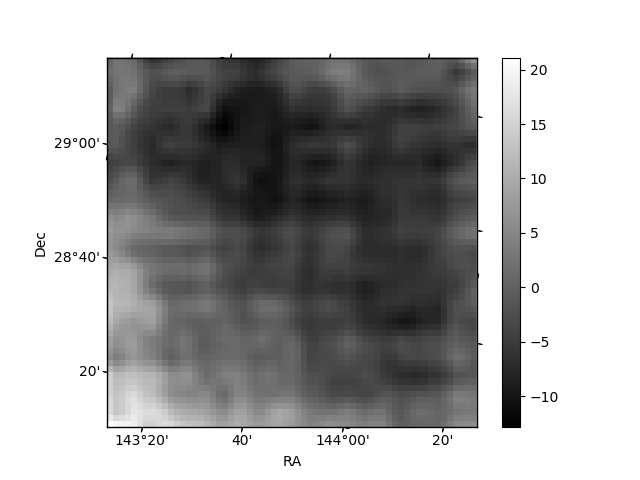
Quadrant B |
|---|---|---|---|
| Quadrant D | 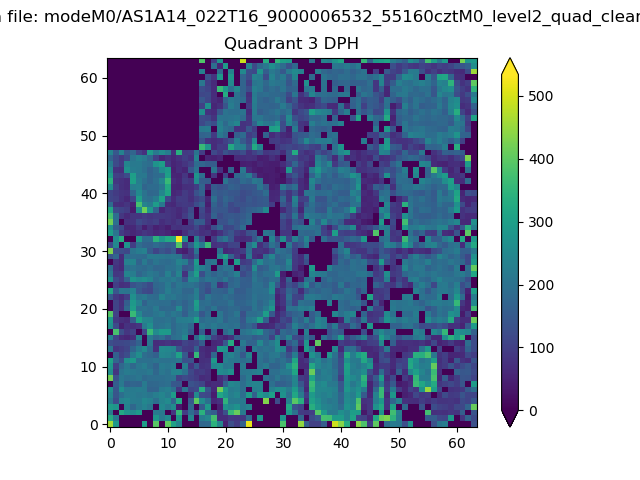 |
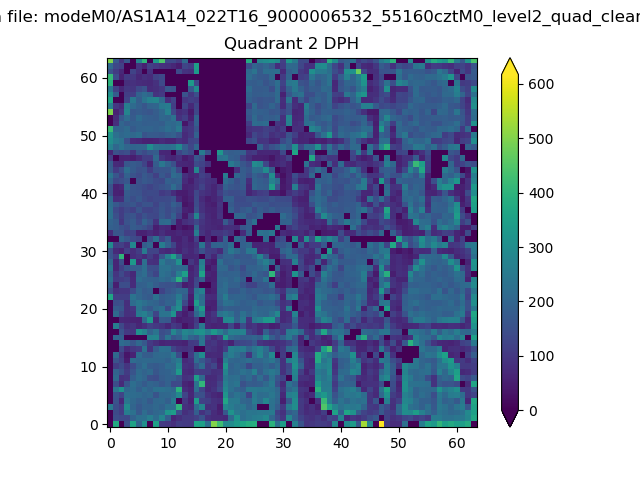 |
Quadrant C |
| Plot type | Count rate plots | Images |
|---|---|---|
| Comparison with Poisson distribution Blue bars denote a histogram of data divided into 1 sec bins. Red curve is a Poisson curve with rate = median count rate of data. |
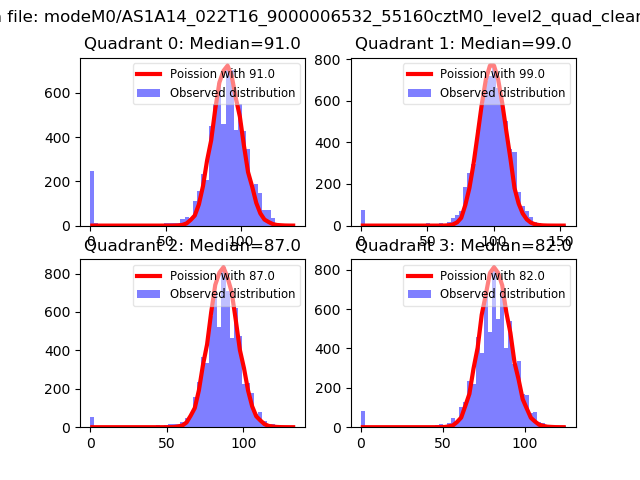 |
 |
| Quadrant-wise count rates Data is divided into 100 sec bins |
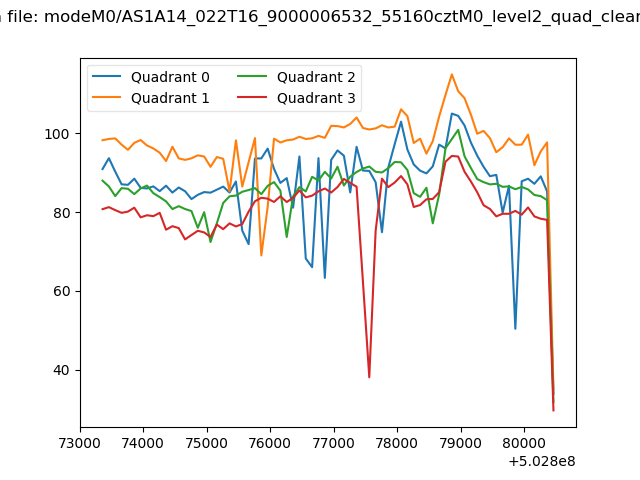 |
|
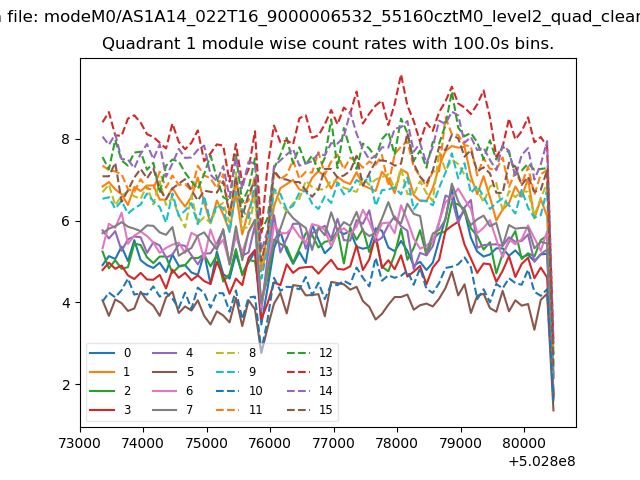
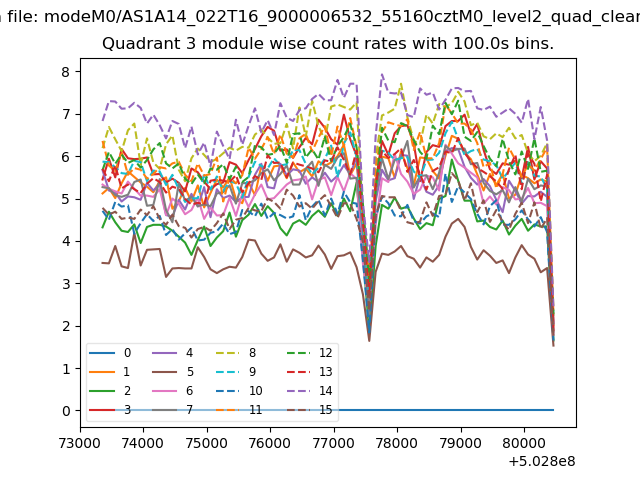
| Module-wise count rates for Quadrant A Data is divided into 100 sec bins |
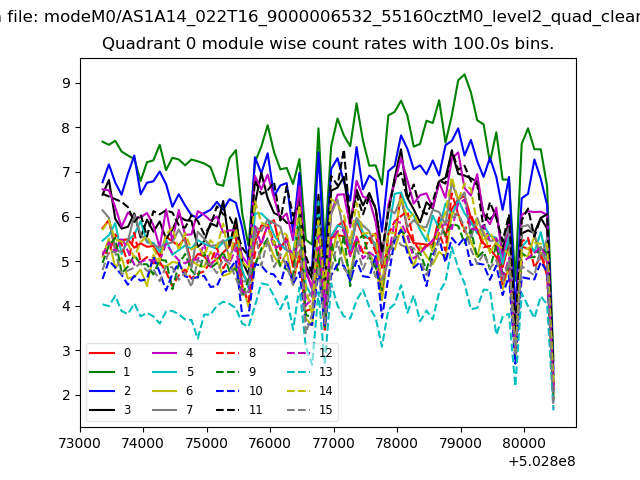 |
 |
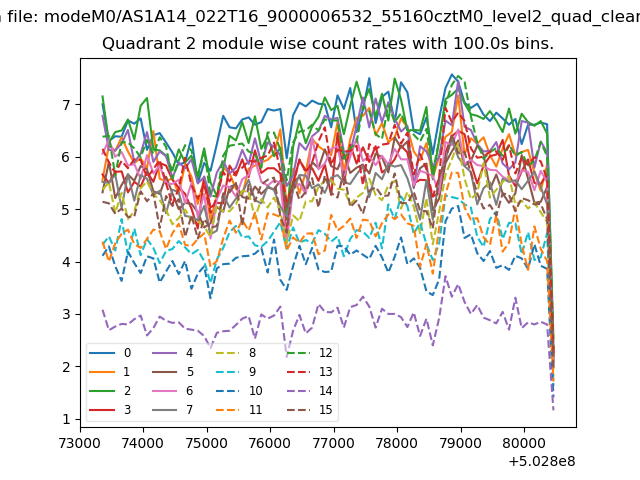
| Module-wise count rates for Quadrant B Data is divided into 100 sec bins |
 |
 |
| Module-wise count rates for Quadrant C Data is divided into 100 sec bins |
 |
 |
| Module-wise count rates for Quadrant D Data is divided into 100 sec bins |
 |
 |
| Parameter | Plot |
|---|---|
| CZT HV Monitor | 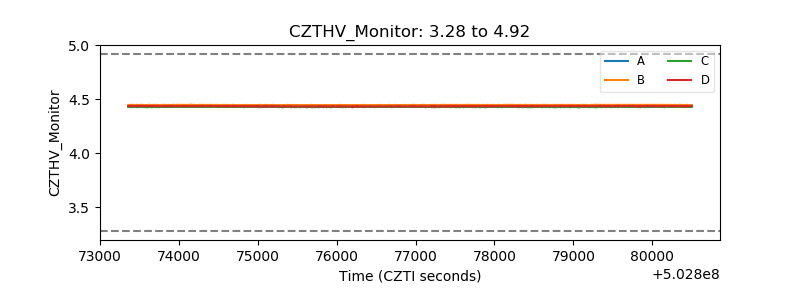 |
| D_VDD | 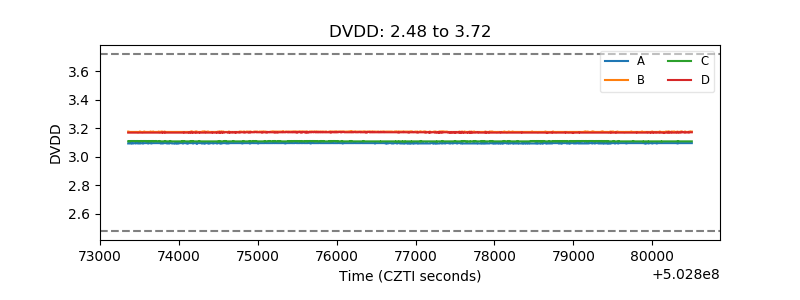 |
| Temperature 1 | 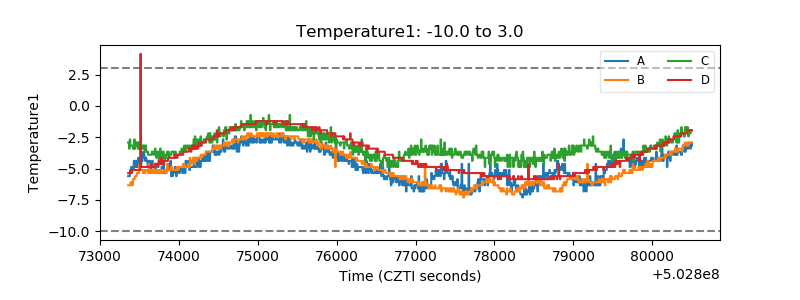 |
| Veto HV Monitor | 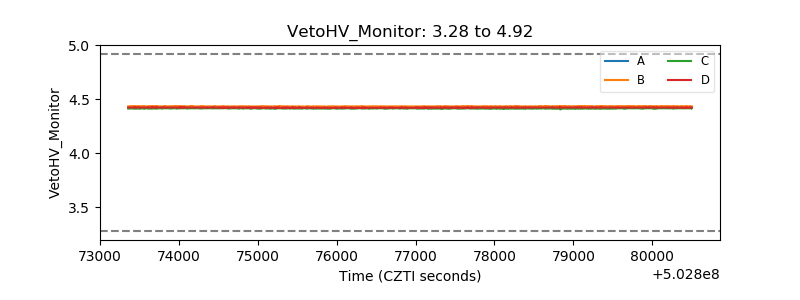 |
| Veto LLD |  |
| Alpha Counter | 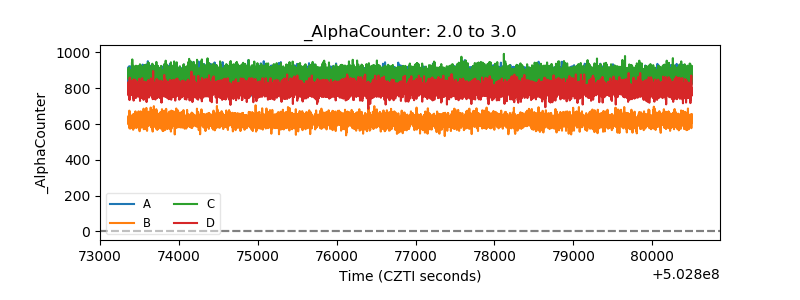 |
| _CPM_Rate | 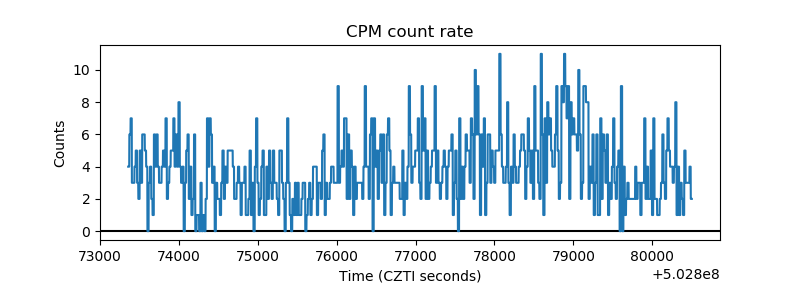 |
| CZT Counter | 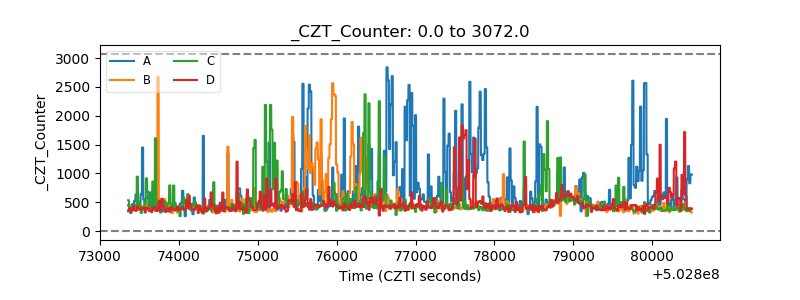 |
| +2.5 Volts monitor |  |
| +5 Volts monitor | 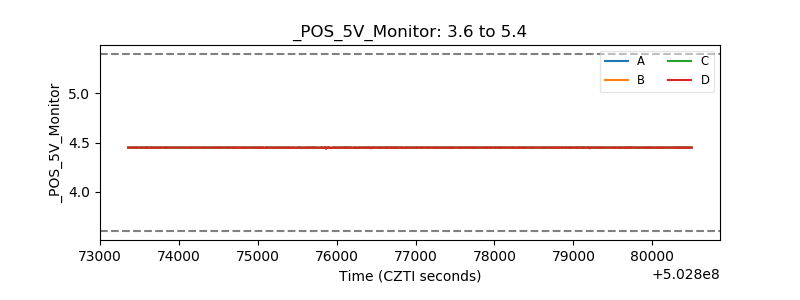 |
| _ROLL_ROT | 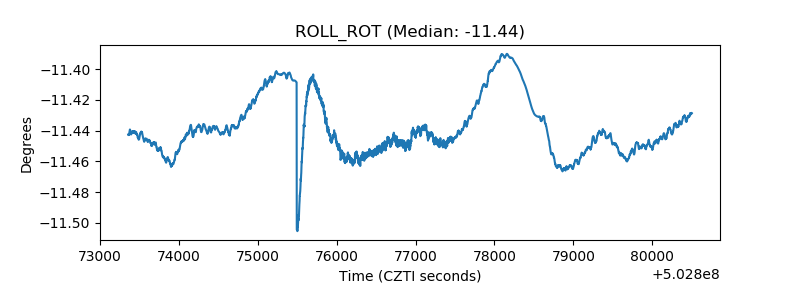 |
| _Roll_DEC | 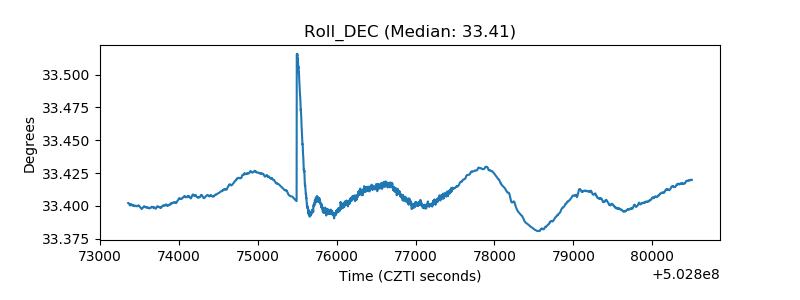 |
| _Roll_RA | 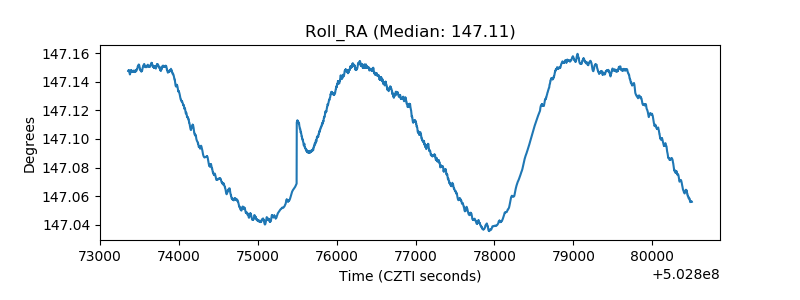 |
| Veto Counter | 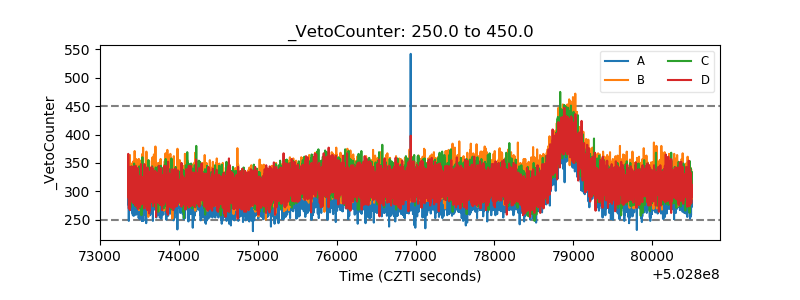 |