| Param | Original file | Final file |
|---|---|---|
| Filename | modeM0/AS1A14_022T16_9000006532_55161cztM0_level2.fits | modeM0/AS1A14_022T16_9000006532_55161cztM0_level2_quad_clean.evt |
| Size (bytes) | 481,553,280 | 102,530,880 |
| Size | 459.2 MB | 97.8 MB |
| Events in quadrant A | 5,895,391 | 644,508 |
| Events in quadrant B | 3,537,056 | 719,807 |
| Events in quadrant C | 3,626,457 | 632,620 |
| Events in quadrant D | 4,196,964 | 596,894 |
| Mode SS | |||
|---|---|---|---|
| Quadrant | BADHDUFLAG | Total packets | Discarded packets |
| A | 0 | 148 | 0 |
| B | 0 | 148 | 0 |
| C | 0 | 148 | 0 |
| D | 0 | 148 | 0 |
| Mode M0 | |||
|---|---|---|---|
| Quadrant | BADHDUFLAG | Total packets | Discarded packets |
| A | 0 | 22604 | 0 |
| B | 0 | 16129 | 0 |
| C | 0 | 16429 | 0 |
| D | 0 | 17758 | 0 |
| Quadrant | Total seconds | Saturated seconds | Saturation percentage |
|---|---|---|---|
| A | 7332 | 452 | 6.164757% |
| B | 7333 | 104 | 1.418246% |
| C | 7333 | 91 | 1.240965% |
| D | 7333 | 108 | 1.472794% |
Noise dominated data is calculated using 1-second bins in cleaned event files. If a bin has >2000 counts, and if more than 50% of those come from <1% of pixels, then it is considered to be noise-dominated and hence unusable.
| Quadrant | # 1 sec bins | Bins with >0 counts | Bins with >2000 counts | High rate bins dominated by noise | Noise dominated (total time) | Noise dominated (detector-on time) | Marked lightcurve |
|---|---|---|---|---|---|---|---|
| A | 7332 | 7332 | 376 | 376 | 5.13% | 5.13% | 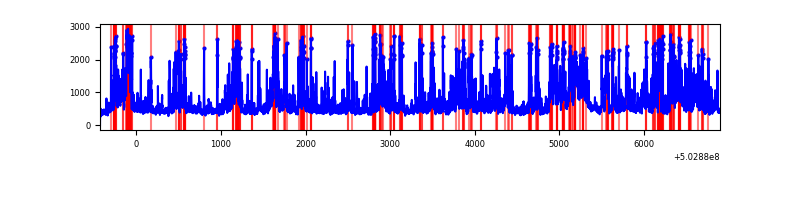 |
| B | 7333 | 7333 | 64 | 64 | 0.87% | 0.87% | 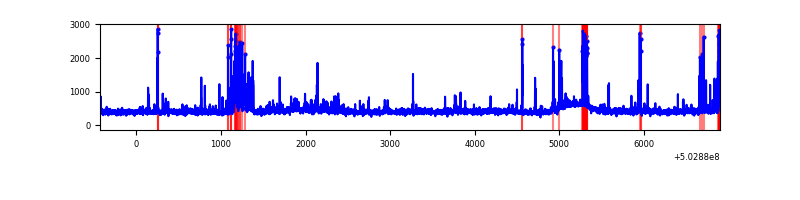 |
| C | 7333 | 7333 | 76 | 76 | 1.04% | 1.04% | 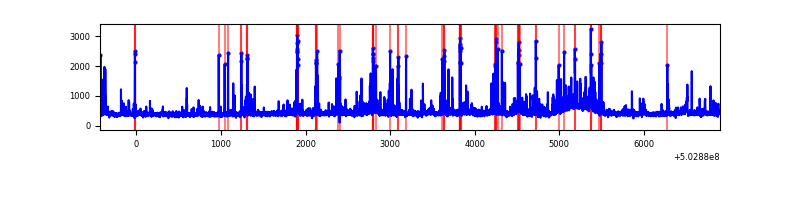 |
| D | 7333 | 7333 | 114 | 114 | 1.55% | 1.55% | 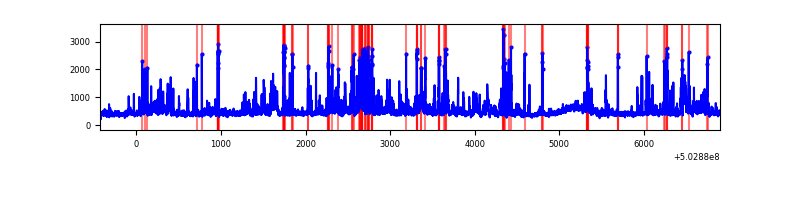 |
Top three noisy pixels from each quadrant. If the there are fewer than three noisy pixels in the level2.evt file, extra rows are filled as -1
| Pixel properties | Quadrant properties | ||||||
|---|---|---|---|---|---|---|---|
| Quadrant | DetID | PixID | Counts | Sigma | Mean | Median | Sigma |
| A | 3 | 78 | 2610799 | 13992.64 | 751 | 732 | 186.5 |
| A | 11 | 191 | 200999 | 1073.63 | 751 | 732 | 186.5 |
| A | 0 | 8 | 60322 | 319.46 | 751 | 732 | 186.5 |
| B | 5 | 185 | 204419 | 1257.71 | 749 | 723 | 162.0 |
| B | 2 | 249 | 172220 | 1058.9 | 749 | 723 | 162.0 |
| B | 4 | 81 | 134177 | 824.0 | 749 | 723 | 162.0 |
| C | 13 | 3 | 268859 | 1327.93 | 735 | 728 | 201.9 |
| C | 10 | 22 | 111289 | 547.56 | 735 | 728 | 201.9 |
| C | 14 | 254 | 80918 | 397.15 | 735 | 728 | 201.9 |
| D | 11 | 176 | 440401 | 2142.36 | 734 | 705 | 205.2 |
| D | 2 | 249 | 384618 | 1870.56 | 734 | 705 | 205.2 |
| D | 11 | 129 | 225552 | 1095.54 | 734 | 705 | 205.2 |
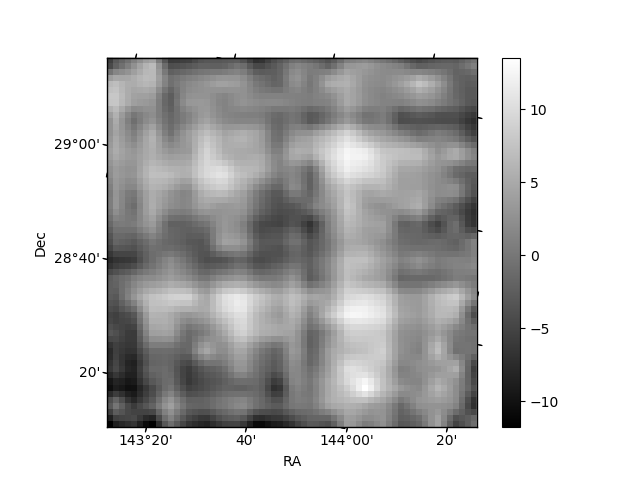
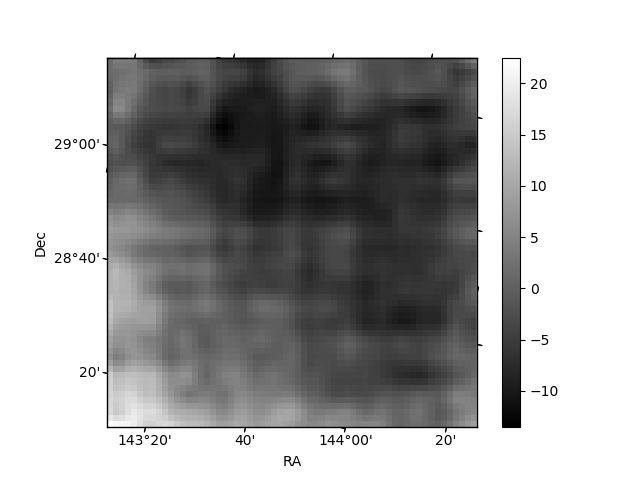
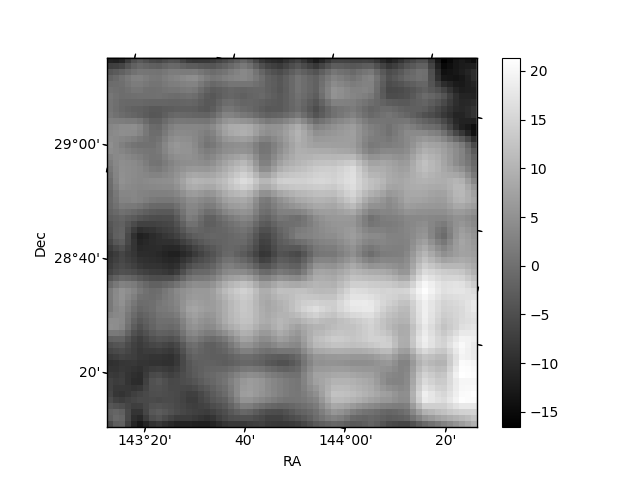
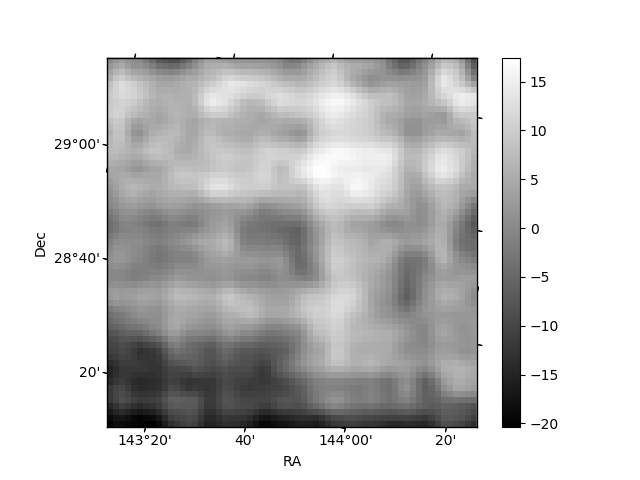
Histogram calculated using DETX and DETY for each event in the final _common_clean file
| Quadrant A | 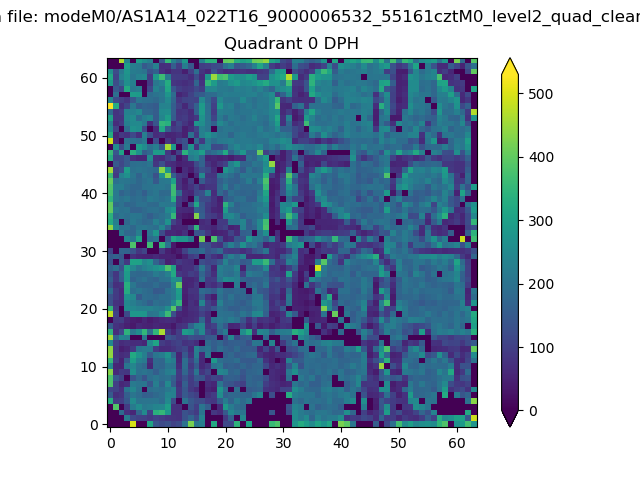 |
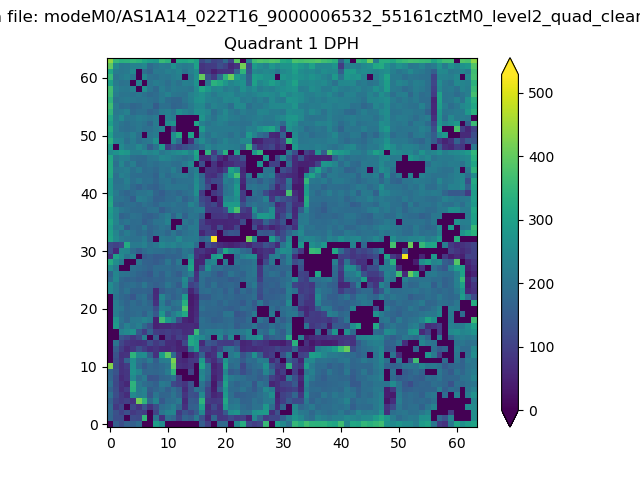 |
Quadrant B |
|---|---|---|---|
| Quadrant D | 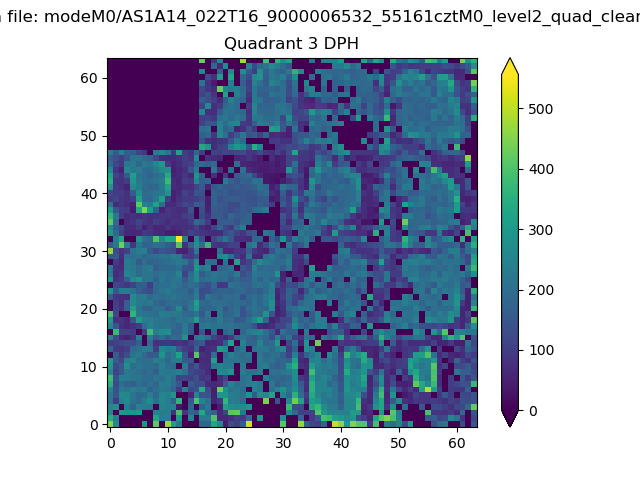 |
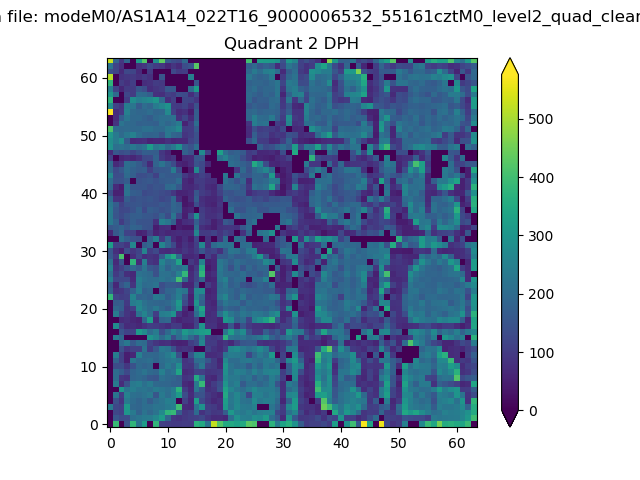 |
Quadrant C |
| Plot type | Count rate plots | Images |
|---|---|---|
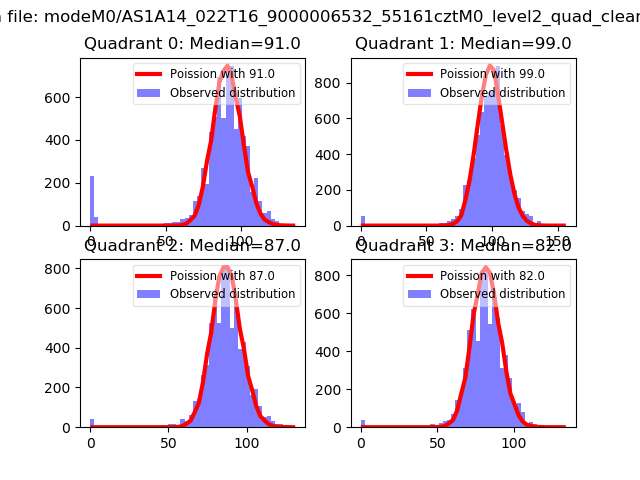
| Comparison with Poisson distribution Blue bars denote a histogram of data divided into 1 sec bins. Red curve is a Poisson curve with rate = median count rate of data. |
 |
 |
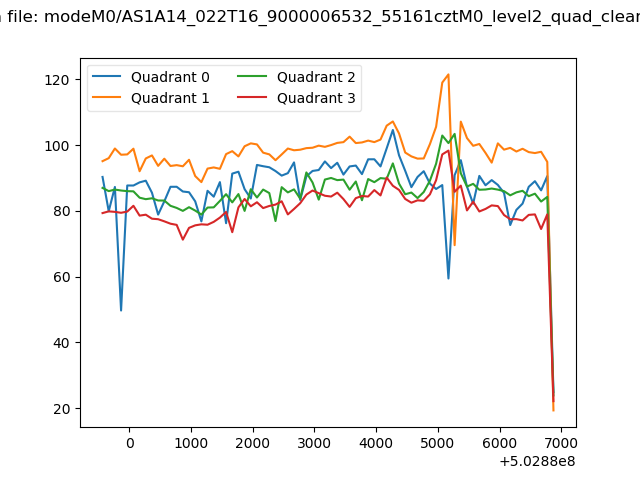
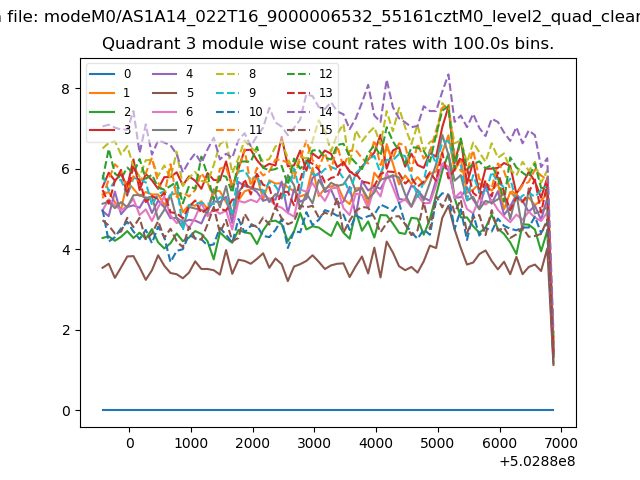
| Quadrant-wise count rates Data is divided into 100 sec bins |
 |
|
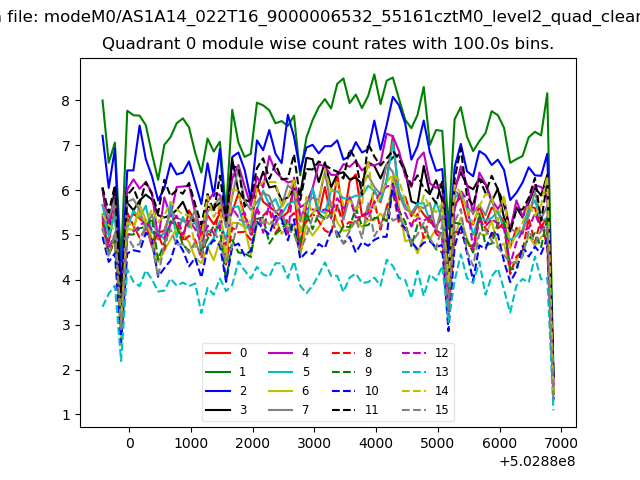
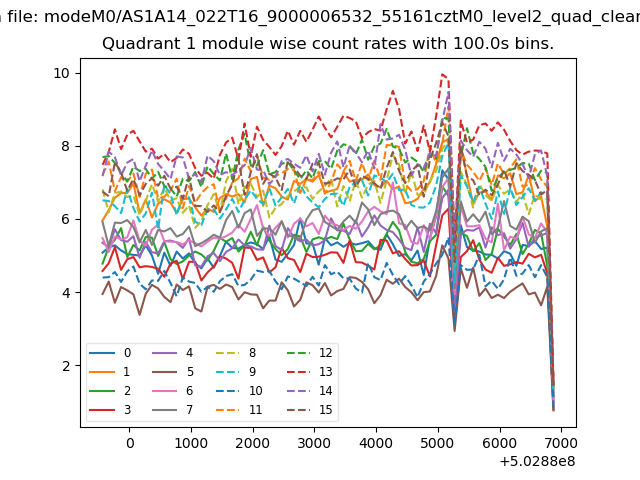
| Module-wise count rates for Quadrant A Data is divided into 100 sec bins |
 |
 |
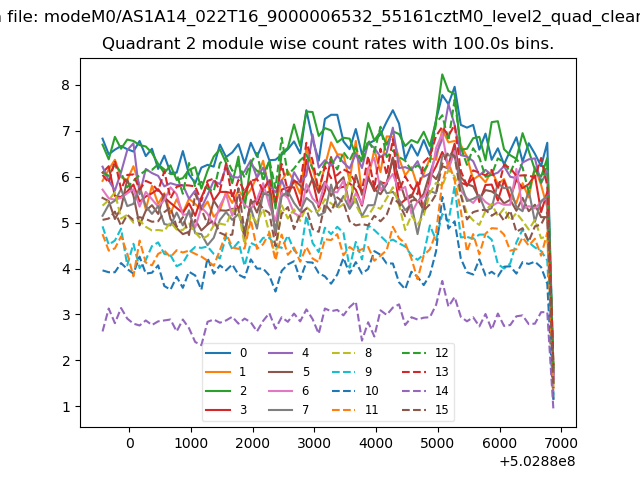
| Module-wise count rates for Quadrant B Data is divided into 100 sec bins |
 |
 |
| Module-wise count rates for Quadrant C Data is divided into 100 sec bins |
 |
 |
| Module-wise count rates for Quadrant D Data is divided into 100 sec bins |
 |
 |
| Parameter | Plot |
|---|---|
| CZT HV Monitor | 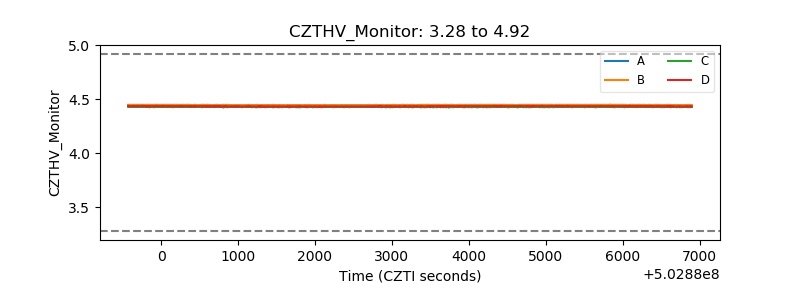 |
| D_VDD | 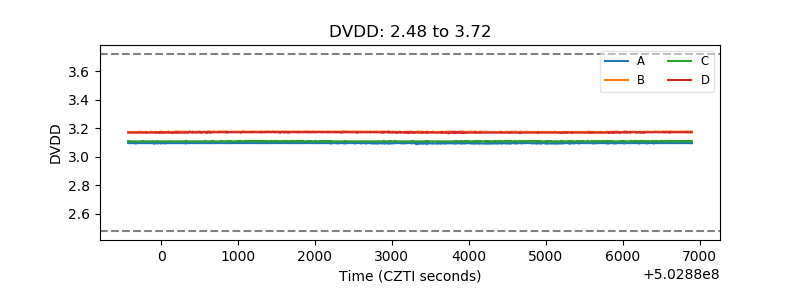 |
| Temperature 1 | 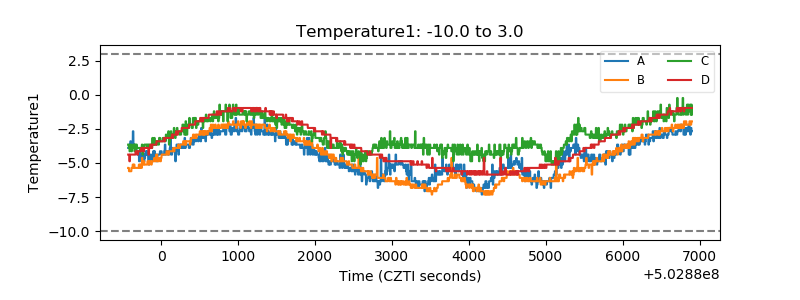 |
| Veto HV Monitor | 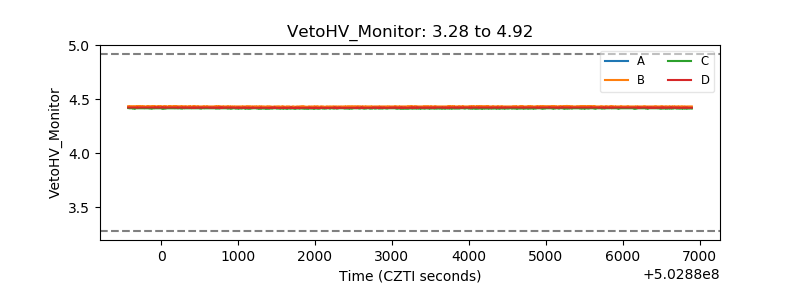 |
| Veto LLD | 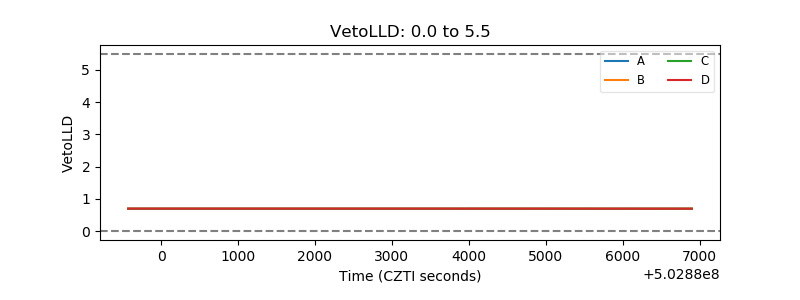 |
| Alpha Counter | 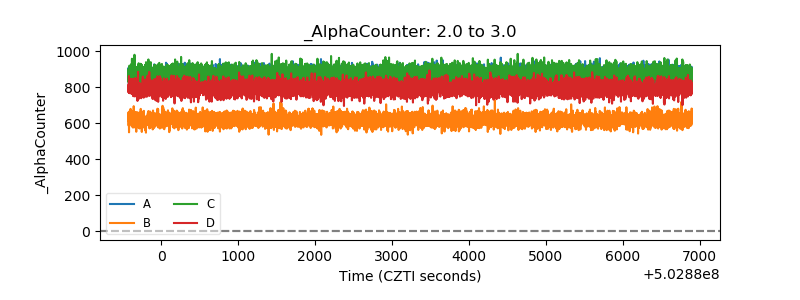 |
| _CPM_Rate | 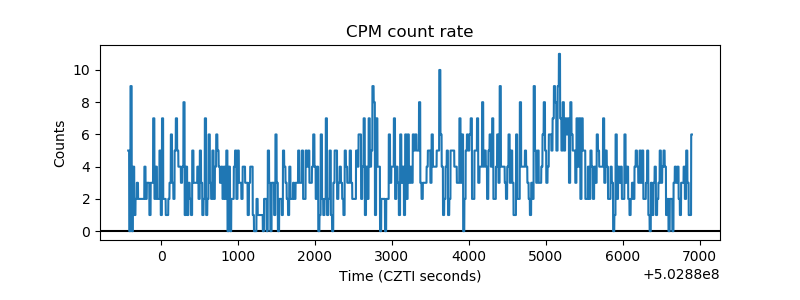 |
| CZT Counter | 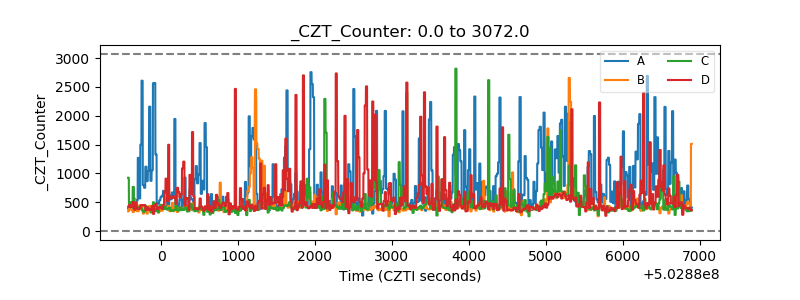 |
| +2.5 Volts monitor |  |
| +5 Volts monitor |  |
| _ROLL_ROT | 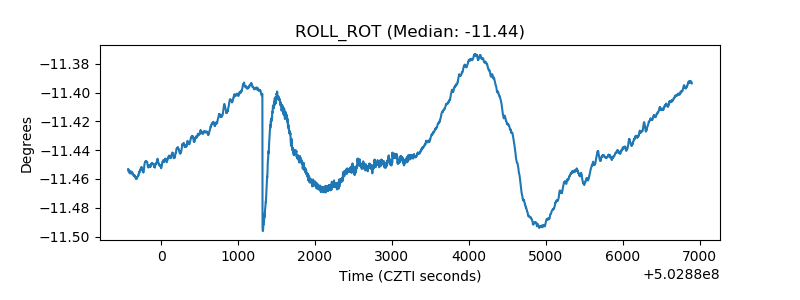 |
| _Roll_DEC | 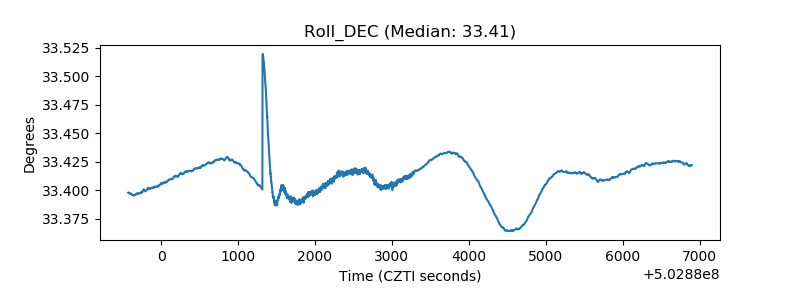 |
| _Roll_RA | 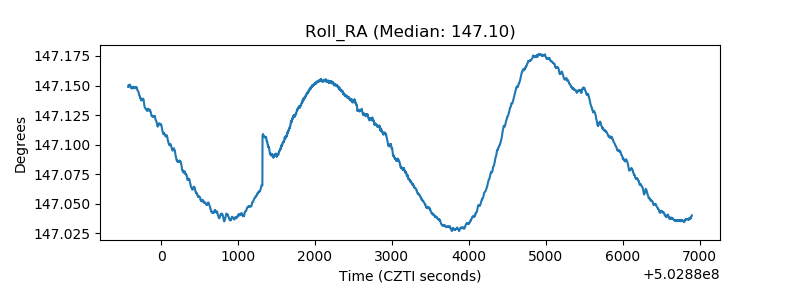 |
| Veto Counter | 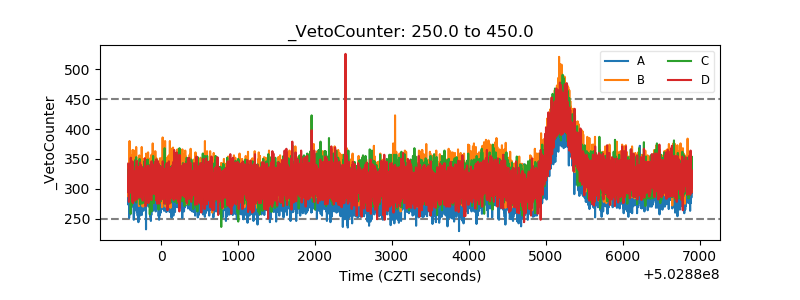 |