| Param | Original file | Final file |
|---|---|---|
| Filename | modeM0/AS1A14_022T16_9000006532_55164cztM0_level2.fits | modeM0/AS1A14_022T16_9000006532_55164cztM0_level2_quad_clean.evt |
| Size (bytes) | 1,253,998,080 | 237,340,800 |
| Size | 1.2 GB | 226.3 MB |
| Events in quadrant A | 16,235,918 | 1,417,543 |
| Events in quadrant B | 9,571,753 | 1,651,079 |
| Events in quadrant C | 9,355,050 | 1,466,129 |
| Events in quadrant D | 9,875,418 | 1,421,793 |
| Mode SS | |||
|---|---|---|---|
| Quadrant | BADHDUFLAG | Total packets | Discarded packets |
| A | 0 | 382 | 14 |
| B | 0 | 382 | 18 |
| C | 0 | 382 | 28 |
| D | 0 | 382 | 22 |
| Mode M0 | |||
|---|---|---|---|
| Quadrant | BADHDUFLAG | Total packets | Discarded packets |
| A | 0 | 64203 | 3848 |
| B | 0 | 44059 | 1909 |
| C | 0 | 43298 | 2254 |
| D | 0 | 44483 | 2250 |
| Mode M9 | |||
|---|---|---|---|
| Quadrant | BADHDUFLAG | Total packets | Discarded packets |
| A | 0 | 10 | 1 |
| B | 0 | 10 | 0 |
| C | 0 | 10 | 0 |
| D | 0 | 10 | 0 |
| Quadrant | Total seconds | Saturated seconds | Saturation percentage |
|---|---|---|---|
| A | 17655 | 2064 | 11.690739% |
| B | 17896 | 803 | 4.487036% |
| C | 17862 | 431 | 2.412944% |
| D | 17854 | 419 | 2.346813% |
Noise dominated data is calculated using 1-second bins in cleaned event files. If a bin has >2000 counts, and if more than 50% of those come from <1% of pixels, then it is considered to be noise-dominated and hence unusable.
| Quadrant | # 1 sec bins | Bins with >0 counts | Bins with >2000 counts | High rate bins dominated by noise | Noise dominated (total time) | Noise dominated (detector-on time) | Marked lightcurve |
|---|---|---|---|---|---|---|---|
| A | 19833 | 18264 | 1779 | 1779 | 8.97% | 9.74% | 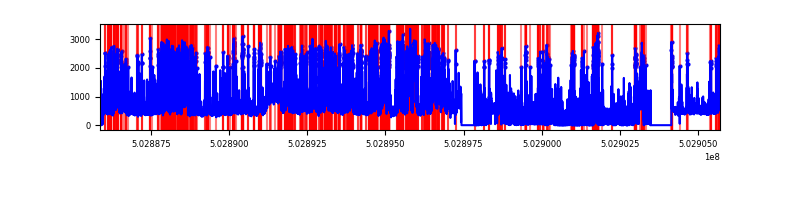 |
| B | 19847 | 18459 | 321 | 321 | 1.62% | 1.74% | 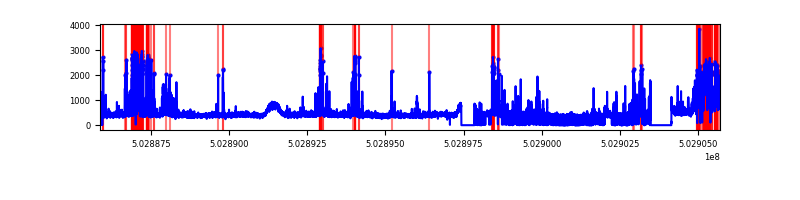 |
| C | 19843 | 18420 | 186 | 186 | 0.94% | 1.01% | 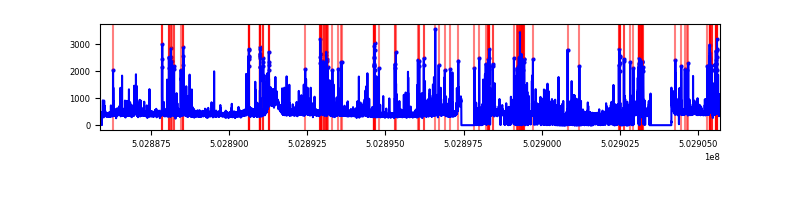 |
| D | 19843 | 18380 | 197 | 197 | 0.99% | 1.07% | 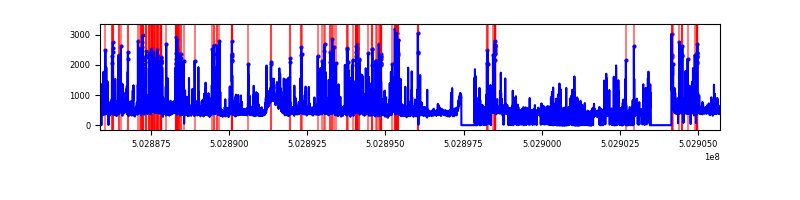 |
Top three noisy pixels from each quadrant. If the there are fewer than three noisy pixels in the level2.evt file, extra rows are filled as -1
| Pixel properties | Quadrant properties | ||||||
|---|---|---|---|---|---|---|---|
| Quadrant | DetID | PixID | Counts | Sigma | Mean | Median | Sigma |
| A | 3 | 78 | 7920894 | 17597.01 | 1820 | 1774 | 450.0 |
| A | 0 | 8 | 521180 | 1154.17 | 1820 | 1774 | 450.0 |
| A | 4 | 78 | 262082 | 578.43 | 1820 | 1774 | 450.0 |
| B | 2 | 249 | 1497844 | 3741.31 | 1868 | 1801 | 399.9 |
| B | 5 | 185 | 400443 | 996.93 | 1868 | 1801 | 399.9 |
| B | 0 | 182 | 223054 | 553.31 | 1868 | 1801 | 399.9 |
| C | 13 | 3 | 586811 | 1161.24 | 1855 | 1842 | 503.7 |
| C | 10 | 22 | 340666 | 672.61 | 1855 | 1842 | 503.7 |
| C | 6 | 223 | 299833 | 591.55 | 1855 | 1842 | 503.7 |
| D | 11 | 129 | 1312479 | 2523.2 | 1853 | 1776 | 519.5 |
| D | 5 | 173 | 173486 | 330.55 | 1853 | 1776 | 519.5 |
| D | 11 | 176 | 157586 | 299.95 | 1853 | 1776 | 519.5 |
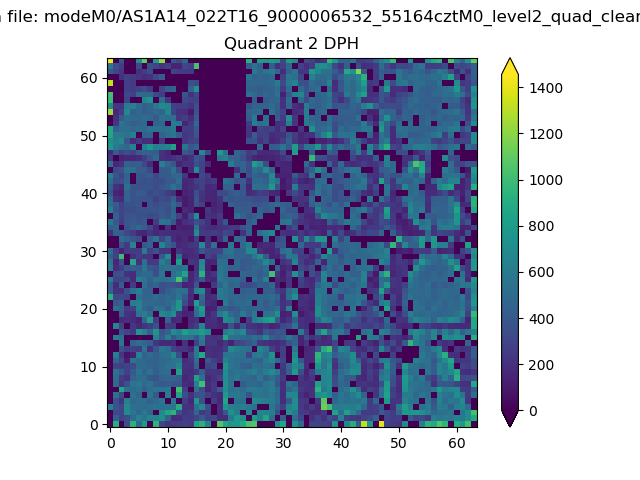
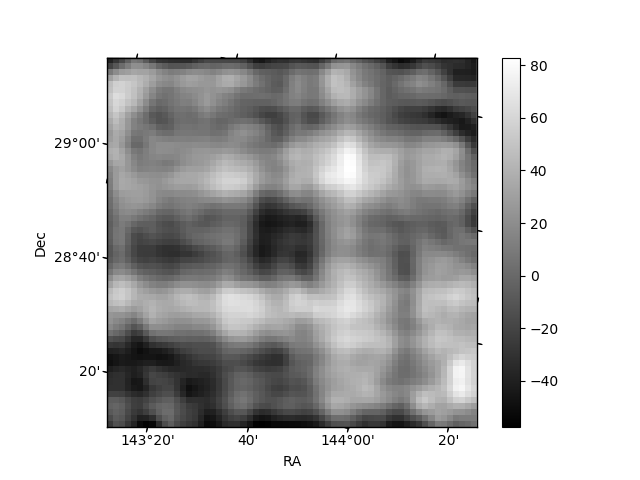
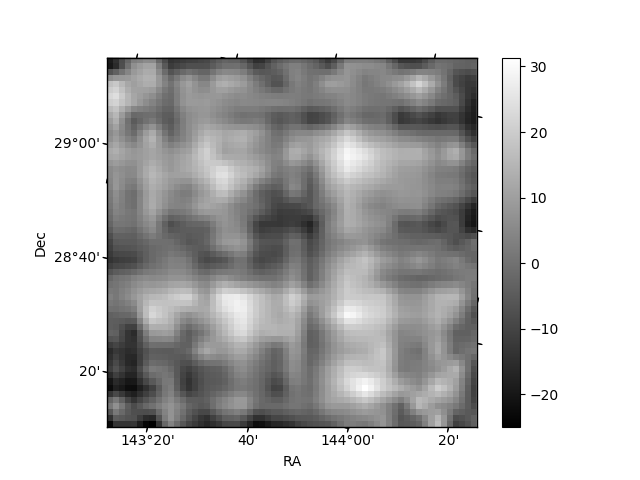
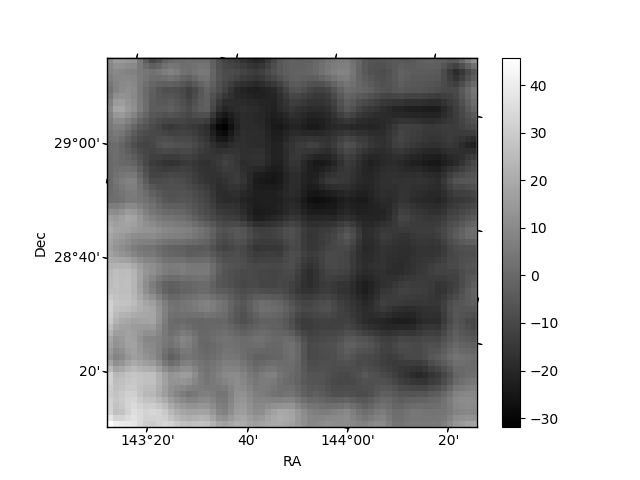
Histogram calculated using DETX and DETY for each event in the final _common_clean file
| Quadrant A | 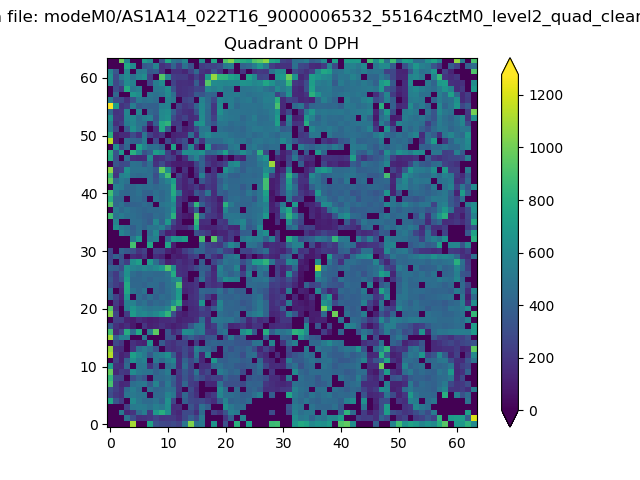 |
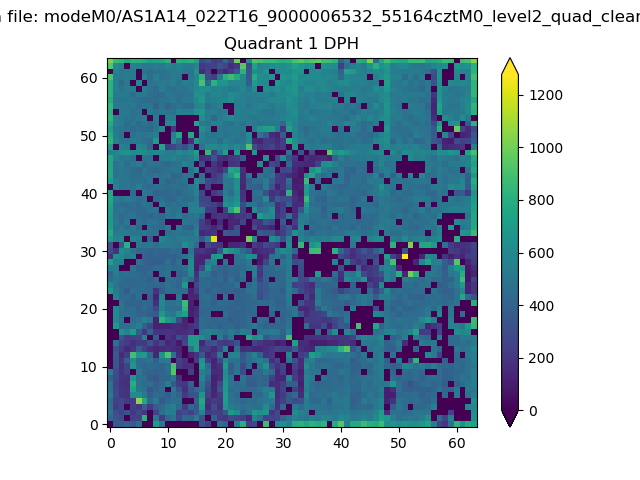 |
Quadrant B |
|---|---|---|---|
| Quadrant D | 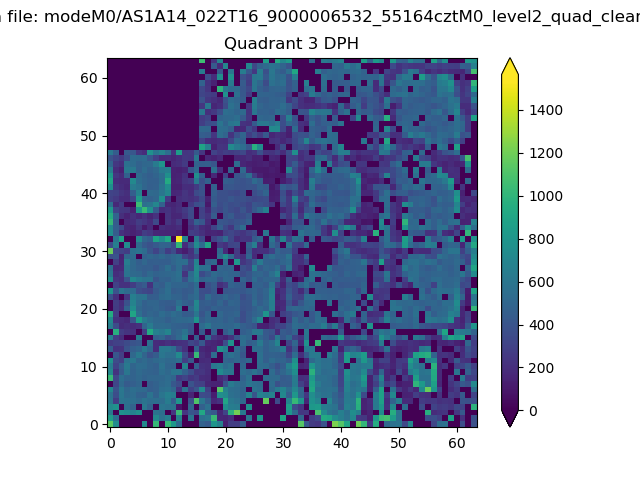 |
 |
Quadrant C |
| Plot type | Count rate plots | Images |
|---|---|---|
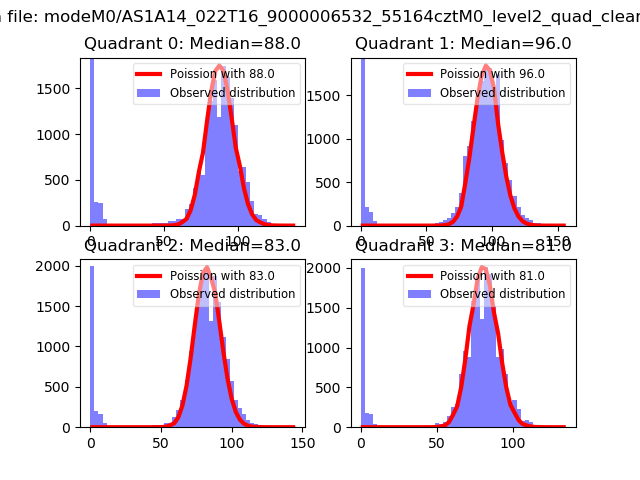
| Comparison with Poisson distribution Blue bars denote a histogram of data divided into 1 sec bins. Red curve is a Poisson curve with rate = median count rate of data. |
 |
 |
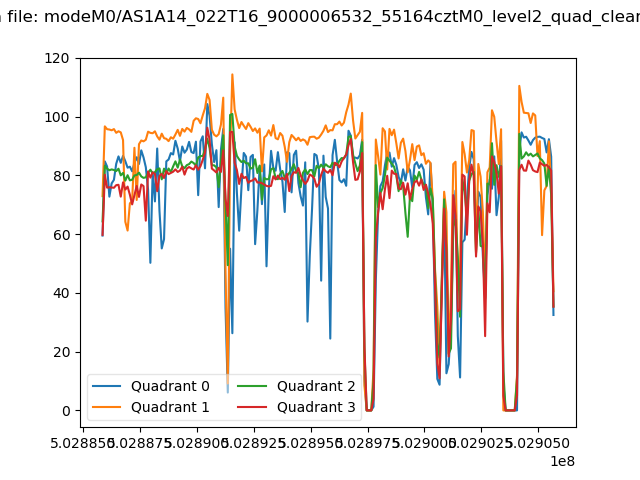
| Quadrant-wise count rates Data is divided into 100 sec bins |
 |
|
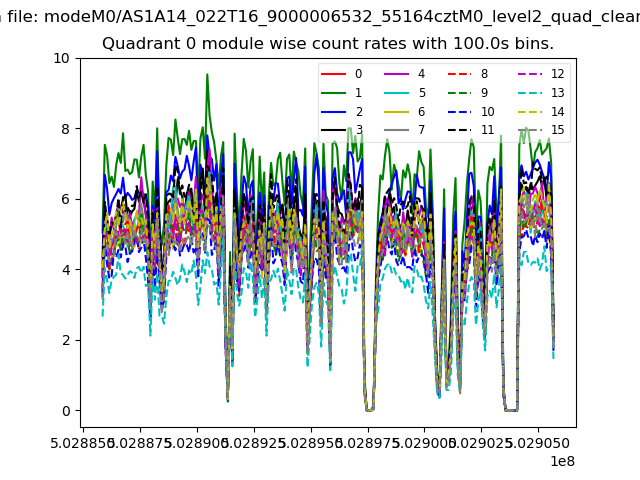
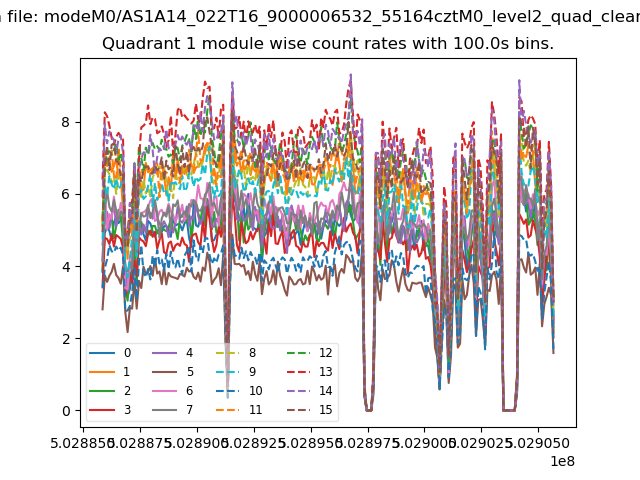
| Module-wise count rates for Quadrant A Data is divided into 100 sec bins |
 |
 |
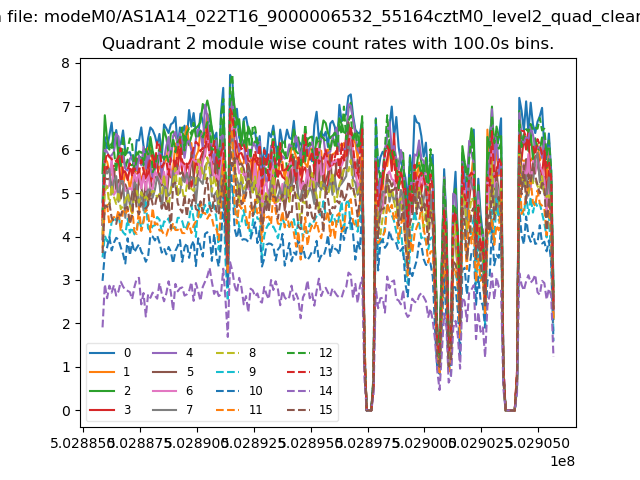
| Module-wise count rates for Quadrant B Data is divided into 100 sec bins |
 |
 |
| Module-wise count rates for Quadrant C Data is divided into 100 sec bins |
 |
 |
| Module-wise count rates for Quadrant D Data is divided into 100 sec bins |
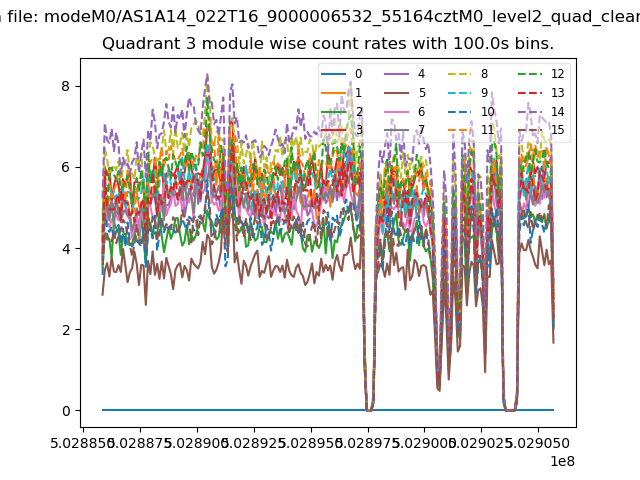 |
 |
| Parameter | Plot |
|---|---|
| CZT HV Monitor | 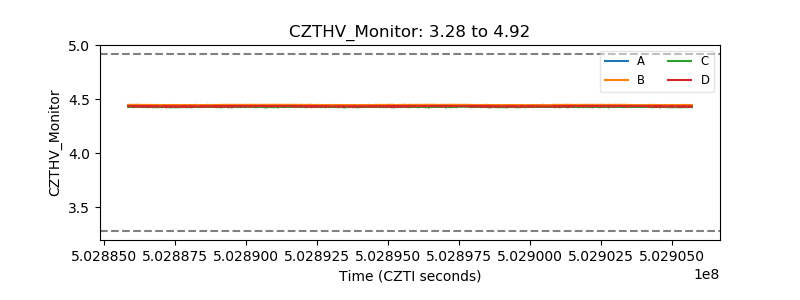 |
| D_VDD | 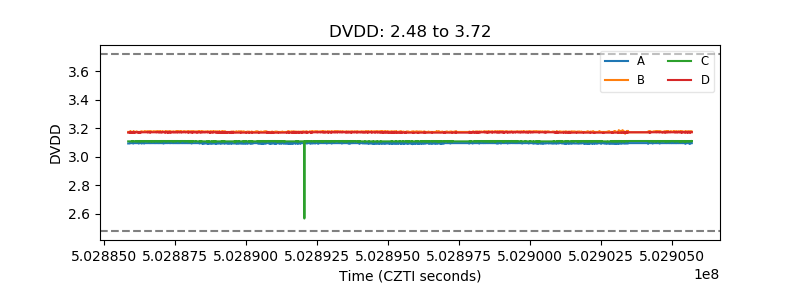 |
| Temperature 1 |  |
| Veto HV Monitor | 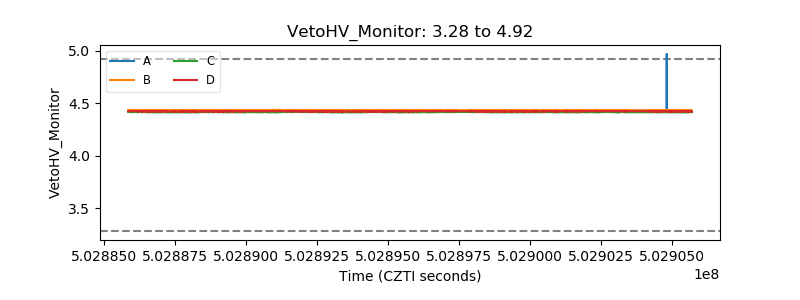 |
| Veto LLD | 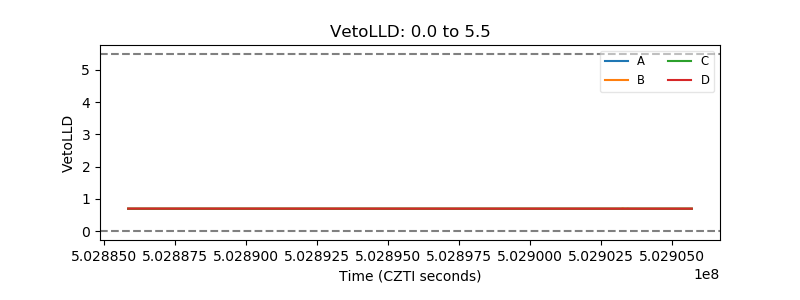 |
| Alpha Counter | 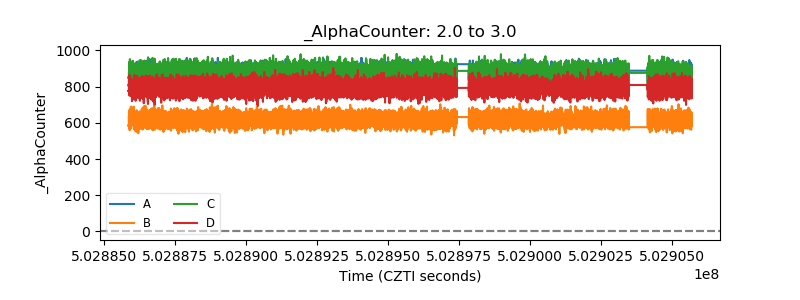 |
| _CPM_Rate | 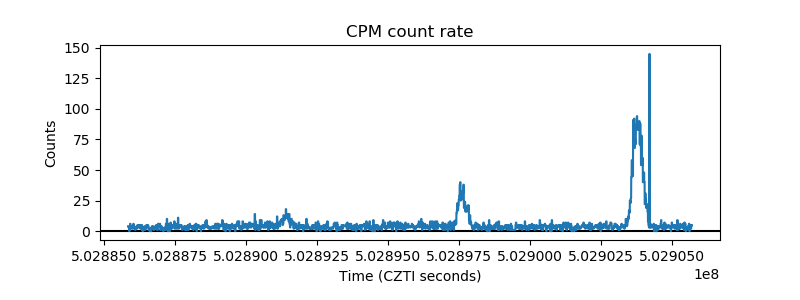 |
| CZT Counter | 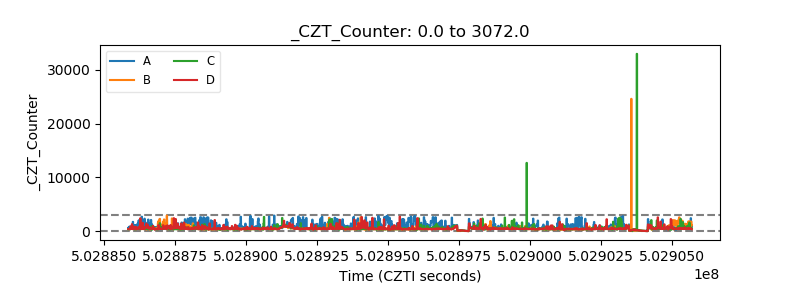 |
| +2.5 Volts monitor |  |
| +5 Volts monitor | 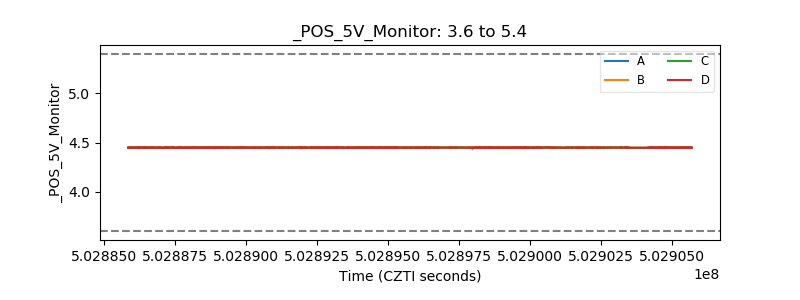 |
| _ROLL_ROT | 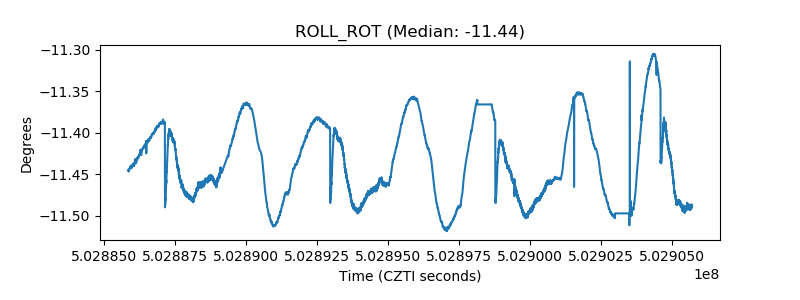 |
| _Roll_DEC | 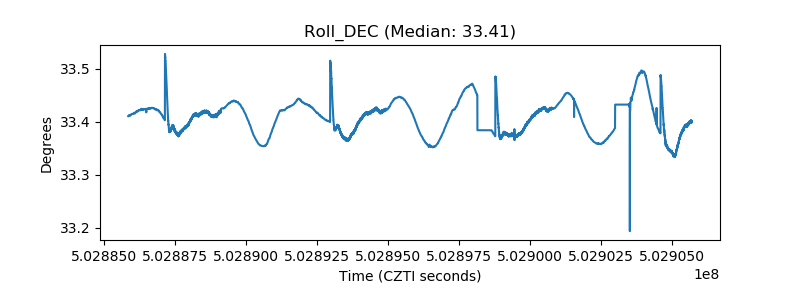 |
| _Roll_RA | 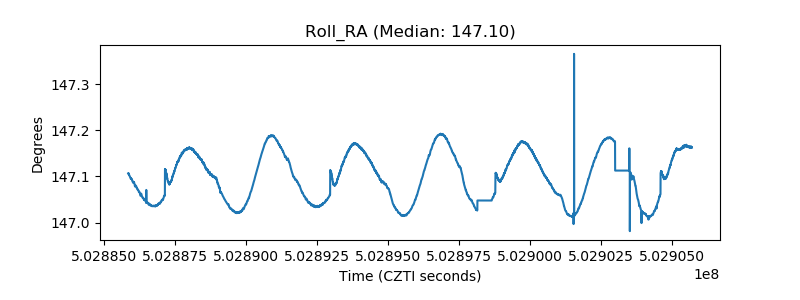 |
| Veto Counter | 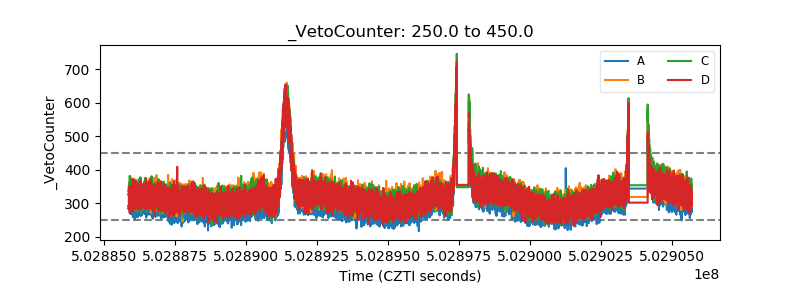 |